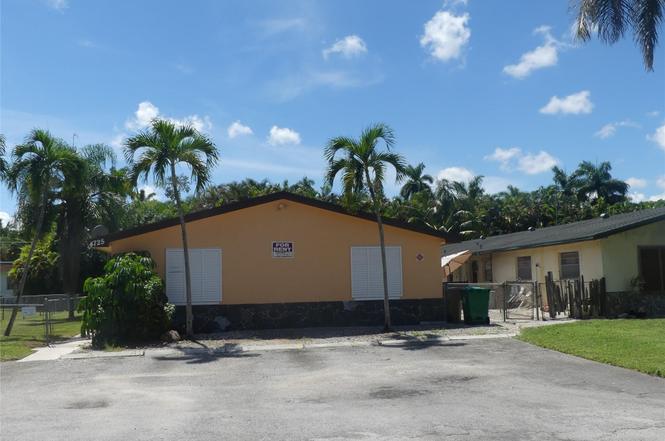
 Fourplex
4725 SW 65th Ave · Davie, FL
Flood risk 1/10 · Minimal
- FEMA flood zone
- X (shaded)
- Chance of flooding over 30 yrs
- 0.0%
- Est. flood insurance / yr
- $507 – $1,088
Fire risk 1/10 · Minimal
- Est. fire insurance / yr
- $947 – $1,759
Heat risk 10/10 · Severe
- Hot days now (above 105°F)
- 7 days/yr
- Hot days in 30 yrs
- 27 days/yr
Wind risk 10/10 · Severe
- Chance of severe wind over 30 yrs
- 99.0%
Air-quality risk 2/10 · Minimal
- Unhealthy air days now
- 2 days/yr
- Unhealthy air days in 30 yrs
- 2 days/yr
Risk factors via First Street. Map © Google.
Why this score? — see what drove the C grade
The composite is a weighted blend of 9 inputs, each scored 0–100. Each bar is that input's sub-score; the figure is the points it added to the 100-point composite (weight × sub-score).
- Cash flow +22.4/30.0
- DSCR +7.2/10.0
- ARV discount +7.2/15.0
- 1% rule +5.9/10.0
- Schools +4.1/10.0
- Livability +4.1/5.0
- Rent growth +2.9/5.0
- Condition / age +2.5/5.0
- Appreciation +0.0/10.0
$769,900
🖨 Deal sheet 📄 Offer letter ✓ Due diligence
Multi-family units
County records classify this as Multi-Family (2-4 Unit). Listing-text estimate: 4 units. confirmed
Listing remarks
Value Add Fourplex in the best Davie location offering ±3,145 SF with a two-year-old roof, featuring 3 (2/1) apartments and studio (no kitchen). HVAC consists of central A/C and wall units. The rear (2/1) apartment features washer/dryer, utility room and screened patio, making it highly tenant/owner friendly. Located in a quiet residential setting just minutes from Hardrock, Nova Southeastern University, Broward College. VALUE-ADD - Income 50% below market comp rents (see attached OM). (0/1) $800; (2/1) $1100; (2/1) $1175; (2/1) Rear Vacant for showing. The occupied units are on lease. Current PGI $54,840 | Market Rent PGI $75,000. Property located in close proximity to Lange Park wh
Key facts
- Built 1972
Neighborhood map
What this means for you Summary
Snapshot
- This is a 2×2bd/1.0ba + 2×1bd/1.0ba units multifamily listed at $770k.
Deal economics
- At list price, monthly cash flow is $1k ($15k/yr) — positive. Per door: $320/mo.
- The deal already cash-flows at list — no discount required.
- Meets the 1% rule at list price ($8k rent vs $770k).
- Cap rate 8.3% vs local median 3.4% in Davie — top-decile yield for the area; either an underpriced asset or a hidden risk that comps aren't pricing in. Stress-test before assuming the spread holds.
Location & tenants
- Location reads 82/100 on livability (#68 in FL, #1,159 nationally) — a professional / high-income tenant draw. Strengths: crime A+, housing A+, health & safety A+; Watch: cost of living D, amenities D-.
- Broward (suburban): math 42% / reading 53% proficiency, ranked #46 of 73 in FL (top 63%) — families likely to look elsewhere, expect single-tenant / working-renter base with shorter leases.
- Zoned schools: Silver Ridge Elementary School (math 49% / reading 65%, grade C+, #781 of 2,144 statewide, top 38%, 961 students, 43% FRL); Driftwood Middle School (math 34% / reading 45%, grade F, #373 of 571 statewide, top 66%, 1,136 students, 71% FRL); Hollywood Hills High School (math 14% / reading 31%, grade F, #539 of 667 statewide, top 81%, 1,718 students, 68% FRL).
- Market conditions: Rents rising (+1.4%/yr); 187 active listings in the ZIP; 5 comparable units currently listed for rent nearby; rentals at typical pace (median 25d on market — plan ~3-4 weeks tenant-placement turnaround); 2,111 units permitted in Broward County in 2024 (1,265 in 5+ unit buildings).
- At $8,354/mo this rent would consume 152% of the median local household income ($66k/yr) (locally 2205% of renters already pay >50% of income on rent) — very limited rent-growth headroom before tenants either downsize or default.
Forward outlook
- Local home prices are declining (-3.0%/yr); year-one equity from $5k of loan paydown is wiped out by about $23k of value loss. Plan a longer hold.
- Broward County population projected at +34% by 2050 — long-run rental-demand tailwind backs the buy-and-hold thesis.
Negotiation context
- Only 0 days on market — expect competitive offers; lowballing is unlikely to land.
- 2 sale attempts with the ask held roughly flat each time — persistent listings suggest the price (not the market) is what's stuck; bring a comps-based counter.
Risks & watch-outs
- Climate carrying-cost: severe wind risk, 99% chance of damaging wind over 30y; extreme-heat days projected 7→27/yr by 2055 (HVAC capex compounding) — expect insurance premiums to compound above CPI over the hold.
Questions for the listing agent
- Can we see the unit-by-unit rent roll, current vacancy, and any below-market leases? What's the average tenancy length?
- What capital expenditures (roof, boiler, parking lot, exteriors) have been made in the last 5 years, and what's planned in the next 2?
- Built in 1972 — when were the roof, HVAC, electrical panel, plumbing, and water heater last replaced?
- Is there a deadline driving the sale (1031 exchange, divorce, estate, relocation)? That informs how much negotiation room exists.
- Schools are A-rated — typically a magnet for longer-tenancy family renters. What's the average tenant stay here, and is there a school-zone premium baked into asking?
- What's the average days-on-market for RENTAL listings here right now (not sales)? A rising rental-DOM trend means longer vacancies and softer asking-rent achievability than the comps imply.
- What's the recent tenant-quality profile in this submarket — average credit score on applications, eviction rate, late-payment / NSF rate, and stable-employment percentage? A property-management company in the area should have these aggregated.
- How much new apartment / multifamily construction is in the pipeline within 1–3 miles? Heavy new supply (>2% of stock underway) typically softens rents 12–24 months out; light construction supports rent growth.
Investment metrics
- 1% rule
- 1.09% ✓
- Cap rate
- 8.29%
- Cash-on-cash
- 7.12%
- DSCR
- 1.32
- GRM
- 7.7
CMA / ARV
- ARV (on-the-fly)
- $764,235
- Comps found
- 1
Show comp detail 1 sale within ~0.75 mi
| Address | Dist | Beds/Ba | Sqft | Sold | Price | $/sf | Match |
|---|---|---|---|---|---|---|---|
| 6551- 6553 SW 49th Ct | 0.15mi | 18/18.0 | 3,349 (+6%) | 14mo | $815,000 | $243 | 71 |
Match score weights: distance 35% · size 25% · config 20% · recency 20%. Top-matched comps best support the ARV.
Projected returns pro-forma
-3.0% appreciation · 1.45% rent growth · sell at horizon
- IRR
- -7.1%
- Equity multiple
- 0.74×
- Total profit
- $-55,998
- Equity at exit
- $114,795
- IRR
- 0.4%
- Equity multiple
- 1.03×
- Total profit
- $5,612
- Equity at exit
- $66,567
Cash invested: $215,572 (down + closing). Projections, not guarantees.
Landlord ↔ Tenant lean methodology
- Overall (STATE)
- 87 Strongly Landlord-Friendly
- State Florida
- 87 Strongly Landlord-Friendly · R+3
- County
- — inherits STATE
- City
- — inherits STATE
ZIP-level market 33314
- Rents YoY
- 1.4%
- Active inventory
- 187
- Price-to-rent
- 29.9×
Monthly cashflow live
- Estimated rent
- $8,354 high interval (Pro) →
- Mortgage (P&I)
- −$4,037
- Tax est. 1.5%
- −$962 /mo · $11,548/yr
- Insurance
- −$321
- HOA
- −$0
- Vacancy / Maint / Mgmt
- −$1,754
- Net cashflow
- $1,279
Break-even live
4-unit breakdown (identical units grouped — click to expand)
| Units | Beds | Baths | Est. rent |
|---|---|---|---|
| 2× units | 2 | 1 | $4,296 |
| #1 | 2 | 1 | $2,148 |
| #2 | 2 | 1 | $2,148 |
| 2× units | 1 | 1 | $4,058 |
| #3 | 1 | 1 | $2,029 |
| #4 | 1 | 1 | $2,029 |
| Total (4 units) | $8,354 | ||
UW: 25.0% down · 7.5% · 30yr · 1.5% tax · 5.0% vac · 8.0% maint · 8.0% mgmt
Financing live
Cash to close
- Down payment
- $192,475
- Closing costs
- $23,097
- Reserves months
- —
- Total cash needed
- —
Loan-product check · same deal, 3 products live
Conventional
25% down · 7.5% · 30yr
- Down + closing
- —
- Monthly P&I
- —
- Monthly cashflow
- —
- DSCR
- —
- Eligible?
- —
Personal DTI + credit; lowest rate.
DSCR
20% down · 8.5% · 30yr
- Down + closing
- —
- Monthly P&I
- —
- Monthly cashflow
- —
- DSCR
- —
- Eligible?
- —
No personal income docs; deal must DSCR.
Hard money
10% down · 12.0% · 12mo
- Down + closing
- —
- Monthly P&I
- —
- Monthly cashflow
- —
- DSCR
- —
- Eligible?
- —
Short-term bridge; refi at stabilization.
Rent comps 5 comps
| Address | Beds | Baths | Sqft | Rent | $/sqft | DOM | Units | Dist |
|---|---|---|---|---|---|---|---|---|
| 6560 SW 49th St Unit 1 Davie, FL | 3.0 | 2.0 | 2103 | $2,850 | $1.36 | 17d | 1 | 0.13mi |
| 6591 SW 46th St Unit 3 Davie, FL | 2.0 | 2.0 | 4116 | $2,200 | $0.53 | 24d | 1 | 0.16mi |
| 6121 SW 48th Ct #1 Davie, FL | 3.0 | 2.0 | 3320 | $2,950 | $0.89 | 24d | 1 | 0.27mi |
| 5095 SW 73rd Ave Davie, FL | 3.0 | 2.0 | 2212 | $7,950 | $3.59 | 24d | 1 | 0.75mi |
| 5167 Madison Lakes Cir E Davie, FL | 3.0 | 3.5 | 2452 | $3,750 | $1.53 | 24d | 1 | 1.37mi |
Listing history 4 events
-
2026-02-13historical
-
2025-10-22$769,900
-
2025-10-18historical $1,800
-
2025-09-20$1,800
ⓘ Source: listings_history table (triggers on properties + properties_extension) + one-shot
backfill from property_details.listing_events for pre-trigger history.
Climate risk First Street
- Flood 1/10 Low FEMA zone X (shaded) · 0% chance over 30 yrs
- Wildfire 1/10 Low
- Heat 10/10 Extreme 7 d/yr ≥105°F today · 27 d/yr by 30 yrs out
- Wind 10/10 Extreme 99% chance of damaging wind over 30 yrs
- Air quality 2/10 Low 2 unhealthy d/yr today · 2 by 30 yrs out
Nearby sold comps map
Loading sold comps map…
Walkable amenities ~0.75 mi
Loading nearby amenities…
Taxation est. · year 1
- Rental income
- $100,248
- − Mortgage interest
- −$43,126
- − Property taxes
- −$11,548
- − Insurance
- −$3,850
- − Repairs & maintenance
- −$8,020
- − Management
- −$8,020
- − Depreciation
- −$22,397
- Taxable income
- $3,287
- Est. tax owed @ 24.0%
- −$789
- After-tax cash flow
- $14,560/yr
For passive investors: Depreciation is non-cash, so a rental often shows a tax loss while cash-flowing — sheltering income. Rental losses are passive: they offset passive income freely, and up to $25,000/yr can offset ordinary (W-2) income if you actively participate and your MAGI is under $100k (phasing out to $0 by $150k); unused losses carry forward. On sale, claimed depreciation is recaptured at up to 25%, and gains may owe capital-gains tax (a 1031 exchange can defer both). Figures are a year-1 estimate at your 24.0% rate — not tax advice; consult a CPA.
Schools (NCES district)
- District
- Broward
- NCES district ID
- 1200180
- Math proficiency
- 42% ▼ -18.00%
- Reading proficiency
- 53% ▼ -5.00%
- Median HH income
- $52,139
- Composite
- 40.88/100
- National rank
- #3621
- State rank
- #46 of 73 in FL
Livability — Davie
- Score
- 82/100
- State rank
- #68
- US rank
- #1159
Category grades
Schools grade is shown separately in the Schools card above.
Census & demographics
- Census place
- Davie, FL
- County
- Broward County · 1,963,430 people
- City population
- 92,317
- Metro
- Miami-Fort Lauderdale-Pompano Beach, FL
- Population (ZIP)
- 31,067
- Household income
- $66,100
- Rent vs Own
- Severe rent burden
- 2205.0
Population outlook (Broward County) Hauer SSP2
- Today (2025)
- 2,207,033 people
- By 2030
- 2,360,704 · +7.0%
- By 2040
- 2,661,208 · +20.6%
- By 2050
- 2,946,698 · +33.5%
- By 2075
- 3,602,273 · +63.2%
- By 2100
- 3,970,984 · +79.9%
Race, ethnicity, and origin ACS 2023
- Neighborhood character
- Diverse neighborhood (Simpson 0.66)
- Race & ethnicity
- Hispanic / Latino 49% Two or more races 30% White 29% Black 13% Asian 6%
- Hispanic origin (detail)
- Mexican 6% Puerto Rican 7% Cuban 7% Dominican 3%
- Common ancestry
- Hispanic 4% Romanian 1% Estonian 1%
- Foreign-born
- 38% · Canada, Jamaica, Vietnam
- Languages at home
- 45% English-only · Spanish 42% French/Haitian/Cajun 4% Other Indo-European 3%
Political lean MEDSL · Broward
- 2024 margin
- D (+17.0) · D 58.0% · R 41.0%
- 2008→2024 swing
- -17.8pp toward R · 2008: 34.7pp · 2024: 17.0pp
- All cycles
- 2024: D+17.0 2020: D+29.8 2016: D+35.0 2012: D+34.9 2008: D+34.7
Not yet ingested
- Civics
- —
Market trends
- HPI YoY
- ▼ -346.31%
- Current HPI
- 433.1148
- Rent YoY
- ▲ 1.45%
- Metro
- Miami-Fort Lauderdale-Pompano Beach, FL
- State GDP YoY
- ▲ 3.28%
- F500 in state
- 36
Industry mix (Fortune 500 HQ in FL)
| Industry | F500 HQs | Revenue |
|---|---|---|
| Industrial Technology | 2 | $29B |
|
||
| Insurance | 2 | $17B |
|
||
| Retail | 1 | $60B |
|
||
| Technology Distribution | 1 | $58B |
|
||
| Homebuilding | 1 | $35B |
|
||
| Technology Manufacturing | 1 | $35B |
|
||
Price history
+42672.2% since first listed4 events — show timeline
- 2026-02-13 Listing Removed — Beaches MLS
- 2025-10-22 Listed $769,900 Beaches MLS
- 2025-10-18 Rental Removed $1,800 GFLMLS
- 2025-09-20 Listed for Rent $1,800 GFLMLS
Cash-flow waterfall
monthlySold comps — $/sqft
last 12 mo · ≤1 miLoading sold comps…