 🏗️ New Construction
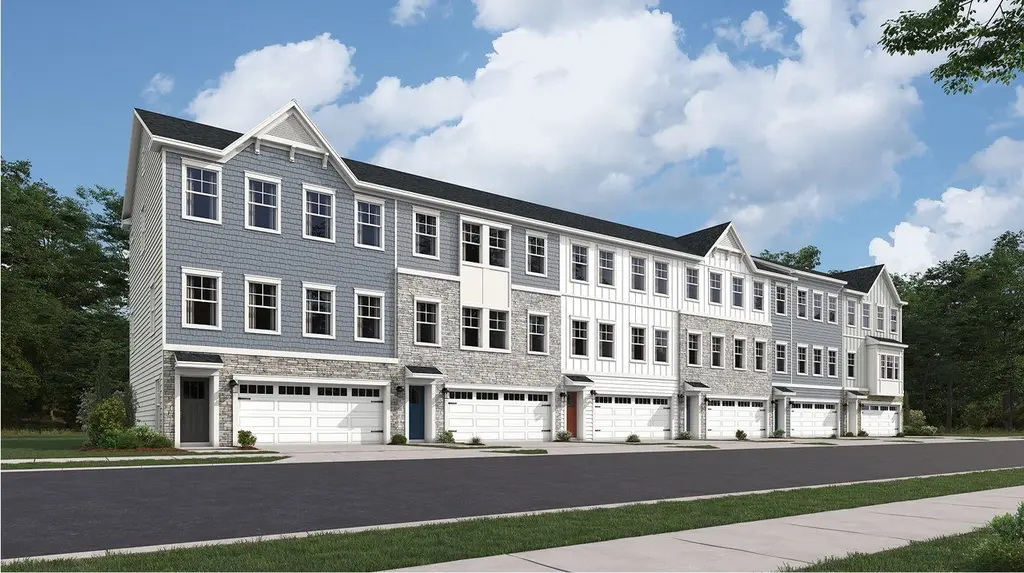
Amelia Front Load Garage Plan · Cambridge, MD
Flood risk 1/10 · Minimal
- FEMA flood zone
- X (unshaded)
- Chance of flooding over 30 yrs
- 0.0%
- Est. flood insurance / yr
- $507 – $1,088
Fire risk 2/10 · Minimal
- Est. fire insurance / yr
- $755 – $1,403
Heat risk 9/10 · Severe
- Hot days now (above 104°F)
- 7 days/yr
- Hot days in 30 yrs
- 16 days/yr
Wind risk 6/10 · Moderate
- Chance of severe wind over 30 yrs
- 70.0%
Air-quality risk 3/10 · Minor
- Unhealthy air days now
- 2 days/yr
- Unhealthy air days in 30 yrs
- 3 days/yr
Risk factors via First Street. Map © Google.
Why this score? — see what drove the F grade
The composite is a weighted blend of 9 inputs, each scored 0–100. Each bar is that input's sub-score; the figure is the points it added to the 100-point composite (weight × sub-score).
- ARV discount +7.5/15.0
- Cash flow +5.9/30.0
- Condition / age +5.0/5.0
- Livability +3.2/5.0
- Rent growth +2.5/5.0
- Schools +1.5/10.0
- 1% rule +1.3/10.0
- DSCR +0.3/10.0
- Appreciation +0.0/10.0
$299,990
🖨 Deal sheet (PDF) 📄 Offer letter ✓ Due diligence
Listing remarks MLS
A new three-story townhome features a versatile recreation room and two-car garage upon entry. The second floor hosts a modern open-concept layout situated among the Great Room, dining area and kitchen, along with a flex space ideal for at-home work. At the top level are all three bedrooms to provide peaceful retreats, including the owner's suite with a private bathroom.
Key facts
- Multi-use trails
- Private marina
- Lush wetlands
Tags
Neighborhood map
What this means for you Summary
Snapshot
- This is a 3-bed/2.5-bath townhouse listed at $300k. Condition is rated excellent.
Deal economics
- At list price, monthly cash flow is $-774 ($-9k/yr) — negative.
- To cash-flow at today's rent, offer at most $288k (3.9% below list).
- To meet the 1% rule (rent ≥ 1% of price), the offer needs to be $252k (15.9% below list).
- Recommended offer: $252k (15.9% below list) — sets the bar for 1% rule.
Location & tenants
- Location reads 65/100 on livability (#255 in MD) — a middle-class / working-renter tenant base. Strengths: cost of living A+, health & safety A+, housing B+; Watch: amenities D, crime F, employment F.
- Dorchester County Public Schools (rural): math 10% / reading 23% proficiency, ranked #23 of 24 in MD (top 96%) — low school quality limits family demand, transient renter base, plan for 1-2y turnover.
- Zoned schools: Maple Elementary School (math 5% / reading 8%, grade F, #740 of 860 statewide, top 87%, 392 students, 100% FRL); Mace'S Lane Middle School (math 2% / reading 16%, grade F, #212 of 225 statewide, top 95%, 481 students, 100% FRL); Cambridge-South Dorchester High School (math 22% / reading 42%, grade F, #151 of 222 statewide, top 68%, 784 students, 100% FRL) — zoned schools average 100% FRL vs 58% district-wide (42 pts higher); higher-poverty schools than district average — tighter screening recommended.
- Market conditions: 292 active listings in the ZIP; 10 comparable units currently listed for rent nearby; rentals lingering (median 47d on market — plan ~5-8 weeks vacancy on turnover, expect pricing pressure); 100% of comp listings sitting > 30 days — soft ceiling on asking rent; 81 units permitted in Dorchester County in 2024 (0 in 5+ unit buildings).
Forward outlook
- Local home prices are declining (-3.0%/yr); year-one equity from $3k of loan paydown is wiped out by about $12k of value loss. Plan a longer hold.
- Dorchester County population projected to shrink 10% by 2050 — rents likely to lag national; underwrite the cash flow, not the appreciation.
Negotiation context
- It's been on market 500 days — a 12% lower offer ($264k) is reasonable based on typical stale-listing flexibility.
Risks & watch-outs
- Climate carrying-cost: major wind risk, 70% chance of damaging wind over 30y; extreme-heat days projected 7→16/yr by 2055 (HVAC capex compounding) — expect insurance premiums to compound above CPI over the hold.
Questions for the listing agent
- What do current leases actually rent for vs. the listed asking? Can we see a recent rent roll and the last 12 months of T-12 income?
- It's been on market 500 days. Have you received any prior offers? Is the seller open to a 16% concession, seller financing, or rate buy-down credit?
- Why hasn't it sold? Are there any deal-killer items the seller is aware of (foundation, flood, title, zoning, code violations)?
- Is there a deadline driving the sale (1031 exchange, divorce, estate, relocation)? That informs how much negotiation room exists.
- Schools are F-rated, which usually means shorter tenancies and higher turnover. Who's the typical renter profile here, and what's been the actual vacancy rate?
- Crime grade is F in this area — have there been break-ins, vandalism, or insurance claims at this property in the last 3 years? What carrier currently insures it and at what premium?
- The area grade is low — what's the realistic commute time and amenity access for the typical tenant pool here? Any planned neighborhood developments (good or bad) we should know about?
- What's the average days-on-market for RENTAL listings here right now (not sales)? A rising rental-DOM trend means longer vacancies and softer asking-rent achievability than the comps imply.
- What's the recent tenant-quality profile in this submarket — average credit score on applications, eviction rate, late-payment / NSF rate, and stable-employment percentage? A property-management company in the area should have these aggregated.
- How much new for-sale + rental construction is in the pipeline within 1–3 miles? Heavy new supply typically softens prices + rents 12–24 months out; constrained supply supports both.
Investment metrics
- 1% rule
- 0.63% ✗
- Cap rate
- 3.97%
- Cash-on-cash
- -8.29%
- DSCR
- 0.63
- GRM
- 13.2
CMA / ARV
- ARV (median comp)
- $400,407
- List price
- $299,990
- Delta
- -25.08%
- Verdict
- UNDERPRICED
- Comps
- 20 within 1.0 mi
Show comp detail 3 sales within ~0.75 mi
| Address | Dist | Beds/Ba | Sqft | Sold | Price | $/sf | Match |
|---|---|---|---|---|---|---|---|
| 2700 Willow Oak Dr Unit 111B | 0.28mi | 2/2.0 (-1) | 1,720 (-6%) | 5mo | $226,000 | $131 | 65 |
| 2700 Willow Oak Dr Unit 409E | 0.28mi | 2/2.0 (-1) | 1,643 (-11%) | 1mo | $435,000 | $265 | 61 |
| 2700 Willow Oak Dr Unit 304E | 0.28mi | 2/2.0 (-1) | 1,629 (-12%) | 5mo | $407,500 | $250 | 57 |
Match score weights: distance 35% · size 25% · config 20% · recency 20%. Top-matched comps best support the ARV.
Projected returns pro-forma
-3.0% appreciation · 3.0% rent growth · sell at horizon
- IRR
- -30.9%
- Equity multiple
- -0.02×
- Total profit
- $-114,170
- Equity at exit
- $59,702
- IRR
- -33.6%
- Equity multiple
- -0.45×
- Total profit
- $-162,776
- Equity at exit
- $34,620
Cash invested: $112,114 (down + closing). Projections, not guarantees.
Landlord ↔ Tenant lean methodology
- Overall (STATE)
- 27 Tenant-Leaning
- State Maryland
- 27 Tenant-Leaning · D+14
- County
- — inherits STATE
- City
- — inherits STATE
ZIP-level market 21613
- Home prices YoY
- -25.1%
- Active inventory
- 292
- Price-to-rent
- 9.9×
Monthly cashflow live
- Estimated rent
- $2,522 high interval (Pro) →
- Mortgage (P&I)
- −$2,100
- Tax est. 1.5%
- −$501 /mo · $6,006/yr
- Insurance
- −$167
- HOA
- −$0
- Lot rent
- −$0
- Vacancy / Maint / Mgmt
- −$530
- Net cashflow
- $-774
Break-even live
Sensitivity live
| Price | -10% $-498 | -5% $-636 | +0% $-774 | +5% $-913 | +10% $-1,051 |
|---|---|---|---|---|---|
| Rent | -10% $-974 | -5% $-874 | +0% $-774 | +5% $-675 | +10% $-575 |
| Rate | -1.0pp $-573 | -0.5pp $-673 | base $-774 | +0.5pp $-878 | +1.0pp $-984 |
UW: 25.0% down · 7.5% · 30yr · 1.5% tax · 5.0% vac · 8.0% maint · 8.0% mgmt
Financing live
Cash to close
- Down payment
- $100,102
- Closing costs
- $12,012
- Reserves months
- —
- Total cash needed
- —
Loan-product check · same deal, 3 products live
Conventional
25% down · 7.5% · 30yr
- Down + closing
- —
- Monthly P&I
- —
- Monthly cashflow
- —
- DSCR
- —
- Eligible?
- —
Personal DTI + credit; lowest rate.
DSCR
20% down · 8.5% · 30yr
- Down + closing
- —
- Monthly P&I
- —
- Monthly cashflow
- —
- DSCR
- —
- Eligible?
- —
No personal income docs; deal must DSCR.
Hard money
10% down · 12.0% · 12mo
- Down + closing
- —
- Monthly P&I
- —
- Monthly cashflow
- —
- DSCR
- —
- Eligible?
- —
Short-term bridge; refi at stabilization.
Rent comps 10 comps
| Address | Beds | Baths | Sqft | Rent | $/sqft | DOM | Units | Dist |
|---|---|---|---|---|---|---|---|---|
| 2102 Winterberry Ln Cambridge, MD | 3.0 | 2.5 | 1909 | $2,800 | $1.47 | 46d | 1 | 0.30mi |
| 2104 Winterberry Ln Cambridge, MD | 3.0 | 2.5 | 1909 | $2,500 | $1.31 | 46d | 1 | 0.30mi |
| 2108 Winterberry Ln Cambridge, MD | 3.0 | 2.5 | 1909 | $2,500 | $1.31 | 46d | 1 | 0.31mi |
| 2914 Winterberry Ln Cambridge, MD | 4.0 | 3.5 | 2148 | $2,600 | $1.21 | 46d | 1 | 0.39mi |
| 2208 Winterberry Ln Unit I Cambridge, MD | 3.0 | 2.5 | 1919 | $2,450 | $1.28 | 46d | 1 | 0.54mi |
| 2214 Winterberry Ln Unit I Cambridge, MD | 3.0 | 2.5 | 1945 | $2,450 | $1.26 | 46d | 1 | 0.55mi |
| 401 N Seaway Ct Cambridge, MD | 3.0 | 2.5 | 1867 | $2,600 | $1.39 | 46d | 1 | 1.17mi |
| 414 Waterfield Ct Cambridge, MD | 3.0 | 2.5 | 2000 | $2,395 | $1.20 | 46d | 1 | 1.24mi |
| 318 E Appleby Ave Cambridge, MD | 3.0 | 2.5 | 1536 | $2,100 | $1.37 | 46d | 1 | 1.29mi |
| 406 Robbins St Cambridge, MD | 3.0 | 2.0 | 1296 | $1,800 | $1.39 | 46d | 1 | 1.37mi |
Listing history 19 events
-
2026-06-22days on market $299,990 Active 500 DOM
-
2026-06-21days on market $299,990 Active 499 DOM
-
2026-06-21days on market $299,990 Active 498 DOM
-
2026-06-18days on market $299,990 Active 496 DOM
-
2026-06-17days on market $299,990 Active 495 DOM
-
2026-06-16days on market $299,990 Active 494 DOM
-
2026-06-15days on market $299,990 Active 493 DOM
-
2026-06-13days on market $299,990 Active 491 DOM
-
2026-06-12days on market $299,990 Active 490 DOM
-
2026-06-09days on market $299,990 Active 487 DOM
-
2026-06-08days on market $299,990 Active 486 DOM
-
2026-06-07days on market $299,990 Active 485 DOM
-
2026-06-07days on market $299,990 Active 484 DOM
-
2026-06-04days on market $299,990 Active 481 DOM
-
2026-06-02days on market $299,990 Active 480 DOM
-
2026-06-01days on market $299,990 Active 479 DOM
-
2026-05-31days on market $299,990 Active 478 DOM
-
2026-05-31days on market $299,990 Active 477 DOM
-
2025-02-08$299,990 Active 373-char remark
Show marketing remark (373 chars)
A new three-story townhome features a versatile recreation room and two-car garage upon entry. The second floor hosts a modern open-concept layout situated among the Great Room, dining area and kitchen, along with a flex space ideal for at-home work. At the top level are all three bedrooms to provide peaceful retreats, including the owner's suite with a private bathroom.
ⓘ Source: listings_history table (triggers on properties + properties_extension) + one-shot
backfill from property_details.listing_events for pre-trigger history.
Climate risk First Street
- Flood 1/10 Low FEMA zone X (unshaded) · 0% chance over 30 yrs
- Wildfire 2/10 Low
- Heat 9/10 Extreme 7 d/yr ≥104°F today · 16 d/yr by 30 yrs out
- Wind 6/10 Major 70% chance of damaging wind over 30 yrs
- Air quality 3/10 Moderate 2 unhealthy d/yr today · 3 by 30 yrs out
Nearby sold comps map
Loading sold comps map…
Walkable amenities ~0.75 mi
Loading nearby amenities…
Taxation est. · year 1
- Rental income
- $30,269
- − Mortgage interest
- −$22,429
- − Property taxes
- −$6,006
- − Insurance
- −$2,002
- − Repairs & maintenance
- −$2,421
- − Management
- −$2,421
- − Depreciation
- −$11,648
- Taxable loss
- −$16,660
- Est. tax savings @ 24.0%
- +$3,998
- After-tax cash flow
- $-5,295/yr
For passive investors: Depreciation is non-cash, so a rental often shows a tax loss while cash-flowing — sheltering income. Rental losses are passive: they offset passive income freely, and up to $25,000/yr can offset ordinary (W-2) income if you actively participate and your MAGI is under $100k (phasing out to $0 by $150k); unused losses carry forward. On sale, claimed depreciation is recaptured at up to 25%, and gains may owe capital-gains tax (a 1031 exchange can defer both). Figures are a year-1 estimate at your 24.0% rate — not tax advice; consult a CPA.
Condition & rehab AI · 12 photos
This modern townhouse is in excellent condition with no visible repairs needed. It offers a great layout and is move-in ready.
Value-add opportunities
- Both Paint exterior trim — Enhances curb appeal and resale value
- Both Install smart home devices — Improves convenience and marketability
- Both Add outdoor lighting — Enhances safety and curb appeal
Renovation cost estimate screening
Value-add ROI direction
- Both Paint exterior trim — Enhances curb appeal and resale value ↑
- Both Install smart home devices — Improves convenience and marketability ↑
- Both Add outdoor lighting — Enhances safety and curb appeal ↑
ⓘ Cost ranges are severity-bucket heuristics (US national rule-of-thumb). Get contractor quotes + a written scope before underwriting a rehab budget.
Schools (NCES district)
- District
- Dorchester County Public Schools
- NCES district ID
- 2400300
- Math proficiency
- 10% ▼ -14.00%
- Reading proficiency
- 23% ▼ -12.00%
- Median HH income
- $46,767
- Composite
- 14.65/100
- National rank
- #9404
- State rank
- #23 of 24 in MD
Livability — Cambridge
- Score
- 65/100
- State rank
- #255
- US rank
- #13046
Category grades
Schools grade is shown separately in the Schools card above.
Census & demographics
- Census place
- Cambridge, MD
- Population (ZIP)
- 18,167
Population outlook (Dorchester County) Hauer SSP2
- Today (2025)
- 31,699 people
- By 2030
- 31,054 · -2.0%
- By 2040
- 29,712 · -6.3%
- By 2050
- 28,618 · -9.7%
- By 2075
- 28,436 · -10.3%
- By 2100
- 28,937 · -8.7%
Race, ethnicity, and origin ACS 2023
- Neighborhood character
- Diverse neighborhood (Simpson 0.62)
- Race & ethnicity
- White 52% Black 33% Two or more races 10% Hispanic / Latino 6% Asian 2%
- Hispanic origin (detail)
- Puerto Rican 3%
- Common ancestry
- Romanian 1% Lithuanian 1% Italian 1%
- Foreign-born
- 4% · Canada
- Languages at home
- 95% English-only · Spanish 3% Other Indo-European 1% German/W. Germanic 1%
Political lean MEDSL · Dorchester
- 2024 margin
- R (+14.6) · D 41.6% · R 56.1% · Other 2.3%
- 2008→2024 swing
- -6.3pp toward R · 2008: -8.2pp · 2024: -14.6pp
- All cycles
- 2024: R+14.6 2020: R+11.9 2016: R+16.0 2012: R+6.6 2008: R+8.2
Not yet ingested
- Civics
- —
Market trends
- HPI YoY
- ▼ -91.03%
- Current HPI
- 271.1127
- Rent YoY
- —
- Metro
- —
- State GDP YoY
- ▲ 2.97%
- F500 in state
- 12
Industry mix (Fortune 500 HQ in MD)
| Industry | F500 HQs | Revenue |
|---|---|---|
| Aerospace / Defense | 1 | $71B |
|
||
| Utilities | 1 | $25B |
|
||
| Hotels | 1 | $24B |
|
||
| Consumer Goods | 1 | $7B |
|
||
| Real Estate | 1 | $6B |
|
||
| Chemicals | 1 | $2B |
|
||
Price history
1 event — show timeline
- 2025-02-08 Listed $299,990 Zillow
Cash-flow waterfall
monthlySold comps — $/sqft
last 12 mo · ≤1 miLoading sold comps…