 12-Plex
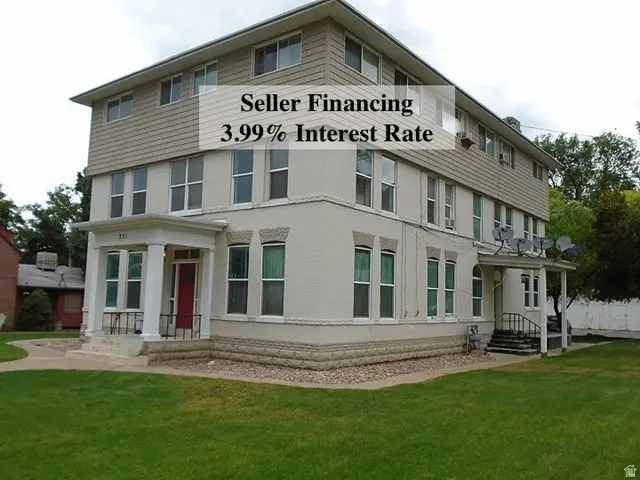
251 E 300 S · Springville, UT
Flood risk 4/10 · Minor
- FEMA flood zone
- X (unshaded)
- Chance of flooding over 30 yrs
- 0.21%
- Est. flood insurance / yr
- $473 – $860
Fire risk 6/10 · Moderate
- Est. fire insurance / yr
- $453 – $841
Heat risk 4/10 · Minor
- Hot days now (above 95°F)
- 7 days/yr
- Hot days in 30 yrs
- 21 days/yr
Wind risk 1/10 · Minimal
- Chance of severe wind over 30 yrs
- —
Air-quality risk 6/10 · Moderate
- Unhealthy air days now
- 10 days/yr
- Unhealthy air days in 30 yrs
- 10 days/yr
Risk factors via First Street. Map © Google.
Why this score? — see what drove the D- grade
The composite is a weighted blend of 9 inputs, each scored 0–100. Each bar is that input's sub-score; the figure is the points it added to the 100-point composite (weight × sub-score).
- Cash flow +12.5/30.0
- ARV discount +7.5/15.0
- Livability +4.2/5.0
- DSCR +3.7/10.0
- Schools +3.5/10.0
- Rent growth +3.1/5.0
- Condition / age +2.5/5.0
- 1% rule +2.4/10.0
- Appreciation +0.0/10.0
$2,100,000
🖨 Deal sheet 📄 Offer letter ✓ Due diligence
Multi-family units
County records classify this as Multi-Family (5+ Unit). Listing-text estimate: 12 units. confirmed
5+ unit building — per-unit beds/baths from public records are typically unavailable; the breakdown below (if shown) is an estimate from the listing text.
Listing remarks MLS
There are no remarks available.
Key facts
- 1 studio apartment
- Core location
- 11 one bedroom units
Tags
Property features AI
Finance
- Other:
- Financial info: 12 total units; Sample current rents for individual 1-bedroom units: $1,125; $1,075; $1,025; $1,100; $975; $1,150; $1,025; $825; $1,125; $1,085
- HOA & community:
Exterior
- Parking:
- Security:
- Utilities:
- Home design: 3-story building
- Construction: Building is built and standing
- Exterior features: 0.6-acre lot
Interior
- Kitchen:
- Bedrooms: Multiple 1-bedroom units (building contains 12 units; individual units listed below)
- Flooring:
- Bathrooms: Each listed unit has 1 bathroom
- Heating & cooling:
- Interior features: Residential use; Built and standing condition
- Laundry & utility:
Neighborhood map
What this means for you Summary
Snapshot
- This is a 12 × 1-bed/?-bath units multifamily listed at $2.10M.
Deal economics
- At list price, monthly cash flow is $-312 ($-4k/yr) — negative. Per door: $-26/mo.
- To cash-flow at today's rent, offer at most $2.04M (2.6% below list).
- To meet the 1% rule (rent ≥ 1% of price), the offer needs to be $1.55M (26.2% below list).
- Recommended offer: $1.55M (26.2% below list) — sets the bar for 1% rule.
Location & tenants
- Location reads 85/100 on livability (#12 in UT, #476 nationally) — a professional / high-income tenant draw. Strengths: commute A+, employment A+, housing A+.
- Nebo District (suburban): math 38% / reading 40% proficiency, ranked #45 of 80 in UT (top 56%) — families likely to look elsewhere, expect single-tenant / working-renter base with shorter leases.
- Market conditions: Rents rising (+2.3%/yr); 199 active listings in the ZIP; solid renter incomes; 6,326 units permitted in Utah County in 2024 (1,053 in 5+ unit buildings).
- At $15,490/mo this rent would consume 206% of the median local household income ($90k/yr) (locally 617% of renters already pay >50% of income on rent) — very limited rent-growth headroom before tenants either downsize or default.
Forward outlook
- Local home prices are declining (-3.0%/yr); year-one equity from $15k of loan paydown is wiped out by about $63k of value loss. Plan a longer hold.
- Utah County population projected at +49% by 2050 — long-run rental-demand tailwind backs the buy-and-hold thesis.
Negotiation context
- It's been on market 62 days — a 6% lower offer ($1.97M) is reasonable based on typical stale-listing flexibility.
- 6 sale attempts since 30y ago with the ask held roughly flat each time — persistent listings suggest the price (not the market) is what's stuck; bring a comps-based counter.
Risks & watch-outs
- Watch-outs: built in 1914 — expect roof / HVAC / electrical / plumbing capex.
- Climate carrying-cost: major wildfire risk — expect insurance premiums to compound above CPI over the hold.
Questions for the listing agent
- What do current leases actually rent for vs. the listed asking? Can we see a recent rent roll and the last 12 months of T-12 income?
- It's been on market 62 days. Have you received any prior offers? Is the seller open to a 26% concession, seller financing, or rate buy-down credit?
- Can we see the unit-by-unit rent roll, current vacancy, and any below-market leases? What's the average tenancy length?
- What capital expenditures (roof, boiler, parking lot, exteriors) have been made in the last 5 years, and what's planned in the next 2?
- Built in 1914 — when were the roof, HVAC, electrical panel, plumbing, and water heater last replaced?
- Why hasn't it sold? Are there any deal-killer items the seller is aware of (foundation, flood, title, zoning, code violations)?
- Is there a deadline driving the sale (1031 exchange, divorce, estate, relocation)? That informs how much negotiation room exists.
- Schools are B-rated — typically a magnet for longer-tenancy family renters. What's the average tenant stay here, and is there a school-zone premium baked into asking?
- The area grade is low — what's the realistic commute time and amenity access for the typical tenant pool here? Any planned neighborhood developments (good or bad) we should know about?
- What's the average days-on-market for RENTAL listings here right now (not sales)? A rising rental-DOM trend means longer vacancies and softer asking-rent achievability than the comps imply.
- What's the recent tenant-quality profile in this submarket — average credit score on applications, eviction rate, late-payment / NSF rate, and stable-employment percentage? A property-management company in the area should have these aggregated.
- How much new apartment / multifamily construction is in the pipeline within 1–3 miles? Heavy new supply (>2% of stock underway) typically softens rents 12–24 months out; light construction supports rent growth.
Investment metrics
- 1% rule
- 0.74% ✗
- Cap rate
- 6.11%
- Cash-on-cash
- -0.64%
- DSCR
- 0.97
- GRM
- 11.3
CMA / ARV
No comps found within radius.
Projected returns pro-forma
-3.0% appreciation · 2.26% rent growth · sell at horizon
- IRR
- -18.1%
- Equity multiple
- 0.37×
- Total profit
- $-372,553
- Equity at exit
- $313,117
- IRR
- -11.8%
- Equity multiple
- 0.32×
- Total profit
- $-400,198
- Equity at exit
- $181,570
Cash invested: $588,000 (down + closing). Projections, not guarantees.
Landlord ↔ Tenant lean methodology
- Overall (STATE)
- 86 Strongly Landlord-Friendly
- State Utah
- 86 Strongly Landlord-Friendly · R+15
- County
- — inherits STATE
- City
- — inherits STATE
ZIP-level market 84663
- Rents YoY
- 2.3%
- Active inventory
- 199
- Price-to-rent
- 135.6×
Monthly cashflow live
- Estimated rent
- $15,490 medium interval (Pro) →
- Mortgage (P&I)
- −$11,013
- Tax from tax record
- −$661 /mo · $7,932/yr
- Insurance
- −$875
- HOA
- −$0
- Vacancy / Maint / Mgmt
- −$3,253
- Net cashflow
- $-312
Break-even live
12-unit breakdown (identical units grouped — click to expand)
| Units | Beds | Baths | Est. rent |
|---|---|---|---|
| 12× units | 1 | — | $15,492 |
| #1 | 1 | — | $1,291 |
| #2 | 1 | — | $1,291 |
| #3 | 1 | — | $1,291 |
| #4 | 1 | — | $1,291 |
| #5 | 1 | — | $1,291 |
| #6 | 1 | — | $1,291 |
| #7 | 1 | — | $1,291 |
| #8 | 1 | — | $1,291 |
| #9 | 1 | — | $1,291 |
| #10 | 1 | — | $1,291 |
| #11 | 1 | — | $1,291 |
| #12 | 1 | — | $1,291 |
| Total (12 units) | $15,490 | ||
UW: 25.0% down · 7.5% · 30yr · 1.5% tax · 5.0% vac · 8.0% maint · 8.0% mgmt
Financing live
Cash to close
- Down payment
- $525,000
- Closing costs
- $63,000
- Reserves months
- —
- Total cash needed
- —
Loan-product check · same deal, 3 products live
Conventional
25% down · 7.5% · 30yr
- Down + closing
- —
- Monthly P&I
- —
- Monthly cashflow
- —
- DSCR
- —
- Eligible?
- —
Personal DTI + credit; lowest rate.
DSCR
20% down · 8.5% · 30yr
- Down + closing
- —
- Monthly P&I
- —
- Monthly cashflow
- —
- DSCR
- —
- Eligible?
- —
No personal income docs; deal must DSCR.
Hard money
10% down · 12.0% · 12mo
- Down + closing
- —
- Monthly P&I
- —
- Monthly cashflow
- —
- DSCR
- —
- Eligible?
- —
Short-term bridge; refi at stabilization.
Listing history 31 events
-
2026-06-18days on market $2,100,000 Active 62 DOM
-
2026-06-17days on market $2,100,000 Active 61 DOM
-
2026-06-16days on market $2,100,000 Active 60 DOM
-
2026-06-15days on market $2,100,000 Active 59 DOM
-
2026-06-14days on market $2,100,000 Active 57 DOM
-
2026-06-10days on market $2,100,000 Active 54 DOM
-
2026-06-09days on market $2,100,000 Active 53 DOM
-
2026-06-08days on market $2,100,000 Active 52 DOM
-
2026-06-07days on market $2,100,000 Active 51 DOM
-
2026-06-03days on market $2,100,000 Active 47 DOM
-
2026-06-02days on market $2,100,000 Active 46 DOM
-
2026-06-01days on market $2,100,000 Active 45 DOM
-
2026-05-31days on market $2,100,000 Active 44 DOM
-
2026-05-31days on market $2,100,000 Active 43 DOM
-
2026-04-17$2,100,000 Active
-
2021-03-30soldstatus
-
2020-09-03historical
-
2020-08-10status Active
-
2020-07-28status Under Contract
-
2020-06-05price $1,250,000
-
2020-05-26$1,275,000 Active
-
2019-08-06soldstatus Sold 31-char remark
Show marketing remark (31 chars)
There are no remarks available.
-
2019-08-06soldstatus
Show marketing remark (31 chars)
There are no remarks available.
-
2019-05-28status Under Contract 31-char remark
Show marketing remark (31 chars)
There are no remarks available.
-
2019-05-02$1,030,000 Active 31-char remark
Show marketing remark (31 chars)
There are no remarks available.
-
2018-12-18historical
-
2018-10-08$1,150,000 Active
-
2014-02-27soldstatus
-
1996-10-25soldstatus
-
1996-04-29soldstatus
-
1996-04-08$245,000
ⓘ Source: listings_history table (triggers on properties + properties_extension) + one-shot
backfill from property_details.listing_events for pre-trigger history.
Tax reassessment forecast UT · Resets to sale price
- Current annual tax
- $7,932 · $661/mo
- Projected year-2 tax
- $13,860 · $1,155/mo
- Expected delta
- +$5,928/yr (+$494/mo · 74.7%)
ⓘ Screening estimate from a state-policy table — verify with the county assessor before closing.
Climate risk First Street
- Flood 4/10 Moderate FEMA zone X (unshaded) · 21% chance over 30 yrs
- Wildfire 6/10 Major
- Heat 4/10 Moderate 7 d/yr ≥95°F today · 21 d/yr by 30 yrs out
- Wind 1/10 Low
- Air quality 6/10 Major 10 unhealthy d/yr today · 10 by 30 yrs out
Nearby sold comps map
Loading sold comps map…
Walkable amenities ~0.75 mi
Loading nearby amenities…
Taxation est. · year 1
- Rental income
- $185,880
- − Mortgage interest
- −$117,633
- − Property taxes
- −$7,932
- − Insurance
- −$10,500
- − Repairs & maintenance
- −$14,870
- − Management
- −$14,870
- − Depreciation
- −$61,091
- Taxable loss
- −$41,016
- Est. tax savings @ 24.0%
- +$9,844
- After-tax cash flow
- $6,106/yr
For passive investors: Depreciation is non-cash, so a rental often shows a tax loss while cash-flowing — sheltering income. Rental losses are passive: they offset passive income freely, and up to $25,000/yr can offset ordinary (W-2) income if you actively participate and your MAGI is under $100k (phasing out to $0 by $150k); unused losses carry forward. On sale, claimed depreciation is recaptured at up to 25%, and gains may owe capital-gains tax (a 1031 exchange can defer both). Figures are a year-1 estimate at your 24.0% rate — not tax advice; consult a CPA.
Schools (NCES district)
- District
- Nebo District
- NCES district ID
- 4900630
- Math proficiency
- 38% ▼ -5.00%
- Reading proficiency
- 40% ▼ -4.00%
- Median HH income
- $64,067
- Composite
- 35.01/100
- National rank
- #5047
- State rank
- #45 of 80 in UT
Livability — Springville
- Score
- 85/100
- State rank
- #12
- US rank
- #476
Category grades
Schools grade is shown separately in the Schools card above.
Census & demographics
- Census place
- Springville, UT
- County
- Utah County · 661,754 people
- City population
- 36,207
- Metro
- Provo-Orem, UT
- Population (ZIP)
- 36,207
- Household income
- $90,252
- Rent vs Own
- Severe rent burden
- 617.0
Population outlook (Utah County) Hauer SSP2
- Today (2025)
- 693,420 people
- By 2030
- 757,324 · +9.2%
- By 2040
- 893,178 · +28.8%
- By 2050
- 1,035,842 · +49.4%
- By 2075
- 1,376,733 · +98.5%
- By 2100
- 1,609,388 · +132.1%
Race, ethnicity, and origin ACS 2023
- Neighborhood character
- Predominantly White (77%)
- Race & ethnicity
- White 77% Hispanic / Latino 18% Two or more races 8% Asian 1%
- Hispanic origin (detail)
- Mexican 13%
- Common ancestry
- Slovak 4% Italian 3% Scottish 3%
- Foreign-born
- 9% · Canada, Dominican Republic, China
- Languages at home
- 80% English-only · Spanish 17% Chinese 1% Other Indo-European 1%
Political lean MEDSL · Utah
- 2024 margin
- Solid R (+39.8) · D 28.5% · R 68.3% · Other 3.2%
- 2008→2024 swing
- +19.1pp toward D · 2008: -58.9pp · 2024: -39.8pp
- All cycles
- 2024: R+39.8 2020: R+41.0 2016: R+37.3 2012: R+78.5 2008: R+58.9
Not yet ingested
- Civics
- —
Market trends
- HPI YoY
- ▼ -178.38%
- Current HPI
- 294.3683
- Rent YoY
- ▲ 2.26%
- Metro
- Provo-Orem, UT
- State GDP YoY
- ▲ 3.54%
- F500 in state
- 2
Industry mix (Fortune 500 HQ in UT)
| Industry | F500 HQs | Revenue |
|---|---|---|
| Financial Services | 1 | $3B |
|
||
Price history
+757.1% since first listed17 events — show timeline
- 2026-04-17 Listed $2,100,000 WFRMLS
- 2021-03-30 Sold (Public Records) — Public Records
- 2020-09-03 Listing Removed — WFRMLS
- 2020-08-10 Relisted — WFRMLS
- 2020-07-28 Pending — WFRMLS
- 2020-06-05 Price Changed $1,250,000 WFRMLS
- 2020-05-26 Listed $1,275,000 WFRMLS
- 2019-08-06 Sold (Public Records) — Public Records
- 2019-08-06 Sold (MLS) — WFRMLS
- 2019-05-28 Pending — WFRMLS
- 2019-05-02 Listed $1,030,000 WFRMLS
- 2018-12-18 Listing Removed — WFRMLS
- 2018-10-08 Listed $1,150,000 WFRMLS
- 2014-02-27 Sold (Public Records) — Public Records
- 1996-10-25 Sold (Public Records) — Public Records
- 1996-04-29 Sold (Public Records) — Public Records
- 1996-04-08 Listed $245,000 WFRMLS
Property tax history
+7.6%/yrLatest (2025): $7,932 · +31.5% YoY. Source: county tax records.
Cash-flow waterfall
monthlySold comps — $/sqft
last 12 mo · ≤1 miLoading sold comps…