5326 Cinamon Ln · Princeton, TX
Flood risk 1/10 · Minimal
- FEMA flood zone
- X (unshaded)
- Chance of flooding over 30 yrs
- 0.0%
- Est. flood insurance / yr
- $507 – $1,088
Fire risk 3/10 · Minor
- Est. fire insurance / yr
- $1,222 – $2,270
Heat risk 7/10 · Major
- Hot days now (above 110°F)
- 7 days/yr
- Hot days in 30 yrs
- 24 days/yr
Wind risk 6/10 · Moderate
- Chance of severe wind over 30 yrs
- 27.0%
Air-quality risk 3/10 · Minor
- Unhealthy air days now
- 3 days/yr
- Unhealthy air days in 30 yrs
- 3 days/yr
Risk factors via First Street. Map © Google.
Why this score? — see what drove the C grade
The composite is a weighted blend of 9 inputs, each scored 0–100. Each bar is that input's sub-score; the figure is the points it added to the 100-point composite (weight × sub-score).
- Cash flow +19.1/30.0
- ARV discount +15.0/15.0
- DSCR +6.0/10.0
- 1% rule +5.5/10.0
- Schools +4.2/10.0
- Livability +3.1/5.0
- Rent growth +2.2/5.0
- Condition / age +1.0/5.0
- Appreciation +0.0/10.0
$207,999
🖨 Deal sheet 📄 Offer letter ✓ Due diligence
Listing remarks MLS
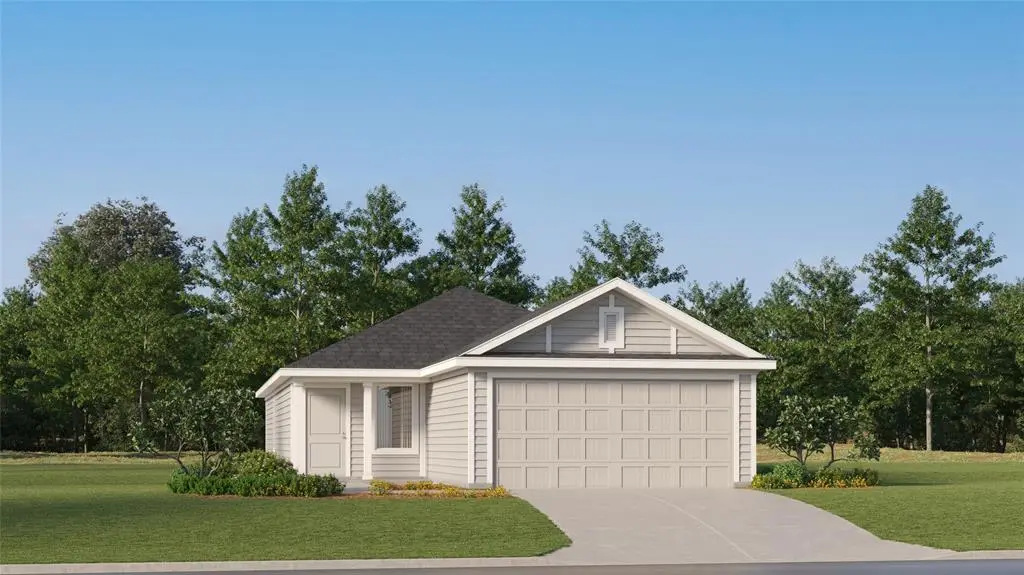
LENNAR - Acorn South- Oakridge Floorplan Prices, dimensions and features may vary and are subject to change. Photos are for illustrative purposes only.
Key facts
- 4,400 sq ft lot
- 2 garage spots
- Built 2026
Property features AI
Finance
- Other: Selling from Tillage Farms Model Home (directions provided); Builder special listing conditions
- Financial info: Acceptable financing: Cash, Conventional, FHA, USDA, VA; No second mortgage listed; Loan type treated as clear
- HOA & community: Mandatory HOA; Annual association fee; Association fee covers full use of facilities, maintenance of grounds, and management fees; HOA managed by Insight
Exterior
- Parking: Attached 2-car garage; 2 covered parking spaces; Garage faces front
- Security: Smoke detector(s); Carbon monoxide detector(s); Fire alarm
- Utilities: MUD water; MUD sewer; Concrete streets; Curbs; Sidewalk; Municipal Utility District (MUD)
- Home design: Single family residence; Residential property; One story; New construction (incomplete, 2026); Not attached to other units; Subdivision: Acorn South
- Construction: Fiber cement siding; Composition roof; Slab foundation; Built in 2026 (new construction - incomplete)
- Exterior features: Covered porch(es); Wood fencing; Landscaped yard; Sprinkler system; Lot dimensions approximately 45 x 115
Interior
- Kitchen: Natural stone/granite countertops; Pantry and walk-in pantry; Water line to refrigerator; Dishwasher; Disposal; Electric range; Microwave
- Bedrooms: 3 bedrooms (all on the main level); Primary bedroom with walk-in closet
- Flooring: Carpet; Luxury vinyl plank
- Bathrooms: 2 full bathrooms
- Heating & cooling: Central heating (electric) with ENERGY STAR qualified equipment; Central air conditioning (electric) with ENERGY STAR qualified equipment
- Interior features: Open floorplan; Built-in features; Decorative lighting; Cable TV available; High speed internet available; Pantry; Walk-in closet(s); 7 total rooms; 1 living area; 1 dining area; One-level layout
- Laundry & utility: Water heater included
Neighborhood map
What this means for you Summary
Snapshot
- This is a 3-bed/2.0-bath single-family listed at $208k. Condition is rated poor.
Deal economics
- At list price, monthly cash flow is $223 ($3k/yr) — positive.
- The deal already cash-flows at list — no discount required.
- Meets the 1% rule at list price ($2k rent vs $208k).
- Recommended offer: $205k (1.5% below list) — sets the bar for market timing.
- Cap rate 7.6% vs local median 4.5% in Princeton — top-decile yield for the area; either an underpriced asset or a hidden risk that comps aren't pricing in. Stress-test before assuming the spread holds.
Location & tenants
- Location reads 62/100 on livability (#969 in TX) — a middle-class / working-renter tenant base. Strengths: employment A+, housing A+, cost of living A; Watch: amenities F, commute F, health & safety F.
- Princeton ISD (suburban): math 51% / reading 47% proficiency, ranked #188 of 826 in TX (top 23%) — families likely to look elsewhere, expect single-tenant / working-renter base with shorter leases.
- Zoned schools: Mayfield El (609 students, 73% FRL) — zoned schools average 73% FRL vs 56% district-wide (17 pts higher); higher-poverty schools than district average — tighter screening recommended.
- Market conditions: Rents soft (-1.0%/yr); 1404 active listings in the ZIP; 34 comparable units currently listed for rent nearby; rentals at typical pace (median 22d on market — plan ~3-4 weeks tenant-placement turnaround); solid renter incomes; 19,194 units permitted in Collin County in 2024 (3,988 in 5+ unit buildings).
Forward outlook
- Local home prices are declining (-3.0%/yr); year-one equity from $1k of loan paydown is wiped out by about $6k of value loss. Plan a longer hold.
- Collin County population projected at +60% by 2050 — long-run rental-demand tailwind backs the buy-and-hold thesis.
Negotiation context
- It's been on market 25 days — a 2% lower offer ($205k) is reasonable based on typical stale-listing flexibility.
- 3 sale attempts with the ask held roughly flat each time — persistent listings suggest the price (not the market) is what's stuck; bring a comps-based counter.
Risks & watch-outs
- Climate carrying-cost: major wind risk, 27% chance of damaging wind over 30y; extreme-heat days projected 7→24/yr by 2055 (HVAC capex compounding) — expect insurance premiums to compound above CPI over the hold.
Questions for the listing agent
- Have any recent inspections been done? Can we get a copy of the seller's disclosures and any deferred-maintenance estimates?
- What does the HOA fee cover, when was the last increase, and are there any pending special assessments or reserve-fund shortfalls?
- Is there a deadline driving the sale (1031 exchange, divorce, estate, relocation)? That informs how much negotiation room exists.
- What's the average days-on-market for RENTAL listings here right now (not sales)? A rising rental-DOM trend means longer vacancies and softer asking-rent achievability than the comps imply.
- What's the recent tenant-quality profile in this submarket — average credit score on applications, eviction rate, late-payment / NSF rate, and stable-employment percentage? A property-management company in the area should have these aggregated.
- How much new for-sale + rental construction is in the pipeline within 1–3 miles? Heavy new supply typically softens prices + rents 12–24 months out; constrained supply supports both.
Investment metrics
- 1% rule
- 1.05% ✓
- Cap rate
- 7.58%
- Cash-on-cash
- 4.59%
- DSCR
- 1.20
- GRM
- 8.0
CMA / ARV
- ARV (median comp)
- $279,955
- List price
- $207,999
- Delta
- -25.70%
- Verdict
- UNDERPRICED
- Comps
- 9 within 1.0 mi
Show comp detail 3 sales within ~0.75 mi
| Address | Dist | Beds/Ba | Sqft | Sold | Price | $/sf | Match |
|---|---|---|---|---|---|---|---|
| 5240 Cinnamon Ln | 0.00mi | 3/2.0 | 1,266 (0%) | 1mo | $213,999 | $169 | 99 |
| 414 Bower Dr | 0.00mi | 3/2.0 | 1,402 (+11%) | 7mo | $201,424 | $144 | 76 |
| 416 Bower Dr | 0.00mi | 3/2.0 | 1,411 (+12%) | 6mo | $210,824 | $149 | 76 |
Match score weights: distance 35% · size 25% · config 20% · recency 20%. Top-matched comps best support the ARV.
Projected returns pro-forma
-3.0% appreciation · 0.0% rent growth · sell at horizon
- IRR
- -12.7%
- Equity multiple
- 0.56×
- Total profit
- $-25,835
- Equity at exit
- $31,013
- IRR
- -9.3%
- Equity multiple
- 0.51×
- Total profit
- $-28,613
- Equity at exit
- $17,984
Cash invested: $58,240 (down + closing). Projections, not guarantees.
Landlord ↔ Tenant lean methodology
- Overall (STATE)
- 87 Strongly Landlord-Friendly
- State Texas
- 87 Strongly Landlord-Friendly · R+5
- County
- — inherits STATE
- City
- — inherits STATE
ZIP-level market 75407
- Home prices YoY
- -30.3%
- Rents YoY
- -1.0%
- Active inventory
- 1404
- Price-to-rent
- 8.0×
Monthly cashflow live
- Estimated rent
- $2,177 high interval (Pro) →
- Mortgage (P&I)
- −$1,091
- Tax est. 1.5%
- −$260 /mo · $3,120/yr
- Insurance
- −$87
- HOA
- −$60
- Vacancy / Maint / Mgmt
- −$457
- Net cashflow
- $223
Break-even live
UW: 25.0% down · 7.5% · 30yr · 1.5% tax · 5.0% vac · 8.0% maint · 8.0% mgmt
Financing live
Cash to close
- Down payment
- $52,000
- Closing costs
- $6,240
- Reserves months
- —
- Total cash needed
- —
Loan-product check · same deal, 3 products live
Conventional
25% down · 7.5% · 30yr
- Down + closing
- —
- Monthly P&I
- —
- Monthly cashflow
- —
- DSCR
- —
- Eligible?
- —
Personal DTI + credit; lowest rate.
DSCR
20% down · 8.5% · 30yr
- Down + closing
- —
- Monthly P&I
- —
- Monthly cashflow
- —
- DSCR
- —
- Eligible?
- —
No personal income docs; deal must DSCR.
Hard money
10% down · 12.0% · 12mo
- Down + closing
- —
- Monthly P&I
- —
- Monthly cashflow
- —
- DSCR
- —
- Eligible?
- —
Short-term bridge; refi at stabilization.
Rent comps 34 comps
| Address | Beds | Baths | Sqft | Rent | $/sqft | DOM | Units | Dist |
|---|---|---|---|---|---|---|---|---|
| 7008 Vining DR Princeton, TX | 4.0 | 3.0 | 1510 | $2,500 | $1.66 | 43d | 1 | 0.03mi |
| 649 Saxony Dr Princeton, TX | 4.0 | 2.0 | 1674 | $2,100 | $1.25 | 12d | 1 | 0.79mi |
| 622 Saxony Dr Princeton, TX | 3.0 | 2.0 | 1567 | $2,000 | $1.28 | 43d | 1 | 0.82mi |
| 149 Princeton Xrds Princeton, TX | 1.0–3.0 | 1.0–2.0 | 980 | $1,914 | $1.95 | 1d | 23 | 0.88mi |
| 353 Princewood Dr Princeton, TX | 4.0 | 2.0 | 1753 | $1,950 | $1.11 | 43d | 1 | 0.94mi |
| 461 Princewood Dr Princeton, TX | 3.0 | 2.0 | 1749 | $1,750 | $1.00 | 24d | 1 | 0.94mi |
| 264 Moonstone Way Princeton, TX | 4.0 | 2.0 | 1803 | $1,795 | $1.00 | 15d | 1 | 1.05mi |
| 291 Wandering Stream Way Princeton, TX | 4.0 | 2.0 | 1803 | $1,875 | $1.04 | 43d | 1 | 1.06mi |
| 1823 Dahlia Way Princeton, TX | 4.0 | 2.0 | 1803 | $1,950 | $1.08 | 7d | 1 | 1.08mi |
| 219 Golden Sands Ln Princeton, TX | 4.0 | 2.0 | 1800 | $1,795 | $1.00 | 16d | 1 | 1.10mi |
| 281 Moonstone Way Princeton, TX | 4.0 | 2.0 | 1803 | $1,895 | $1.05 | 12d | 1 | 1.12mi |
| 280 Moonstone Way Princeton, TX | 4.0 | 2.0 | 1800 | $1,900 | $1.06 | 4d | 1 | 1.13mi |
| 1917 Lilac Dr Princeton, TX | 4.0 | 2.0 | 1850 | $2,045 | $1.11 | 43d | 1 | 1.13mi |
| 304 Wandering Stream Way Princeton, TX | 4.0 | 2.0 | 1803 | $1,875 | $1.04 | 43d | 1 | 1.14mi |
| 263 Honeysuckle Ln Princeton, TX | 4.0 | 2.0 | 1800 | $1,850 | $1.03 | 43d | 1 | 1.14mi |
| 250 N Boorman Ln Princeton, TX | 1.0–3.0 | 1.0–2.0 | 936 | $4,619 | $4.93 | 1d | 1 | 1.16mi |
| 306 Golden Sands Ln Princeton, TX | 4.0 | 2.5 | 1811 | $1,995 | $1.10 | 43d | 1 | 1.20mi |
| 605 Grenada Lake Dr Princeton, TX | 3.0 | 2.0 | 1563 | $1,925 | $1.23 | 15d | 1 | 1.23mi |
| 1707 Cotton Blossom Ln Princeton, TX | 4.0 | 2.0 | 1811 | $2,095 | $1.16 | 4d | 1 | 1.23mi |
| 313 Sweet Pea Ln Princeton, TX | 4.0 | 2.0 | 1802 | $1,900 | $1.05 | 2d | 1 | 1.26mi |
| 305 Turquoise Ln Princeton, TX | 4.0 | 2.0 | 1811 | $1,850 | $1.02 | 12d | 1 | 1.28mi |
| 882 Breakwater Dr Princeton, TX | 4.0 | 2.5 | 1824 | $2,250 | $1.23 | 21d | 1 | 1.29mi |
| 200 Cole St Princeton, TX | 1.0–3.0 | 1.0–2.0 | 960 | $1,799 | $1.87 | 43d | 23 | 1.29mi |
| 200 Cole St Princeton, TX | 1.0–3.0 | 1.0–2.0 | 960 | $1,733 | $1.80 | 1d | 9 | 1.29mi |
| 846 Breakwater Dr Princeton, TX | 3.0 | 2.5 | 1824 | $2,000 | $1.10 | 2d | 1 | 1.29mi |
| 1712 Sandalwood Way Princeton, TX | 4.0 | 2.0 | 1803 | $1,795 | $1.00 | 24d | 1 | 1.32mi |
| 1525 Farm to Market Road 982 Princeton, TX | 2.0–4.0 | 2.0–2.5 | 1551 | $2,332 | $1.50 | 1d | 54 | 1.34mi |
| 899 E Hazelwood St Princeton, TX | 1.0–3.0 | 1.0–2.0 | 989 | $1,780 | $1.80 | 1d | 14 | 1.35mi |
| 865 Table Rock St Princeton, TX | 3.0 | 2.0 | 1563 | $2,050 | $1.31 | 21d | 1 | 1.36mi |
| 803 Table Rock St Princeton, TX | 4.0 | 2.5 | 1683 | $1,850 | $1.10 | 43d | 1 | 1.38mi |
| 843 Ozark Path Princeton, TX | 3.0 | 2.0 | 1249 | $2,100 | $1.68 | 43d | 1 | 1.42mi |
| 366 Lake Erie Dr Princeton, TX | 4.0 | 2.5 | 1824 | $1,990 | $1.09 | 24d | 1 | 1.47mi |
| 315 Stone Ct Princeton, TX | 3.0 | 2.5 | 1573 | $2,100 | $1.34 | 43d | 1 | 1.48mi |
| 229 Marsh Ln Princeton, TX | 3.0 | 2.5 | 1550 | $1,650 | $1.06 | 24d | 1 | 1.50mi |
HOA detail
- Monthly dues
- $60 · $720/yr
Listing history 22 events
-
2026-06-10status $207,999 Pending 25 DOM
-
2026-06-09days on market $207,999 Active 25 DOM
Show marketing remark (156 chars)
LENNAR - Acorn South- Oakridge Floorplan Prices, dimensions and features may vary and are subject to change. Photos are for illustrative purposes only.
-
2026-06-08days on market $207,999 Active 24 DOM
-
2026-06-07days on market $207,999 Active 23 DOM
-
2026-06-04days on market $207,999 Active 20 DOM
-
2026-06-03days on market $207,999 Active 19 DOM
-
2026-06-02days on market $207,999 Active 18 DOM
Show marketing remark (156 chars)
LENNAR - Acorn South- Oakridge Floorplan Prices, dimensions and features may vary and are subject to change. Photos are for illustrative purposes only.
-
2026-06-01days on market $207,999 Active 17 DOM
-
2026-05-31days on market $207,999 Active 16 DOM
-
2026-05-15$210,359 Active 196-char remark
-
2026-05-14status Active 414-char remark
-
2026-05-03historical 414-char remark
Show marketing remark (156 chars)
LENNAR - Acorn South- Oakridge Floorplan Prices, dimensions and features may vary and are subject to change. Photos are for illustrative purposes only.
-
2026-05-03status Pending
Show marketing remark (156 chars)
LENNAR - Acorn South- Oakridge Floorplan Prices, dimensions and features may vary and are subject to change. Photos are for illustrative purposes only.
-
2026-04-24price $207,999
Show marketing remark (156 chars)
LENNAR - Acorn South- Oakridge Floorplan Prices, dimensions and features may vary and are subject to change. Photos are for illustrative purposes only.
-
2026-04-22price $207,999 414-char remark
-
2026-04-09price $209,999 414-char remark
-
2026-04-03price $211,999 414-char remark
-
2026-03-11price $213,999
Show marketing remark (156 chars)
LENNAR - Acorn South- Oakridge Floorplan Prices, dimensions and features may vary and are subject to change. Photos are for illustrative purposes only.
-
2026-03-08price $213,999 414-char remark
-
2026-03-04$215,999 Active
Show marketing remark (156 chars)
LENNAR - Acorn South- Oakridge Floorplan Prices, dimensions and features may vary and are subject to change. Photos are for illustrative purposes only.
-
2026-02-27price $215,999 414-char remark
-
2026-02-26$222,999 Active 414-char remark
ⓘ Source: listings_history table (triggers on properties + properties_extension) + one-shot
backfill from property_details.listing_events for pre-trigger history.
Climate risk First Street
- Flood 1/10 Low FEMA zone X (unshaded) · 0% chance over 30 yrs
- Wildfire 3/10 Moderate
- Heat 7/10 Severe 7 d/yr ≥110°F today · 24 d/yr by 30 yrs out
- Wind 6/10 Major 27% chance of damaging wind over 30 yrs
- Air quality 3/10 Moderate 3 unhealthy d/yr today · 3 by 30 yrs out
Nearby sold comps map
Loading sold comps map…
Walkable amenities ~0.75 mi
Loading nearby amenities…
Taxation est. · year 1
- Rental income
- $26,128
- − Mortgage interest
- −$11,651
- − Property taxes
- −$3,120
- − Insurance
- −$1,040
- − Repairs & maintenance
- −$2,090
- − Management
- −$2,090
- − HOA
- −$720
- − Depreciation
- −$6,051
- Taxable loss
- −$635
- Est. tax savings @ 24.0%
- +$152
- After-tax cash flow
- $2,824/yr
For passive investors: Depreciation is non-cash, so a rental often shows a tax loss while cash-flowing — sheltering income. Rental losses are passive: they offset passive income freely, and up to $25,000/yr can offset ordinary (W-2) income if you actively participate and your MAGI is under $100k (phasing out to $0 by $150k); unused losses carry forward. On sale, claimed depreciation is recaptured at up to 25%, and gains may owe capital-gains tax (a 1031 exchange can defer both). Figures are a year-1 estimate at your 24.0% rate — not tax advice; consult a CPA.
Condition & rehab AI · 1 photo
This home requires extensive repairs and updates, including major repairs to the exterior siding and roof, as well as painting and kitchen/bathroom updates. Significant investment is needed to bring it up to a livable condition.
Repairs flagged
- Major exterior siding — Significant damage and wear
- Major roof — Visible damage
Value-add opportunities
- Resale repair and replace exterior siding — Aesthetic improvement and increased curb appeal
- Resale repair and replace roof — Structural integrity and safety
- Both paint interior and exterior — Enhances appearance and value
- Both update kitchen and bathrooms — Modernizes the home and improves functionality
Renovation cost estimate screening
| Repair item | Severity | Est. cost |
|---|---|---|
| exterior siding · Significant damage and wear | Major | $15,000–50,000 |
| roof · Visible damage | Major | $15,000–50,000 |
| Total estimated repair cost · 2 items | $30,000–100,000 |
Value-add ROI direction
- Resale repair and replace exterior siding — Aesthetic improvement and increased curb appeal ↑
- Resale repair and replace roof — Structural integrity and safety ↑
- Both paint interior and exterior — Enhances appearance and value ↑
- Both update kitchen and bathrooms — Modernizes the home and improves functionality ↑
ⓘ Cost ranges are severity-bucket heuristics (US national rule-of-thumb). Get contractor quotes + a written scope before underwriting a rehab budget.
Schools (NCES district)
- District
- Princeton ISD
- NCES district ID
- 4835850
- Math proficiency
- 51% ▼ -8.00%
- Reading proficiency
- 47% ▬ 0.00%
- Median HH income
- $54,827
- Composite
- 42.44/100
- National rank
- #3226
- State rank
- #188 of 826 in TX
Livability — Princeton
- Score
- 62/100
- State rank
- #969
- US rank
- #17215
Category grades
Schools grade is shown separately in the Schools card above.
Census & demographics
- County
- Collin County · 1,159,394 people
- City population
- 34,171
- Metro
- Dallas-Fort Worth-Arlington, TX
- Population (ZIP)
- 34,171
- Household income
- $100,037
- Rent vs Own
- Severe rent burden
- 368.0
Population outlook (Collin County) Hauer SSP2
- Today (2025)
- 1,210,074 people
- By 2030
- 1,358,201 · +12.2%
- By 2040
- 1,654,061 · +36.7%
- By 2050
- 1,937,359 · +60.1%
- By 2075
- 2,567,039 · +112.1%
- By 2100
- 2,952,048 · +144.0%
Race, ethnicity, and origin ACS 2023
- Neighborhood character
- Diverse neighborhood (Simpson 0.66)
- Race & ethnicity
- White 47% Hispanic / Latino 30% Black 17% Two or more races 10% Asian 4% Native American 1%
- Hispanic origin (detail)
- Mexican 26%
- Common ancestry
- Lithuanian 2% Romanian 1% Russian 1%
- Foreign-born
- 15% · Canada, China, Mexico
- Languages at home
- 70% English-only · Spanish 22% Other Indo-European 2% Other Asian/Pacific 1%
Political lean MEDSL · Collin
- 2024 margin
- R (+11.1) · D 43.1% · R 54.3% · Other 2.6%
- 2008→2024 swing
- +14.4pp toward D · 2008: -25.6pp · 2024: -11.1pp
- All cycles
- 2024: R+11.1 2020: R+4.3 2016: R+17.0 2012: R+31.6 2008: R+25.6
Not yet ingested
- Civics
- —
Market trends
- HPI YoY
- ▼ -103.99%
- Current HPI
- 238.9373
- Rent YoY
- ▼ -1.02%
- Metro
- Dallas-Fort Worth-Arlington, TX
- State GDP YoY
- ▲ 3.95%
- F500 in state
- 110
Industry mix (Fortune 500 HQ in TX)
| Industry | F500 HQs | Revenue |
|---|---|---|
| Energy | 16 | $1,198B |
|
||
| Technology | 5 | $198B |
|
||
| Engineering / Construction | 4 | $72B |
|
||
| Energy Services | 3 | $60B |
|
||
| Utilities | 3 | $41B |
|
||
| Healthcare | 2 | $330B |
|
||
Price history
-3.7% since first listed9 events — show timeline
- 2026-06-09 Pending — NTREIS
- 2026-06-09 Pending — NTREIS
- 2026-06-02 Relisted — NTREIS
- 2026-05-19 Price Changed $207,999 NTREIS
- 2026-05-15 Listed $210,359 NTREIS
- 2026-05-03 Pending — NTREIS
- 2026-04-24 Price Changed $207,999 NTREIS
- 2026-03-11 Price Changed $213,999 NTREIS
- 2026-03-04 Listed $215,999 NTREIS
Cash-flow waterfall
monthlySold comps — $/sqft
last 12 mo · ≤1 miLoading sold comps…