10414 Bluegill Way · San Antonio, TX
Flood risk No data
- FEMA flood zone
- —
- Chance of flooding over 30 yrs
- —
- Est. flood insurance / yr
- —
Fire risk No data
- Est. fire insurance / yr
- —
Heat risk No data
- Hot days now (above threshold)
- —
- Hot days in 30 yrs
- —
Wind risk No data
- Chance of severe wind over 30 yrs
- —
Air-quality risk No data
- Unhealthy air days now
- —
- Unhealthy air days in 30 yrs
- —
Risk factors via First Street. Map © Google.
Why this score? — see what drove the D grade
The composite is a weighted blend of 9 inputs, each scored 0–100. Each bar is that input's sub-score; the figure is the points it added to the 100-point composite (weight × sub-score).
- Appreciation +10.0/10.0
- Cash flow +7.7/30.0
- ARV discount +7.5/15.0
- Livability +4.0/5.0
- Rent growth +2.7/5.0
- Condition / age +2.5/5.0
- 1% rule +2.3/10.0
- Schools +2.2/10.0
- DSCR +1.8/10.0
$272,749
🖨 Deal sheet (PDF) 📄 Offer letter ✓ Due diligence
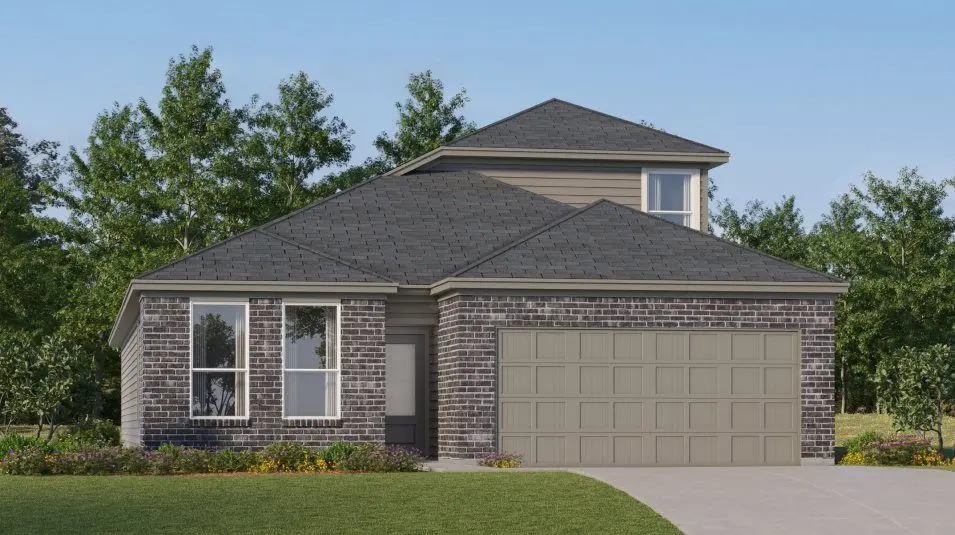
Listing remarks
The second floor of this new two-story home is host to a flexible and spacious game room, great for entertaining and hosting. Off the foyer are three secondary bedrooms, leading to an inviting open-concept floorplan with access to a covered patio. The luxe owner's suite is tucked into a private rear corner on the first floor, complete with a spa-inspired bathroom and walk-in closet.
Key facts
- Walk-in closet
- Covered patio
- 2 garage spots
Tags
Property features AI
Finance
- Other: Address: 10414 Bluegill Way, San Antonio TX 78224; Status: Active; Last updated: 2026-06-06
- Financial info: List price $271,999
Exterior
- Parking: 2 garage spaces (2 total parking spaces)
- Home design: Spec new construction - Cumberland plan
- Exterior features: Living area approximately 2,370
Interior
- Bedrooms: 4 bedrooms
- Bathrooms: 3 bathrooms (full)
- Interior features: Open living area
Neighborhood map
What this means for you Summary
Snapshot
- This is a 4-bed/3.0-bath townhouse listed at $273k.
Deal economics
- At list price, monthly cash flow is $-319 ($-4k/yr) — negative.
- To cash-flow at today's rent, offer at most $227k (16.9% below list).
- To meet the 1% rule (rent ≥ 1% of price), the offer needs to be $198k (27.3% below list).
- Recommended offer: $198k (27.3% below list) — sets the bar for 1% rule.
- Cap rate 4.9% vs local median 3.8% in San Antonio — meaningfully above typical; check what's discounted (condition, days-on-market, listing class) to confirm the premium yield is real.
Location & tenants
- Location reads 80/100 on livability (#31 in TX, #1,616 nationally) — a professional / high-income tenant draw. Strengths: amenities A+, commute A+, cost of living A+; Watch: crime F.
- Southwest ISD (rural): math 21% / reading 31% proficiency, ranked #701 of 826 in TX (top 85%) — low school quality limits family demand, transient renter base, plan for 1-2y turnover; 75% free/reduced lunch — lower-income household profile, screen leases tightly.
- Zoned schools: Spicewood Park El (math 16% / reading 23%, grade F, #3,583 of 4,322 statewide, top 86%, 593 students, 93% FRL); Ronald E Mcnair Middle (math 27% / reading 31%, grade F, #1,103 of 1,662 statewide, top 67%, 748 students, 77% FRL); Southwest H S (math 17% / reading 39%, grade F, #1,170 of 1,632 statewide, top 72%, 2,152 students, 72% FRL).
- Market conditions: Rents flat; 275 active listings in the ZIP; 30 comparable units currently listed for rent nearby; rentals at typical pace (median 26d on market — plan ~3-4 weeks tenant-placement turnaround); 40% of comp listings sitting > 30 days — soft ceiling on asking rent; 8,308 units permitted in Bexar County in 2024 (2,506 in 5+ unit buildings).
- This rent runs 40% of the median local income ($60k/yr) — at the standard rent-burdened threshold; future hikes will face affordability resistance.
Forward outlook
- In year one you build about $29k of equity ($2k loan paydown + $27k appreciation (10.0% local appreciation)).
- Bexar County population projected at +50% by 2050 — long-run rental-demand tailwind backs the buy-and-hold thesis.
- By year 2, paydown + projected appreciation supports a ~$47k cash-out refi (75% LTV) — recoverable capital for the next deal without selling this one.
Negotiation context
- It's been on market 15 days — a 2% lower offer ($269k) is reasonable based on typical stale-listing flexibility.
Questions for the listing agent
- What do current leases actually rent for vs. the listed asking? Can we see a recent rent roll and the last 12 months of T-12 income?
- Is there a deadline driving the sale (1031 exchange, divorce, estate, relocation)? That informs how much negotiation room exists.
- Crime grade is F in this area — have there been break-ins, vandalism, or insurance claims at this property in the last 3 years? What carrier currently insures it and at what premium?
- The area grade is low — what's the realistic commute time and amenity access for the typical tenant pool here? Any planned neighborhood developments (good or bad) we should know about?
- What's the average days-on-market for RENTAL listings here right now (not sales)? A rising rental-DOM trend means longer vacancies and softer asking-rent achievability than the comps imply.
- What's the recent tenant-quality profile in this submarket — average credit score on applications, eviction rate, late-payment / NSF rate, and stable-employment percentage? A property-management company in the area should have these aggregated.
- How much new for-sale + rental construction is in the pipeline within 1–3 miles? Heavy new supply typically softens prices + rents 12–24 months out; constrained supply supports both.
Investment metrics
- 1% rule
- 0.73% ✗
- Cap rate
- 4.89%
- Cash-on-cash
- -5.02%
- DSCR
- 0.78
- GRM
- 11.5
CMA / ARV
No comps found within radius.
Projected returns pro-forma
10.0% appreciation · 0.83% rent growth · sell at horizon
- IRR
- 20.1%
- Equity multiple
- 2.62×
- Total profit
- $123,998
- Equity at exit
- $245,714
- IRR
- 18.0%
- Equity multiple
- 5.89×
- Total profit
- $373,355
- Equity at exit
- $529,891
Cash invested: $76,370 (down + closing). Projections, not guarantees.
Landlord ↔ Tenant lean methodology
- Overall (STATE)
- 87 Strongly Landlord-Friendly
- State Texas
- 87 Strongly Landlord-Friendly · R+5
- County
- — inherits STATE
- City
- — inherits STATE
ZIP-level market 78224
- Home prices YoY
- 12.4%
- Rents YoY
- 0.8%
- Active inventory
- 275
- Price-to-rent
- 11.5×
Monthly cashflow live
- Estimated rent
- $1,982 high interval (Pro) →
- Mortgage (P&I)
- −$1,430
- Tax est. 1.5%
- −$341 /mo · $4,091/yr
- Insurance
- −$114
- HOA
- −$0
- Vacancy / Maint / Mgmt
- −$416
- Net cashflow
- $-319
Break-even live
Sensitivity live
| Price | -10% $-131 | -5% $-225 | +0% $-319 | +5% $-414 | +10% $-508 |
|---|---|---|---|---|---|
| Rent | -10% $-476 | -5% $-398 | +0% $-319 | +5% $-241 | +10% $-163 |
| Rate | -1.0pp $-182 | -0.5pp $-250 | base $-319 | +0.5pp $-390 | +1.0pp $-462 |
UW: 25.0% down · 7.5% · 30yr · 1.5% tax · 5.0% vac · 8.0% maint · 8.0% mgmt
Financing live
Cash to close
- Down payment
- $68,187
- Closing costs
- $8,182
- Reserves months
- —
- Total cash needed
- —
Loan-product check · same deal, 3 products live
Conventional
25% down · 7.5% · 30yr
- Down + closing
- —
- Monthly P&I
- —
- Monthly cashflow
- —
- DSCR
- —
- Eligible?
- —
Personal DTI + credit; lowest rate.
DSCR
20% down · 8.5% · 30yr
- Down + closing
- —
- Monthly P&I
- —
- Monthly cashflow
- —
- DSCR
- —
- Eligible?
- —
No personal income docs; deal must DSCR.
Hard money
10% down · 12.0% · 12mo
- Down + closing
- —
- Monthly P&I
- —
- Monthly cashflow
- —
- DSCR
- —
- Eligible?
- —
Short-term bridge; refi at stabilization.
Rent comps 30 comps
| Address | Beds | Baths | Sqft | Rent | $/sqft | DOM | Units | Dist |
|---|---|---|---|---|---|---|---|---|
| 10523 Goose Way San Antonio, TX | 4.0 | 2.5 | 1917 | $1,785 | $0.93 | 45d | 1 | 0.27mi |
| 2107 Bigmouth Rod San Antonio, TX | 3.0 | 2.5 | 1777 | $1,675 | $0.94 | 45d | 1 | 0.35mi |
| 2111 Bigmouth Rod San Antonio, TX | 4.0 | 2.5 | 1917 | $1,700 | $0.89 | 45d | 1 | 0.35mi |
| 10723 Goose Way San Antonio, TX | 4.0 | 2.5 | 1917 | $1,785 | $0.93 | 45d | 1 | 0.36mi |
| 2115 Bigmouth Rod San Antonio, TX | 4.0 | 2.5 | 1847 | $1,755 | $0.95 | 45d | 1 | 0.36mi |
| 10710 Butterfly Pass San Antonio, TX | 4.0 | 2.5 | 1917 | $1,785 | $0.93 | 45d | 1 | 0.37mi |
| 10611 Vesta Curv San Antonio, TX | 4.0 | 2.0 | 1627 | $1,735 | $1.07 | 6d | 1 | 0.37mi |
| 10622 Vesta Curv San Antonio, TX | 4.0 | 2.0 | 1627 | $1,725 | $1.06 | 6d | 1 | 0.38mi |
| 1347 Neria LOOP San Antonio, TX | 4.0 | 2.5 | 2173 | $1,699 | $0.78 | 45d | 1 | 0.39mi |
| 10811 Soupe CV San Antonio, TX | 4.0 | 2.5 | 2173 | $1,995 | $0.92 | 4d | 1 | 0.39mi |
| 10719 Butterfly Pass San Antonio, TX | 3.0 | 2.5 | 1645 | $1,640 | $1.00 | 45d | 1 | 0.40mi |
| 10723 Butterfly Pass San Antonio, TX | 4.0 | 2.5 | 1687 | $1,675 | $0.99 | 45d | 1 | 0.40mi |
| 2222 Fishing Trl San Antonio, TX | 4.0 | 2.5 | 1917 | $1,785 | $0.93 | 25d | 1 | 0.42mi |
| 2226 Fishing Trl San Antonio, TX | 3.0 | 2.5 | 1777 | $1,650 | $0.93 | 25d | 1 | 0.43mi |
| 10807 Bernal Cv San Antonio, TX | 4.0 | 2.0 | 1575 | $1,700 | $1.08 | 18d | 1 | 0.43mi |
| 2230 Fishing Trl San Antonio, TX | 4.0 | 2.5 | 1847 | $1,755 | $0.95 | 25d | 1 | 0.44mi |
| 10823 Bernal Cv San Antonio, TX | 4.0 | 2.0 | 1600 | $2,000 | $1.25 | 3d | 1 | 0.44mi |
| 10151 Asta Trl San Antonio, TX | 4.0 | 2.0 | 1625 | $1,650 | $1.02 | 14d | 1 | 0.45mi |
| 2235 Fishing Trl San Antonio, TX | 4.0 | 2.5 | 1847 | $1,755 | $0.95 | 45d | 1 | 0.46mi |
| 2242 Fishing Trl San Antonio, TX | 4.0 | 2.5 | 1917 | $1,785 | $0.93 | 45d | 1 | 0.47mi |
| 10135 Ana Hts San Antonio, TX | 4.0 | 2.0 | 1952 | $2,200 | $1.13 | 0d | 1 | 0.50mi |
| 10107 Kersey Ml San Antonio, TX | 4.0 | 2.0 | 1628 | $1,695 | $1.04 | 25d | 1 | 0.52mi |
| 1407 Mira Ml San Antonio, TX | 4.0 | 2.0 | 1600 | $2,000 | $1.25 | 18d | 1 | 0.53mi |
| 10031 Kersey Ml San Antonio, TX | 4.0 | 2.5 | 1950 | $1,895 | $0.97 | 3d | 1 | 0.53mi |
| 2307 Applewhite Mdw San Antonio, TX | 4.0 | 2.5 | 1798 | $1,750 | $0.97 | 45d | 1 | 0.55mi |
| 2318 Applewhite Mdw San Antonio, TX | 4.0 | 2.5 | 1798 | $1,795 | $1.00 | 25d | 1 | 0.58mi |
| 10258 Asta Trl San Antonio, TX | 4.0 | 2.0 | 1625 | $1,590 | $0.98 | 18d | 1 | 0.59mi |
| 2343 Applewhite Mdw San Antonio, TX | 4.0 | 2.5 | 1798 | $1,795 | $1.00 | 25d | 1 | 0.62mi |
| 10834 Saleh Cor San Antonio, TX | 4.0 | 4.0 | 2908 | $3,250 | $1.12 | 0d | 1 | 0.73mi |
| 2434 Dry Moss Way San Antonio, TX | 4.0 | 2.5 | 2417 | $2,500 | $1.03 | 0d | 1 | 0.75mi |
Listing history 10 events
-
2026-06-21days on market $272,749 Active 15 DOM
-
2026-06-18days on market $272,749 Active 12 DOM
-
2026-06-17days on market $272,749 Active 11 DOM
-
2026-06-16days on market $272,749 Active 10 DOM
-
2026-06-15days on market $272,749 Active 9 DOM
-
2026-06-13days on market $272,749 Active 7 DOM
-
2026-06-09days on market $272,749 Active 3 DOM
-
2026-06-08pricedays on market $272,749 Active 2 DOM
-
2026-06-07remarks 385-char remark
-
2026-06-07$271,999 Active 1 DOM
ⓘ Source: listings_history table (triggers on properties + properties_extension) + one-shot
backfill from property_details.listing_events for pre-trigger history.
Nearby sold comps map
Loading sold comps map…
Walkable amenities ~0.75 mi
Loading nearby amenities…
Taxation est. · year 1
- Rental income
- $23,780
- − Mortgage interest
- −$15,278
- − Property taxes
- −$4,091
- − Insurance
- −$1,364
- − Repairs & maintenance
- −$1,902
- − Management
- −$1,902
- − Depreciation
- −$7,935
- Taxable loss
- −$8,693
- Est. tax savings @ 24.0%
- +$2,086
- After-tax cash flow
- $-1,747/yr
For passive investors: Depreciation is non-cash, so a rental often shows a tax loss while cash-flowing — sheltering income. Rental losses are passive: they offset passive income freely, and up to $25,000/yr can offset ordinary (W-2) income if you actively participate and your MAGI is under $100k (phasing out to $0 by $150k); unused losses carry forward. On sale, claimed depreciation is recaptured at up to 25%, and gains may owe capital-gains tax (a 1031 exchange can defer both). Figures are a year-1 estimate at your 24.0% rate — not tax advice; consult a CPA.
Schools (NCES district)
- District
- Southwest ISD
- NCES district ID
- 4840950
- Math proficiency
- 21% ▼ -21.00%
- Reading proficiency
- 31% ▼ -5.00%
- Median HH income
- $43,362
- Composite
- 22.22/100
- National rank
- #8153
- State rank
- #701 of 826 in TX
Livability — San Antonio
- Score
- 80/100
- State rank
- #31
- US rank
- #1616
Category grades
Schools grade is shown separately in the Schools card above.
Census & demographics
- Census place
- San Antonio, TX
- County
- Bexar County · 1,990,555 people
- City population
- 1,806,925
- Metro
- San Antonio-New Braunfels, TX
- Population (ZIP)
- 22,232
- Household income
- $59,891
- Rent vs Own
- Severe rent burden
- 721.0
Population outlook (Bexar County) Hauer SSP2
- Today (2025)
- 2,336,851 people
- By 2030
- 2,560,728 · +9.6%
- By 2040
- 3,020,569 · +29.3%
- By 2050
- 3,493,522 · +49.5%
- By 2075
- 4,668,459 · +99.8%
- By 2100
- 5,533,242 · +136.8%
Race, ethnicity, and origin ACS 2023
- Neighborhood character
- Predominantly Hispanic (90%)
- Race & ethnicity
- Hispanic / Latino 90% Two or more races 24% White 6% Native American 2% Asian 2%
- Hispanic origin (detail)
- Mexican 75%
- Common ancestry
- Italian 1%
- Foreign-born
- 18% · Canada, Vietnam, China
- Languages at home
- 44% English-only · Spanish 55% Chinese 1%
Political lean MEDSL · Bexar
- 2024 margin
- Lean D (+9.8) · D 54.3% · R 44.6% · Other 1.1%
- 2008→2024 swing
- +4.2pp toward D · 2008: 5.6pp · 2024: 9.8pp
- All cycles
- 2024: D+9.8 2020: D+18.2 2016: D+13.5 2012: D+4.6 2008: D+5.6
Not yet ingested
- Civics
- —
Market trends
- HPI YoY
- ▲ 29.95%
- Current HPI
- 272.0709
- Rent YoY
- ▲ 0.83%
- Metro
- San Antonio-New Braunfels, TX
- State GDP YoY
- ▲ 3.95%
- F500 in state
- 110
Industry mix (Fortune 500 HQ in TX)
| Industry | F500 HQs | Revenue |
|---|---|---|
| Energy | 16 | $1,198B |
|
||
| Technology | 5 | $198B |
|
||
| Engineering / Construction | 4 | $72B |
|
||
| Energy Services | 3 | $60B |
|
||
| Utilities | 3 | $41B |
|
||
| Healthcare | 2 | $330B |
|
||
Cash-flow waterfall
monthlySold comps — $/sqft
last 12 mo · ≤1 miLoading sold comps…