 Triplex
2310 Roberts Ave · Wichita Falls, TX
Flood risk 1/10 · Minimal
- FEMA flood zone
- X (unshaded)
- Chance of flooding over 30 yrs
- 0.0%
- Est. flood insurance / yr
- $507 – $1,088
Fire risk 2/10 · Minimal
- Est. fire insurance / yr
- $1,222 – $2,270
Heat risk 7/10 · Major
- Hot days now (above 109°F)
- 7 days/yr
- Hot days in 30 yrs
- 20 days/yr
Wind risk 4/10 · Minor
- Chance of severe wind over 30 yrs
- 8.0%
Air-quality risk 1/10 · Minimal
- Unhealthy air days now
- 0 days/yr
- Unhealthy air days in 30 yrs
- 0 days/yr
Risk factors via First Street. Map © Google.
Why this score? — see what drove the B- grade
The composite is a weighted blend of 9 inputs, each scored 0–100. Each bar is that input's sub-score; the figure is the points it added to the 100-point composite (weight × sub-score).
- Cash flow +30.0/30.0
- 1% rule +10.0/10.0
- DSCR +10.0/10.0
- ARV discount +7.5/15.0
- Rent growth +3.8/5.0
- Livability +3.5/5.0
- Schools +2.7/10.0
- Condition / age +2.5/5.0
- Appreciation +0.0/10.0
$184,900
🖨 Deal sheet 📄 Offer letter ✓ Due diligence
Multi-family units
County records classify this as Multi-Family (2-4 Unit). Listing-text estimate: 3 units. confirmed
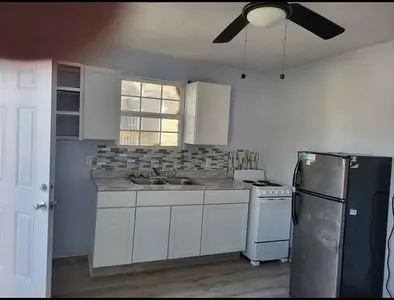
Listing remarks
Triplex opportunity at 2310 Roberts Ave in Wichita Falls offering immediate income with additional upside. Two units are currently occupied, generating $625 and $725 per month. The third unit is in shell condition and ready for finish-out, with projected rent around $950 per month once completed. Estimated finish-out cost is approximately $15,000 & acirc; & euro; & ldquo; $20,000 depending on desired finishes. Major infrastructure improvements have already been addressed, including updated plumbing throughout (completed approximately three years ago) and updated electrical boxes. Units are individually metered for electricity. Unit A is set up for separate utilities, while Units
Key facts
- Separate utilities
- Triplex opportunity
- Shared water service
Tags
Neighborhood map
What this means for you Summary
Snapshot
- This is a 3 × 4-bed/3.0-bath units multifamily listed at $185k.
Deal economics
- At list price, monthly cash flow is $1k ($17k/yr) — positive. Per door: $475/mo.
- The deal already cash-flows at list — no discount required.
- Meets the 1% rule at list price ($3k rent vs $185k).
- Recommended offer: $182k (1.5% below list) — sets the bar for market timing.
- Cap rate 15.5% vs local median 4.7% in Wichita Falls — top-decile yield for the area; either an underpriced asset or a hidden risk that comps aren't pricing in. Stress-test before assuming the spread holds.
Location & tenants
- Location reads 69/100 on livability (#437 in TX) — a middle-class / working-renter tenant base. Strengths: cost of living A+, housing A+; Watch: health & safety C-, employment D+, schools D.
- Wichita Falls ISD (urban): math 31% / reading 33% proficiency, ranked #585 of 826 in TX (top 71%) — families likely to look elsewhere, expect single-tenant / working-renter base with shorter leases.
- Market conditions: Rents rising fast (+5.3%/yr); 133 active listings in the ZIP; 9 comparable units currently listed for rent nearby; rentals lingering (median 44d on market — plan ~5-8 weeks vacancy on turnover, expect pricing pressure); 100% of comp listings sitting > 30 days — soft ceiling on asking rent; lower-income renter base — watch delinquency; 231 units permitted in Wichita County in 2024 (10 in 5+ unit buildings).
- At $3,250/mo this rent would consume 93% of the median local household income ($42k/yr) (locally 577% of renters already pay >50% of income on rent) — very limited rent-growth headroom before tenants either downsize or default.
Forward outlook
- Local home prices are declining (-3.0%/yr); year-one equity from $1k of loan paydown is wiped out by about $6k of value loss. Plan a longer hold.
- Wichita County population projected to shrink 7% by 2050 — rents likely to lag national; underwrite the cash flow, not the appreciation.
- At projected returns (-3.0% appreciation + 5.3% rent growth), your $52k cash investment doubles in ~4 years — after that, you're playing with house money.
Negotiation context
- It's been on market 29 days — a 2% lower offer ($182k) is reasonable based on typical stale-listing flexibility.
Risks & watch-outs
- Watch-outs: built in 1925 — expect roof / HVAC / electrical / plumbing capex.
- Climate carrying-cost: extreme-heat days projected 7→20/yr by 2055 (HVAC capex compounding) — expect insurance premiums to compound above CPI over the hold.
Questions for the listing agent
- Can we see the unit-by-unit rent roll, current vacancy, and any below-market leases? What's the average tenancy length?
- What capital expenditures (roof, boiler, parking lot, exteriors) have been made in the last 5 years, and what's planned in the next 2?
- Built in 1925 — when were the roof, HVAC, electrical panel, plumbing, and water heater last replaced?
- Is there a deadline driving the sale (1031 exchange, divorce, estate, relocation)? That informs how much negotiation room exists.
- Schools are D-rated, which usually means shorter tenancies and higher turnover. Who's the typical renter profile here, and what's been the actual vacancy rate?
- Crime grade is D in this area — have there been break-ins, vandalism, or insurance claims at this property in the last 3 years? What carrier currently insures it and at what premium?
- What's the average days-on-market for RENTAL listings here right now (not sales)? A rising rental-DOM trend means longer vacancies and softer asking-rent achievability than the comps imply.
- What's the recent tenant-quality profile in this submarket — average credit score on applications, eviction rate, late-payment / NSF rate, and stable-employment percentage? A property-management company in the area should have these aggregated.
- How much new apartment / multifamily construction is in the pipeline within 1–3 miles? Heavy new supply (>2% of stock underway) typically softens rents 12–24 months out; light construction supports rent growth.
Investment metrics
- 1% rule
- 1.76% ✓
- Cap rate
- 15.54%
- Cash-on-cash
- 33.03%
- DSCR
- 2.47
- GRM
- 4.7
CMA / ARV
- ARV (median comp)
- $91,387
- List price
- $184,900
- Delta
- 102.33%
- Verdict
- OVERPRICED
- Comps
- 4 within 1.0 mi
Show comp detail 1 sale within ~0.75 mi
| Address | Dist | Beds/Ba | Sqft | Sold | Price | $/sf | Match |
|---|---|---|---|---|---|---|---|
| 705 Baylor St | 0.60mi | 3/3.0 | 1,592 (-8%) | 6mo | $85,000 | $53 | 54 |
Match score weights: distance 35% · size 25% · config 20% · recency 20%. Top-matched comps best support the ARV.
Projected returns pro-forma
-3.0% appreciation · 5.27% rent growth · sell at horizon
- IRR
- 30.6%
- Equity multiple
- 2.32×
- Total profit
- $68,353
- Equity at exit
- $27,569
- IRR
- 39.0%
- Equity multiple
- 5.03×
- Total profit
- $208,880
- Equity at exit
- $15,987
Cash invested: $51,772 (down + closing). Projections, not guarantees.
Landlord ↔ Tenant lean methodology
- Overall (STATE)
- 87 Strongly Landlord-Friendly
- State Texas
- 87 Strongly Landlord-Friendly · R+5
- County
- — inherits STATE
- City
- — inherits STATE
ZIP-level market 76301
- Home prices YoY
- -34.1%
- Rents YoY
- 5.3%
- Active inventory
- 133
- Price-to-rent
- 14.2×
Monthly cashflow live
- Estimated rent
- $3,250 medium interval (Pro) →
- Mortgage (P&I)
- −$970
- Tax from tax record
- −$96 /mo · $1,150/yr
- Insurance
- −$77
- HOA
- −$0
- Vacancy / Maint / Mgmt
- −$682
- Net cashflow
- $1,425
Break-even live
3-unit breakdown (identical units grouped — click to expand)
| Units | Beds | Baths | Est. rent |
|---|---|---|---|
| 3× units | 4 | 3 | $3,249 |
| #1 | 4 | 3 | $1,083 |
| #2 | 4 | 3 | $1,083 |
| #3 | 4 | 3 | $1,083 |
| Total (3 units) | $3,250 | ||
UW: 25.0% down · 7.5% · 30yr · 1.5% tax · 5.0% vac · 8.0% maint · 8.0% mgmt
Financing live
Cash to close
- Down payment
- $46,225
- Closing costs
- $5,547
- Reserves months
- —
- Total cash needed
- —
Loan-product check · same deal, 3 products live
Conventional
25% down · 7.5% · 30yr
- Down + closing
- —
- Monthly P&I
- —
- Monthly cashflow
- —
- DSCR
- —
- Eligible?
- —
Personal DTI + credit; lowest rate.
DSCR
20% down · 8.5% · 30yr
- Down + closing
- —
- Monthly P&I
- —
- Monthly cashflow
- —
- DSCR
- —
- Eligible?
- —
No personal income docs; deal must DSCR.
Hard money
10% down · 12.0% · 12mo
- Down + closing
- —
- Monthly P&I
- —
- Monthly cashflow
- —
- DSCR
- —
- Eligible?
- —
Short-term bridge; refi at stabilization.
Rent comps 9 comps
| Address | Beds | Baths | Sqft | Rent | $/sqft | DOM | Units | Dist |
|---|---|---|---|---|---|---|---|---|
| 1916 7th St Wichita Falls, TX | 2.0 | 1.0 | 1226 | $1,050 | $0.86 | 43d | 1 | 0.36mi |
| 1821 9th St Unit B Wichita Falls, TX | 2.0 | 1.0 | 1200 | $795 | $0.66 | 43d | 1 | 0.51mi |
| 1507 Polk St Wichita Falls, TX | 3.0 | 1.0 | 1316 | $1,050 | $0.80 | 43d | 1 | 0.61mi |
| 1714 7th St Wichita Falls, TX | 3.0 | 1.0 | 1452 | $850 | $0.59 | 43d | 1 | 0.64mi |
| 1813 Polk St Wichita Falls, TX | 3.0 | 2.0 | 1090 | $1,364 | $1.25 | 43d | 1 | 0.89mi |
| 2006 Bell St Wichita Falls, TX | 3.0 | 1.0 | 1120 | $1,000 | $0.89 | 43d | 1 | 1.00mi |
| 2130 Avenue K Wichita Falls, TX | 3.0 | 2.0 | 1090 | $1,390 | $1.28 | 43d | 1 | 1.01mi |
| 2003 Buchanan St Wichita Falls, TX | 3.0 | 2.0 | 1118 | $1,100 | $0.98 | 43d | 1 | 1.02mi |
| 2912 Avenue L Unit L Wichita Falls, TX | 2.0 | 1.0 | 1104 | $895 | $0.81 | 43d | 1 | 1.23mi |
Listing history 11 events
-
2026-06-10days on market $184,900 Active 29 DOM
-
2026-06-09days on market $184,900 Active 28 DOM
-
2026-06-08days on market $184,900 Active 27 DOM
-
2026-06-07days on market $184,900 Active 26 DOM
-
2026-06-05days on market $184,900 Active 23 DOM
-
2026-06-02days on market $184,900 Active 21 DOM
-
2026-06-01days on market $184,900 Active 20 DOM
-
2026-05-31days on market $184,900 Active 19 DOM
-
2026-05-30days on market $184,900 Active 18 DOM
-
2026-05-12$184,900 Active 1156-char remark
-
2006-08-18soldstatus
ⓘ Source: listings_history table (triggers on properties + properties_extension) + one-shot
backfill from property_details.listing_events for pre-trigger history.
Tax reassessment forecast TX · Resets to sale price
- Current annual tax
- $1,150 · $96/mo
- Projected year-2 tax
- $3,384 · $282/mo
- Expected delta
- +$2,234/yr (+$186/mo · 194.2%)
ⓘ Screening estimate from a state-policy table — verify with the county assessor before closing.
Climate risk First Street
- Flood 1/10 Low FEMA zone X (unshaded) · 0% chance over 30 yrs
- Wildfire 2/10 Low
- Heat 7/10 Severe 7 d/yr ≥109°F today · 20 d/yr by 30 yrs out
- Wind 4/10 Moderate 8% chance of damaging wind over 30 yrs
- Air quality 1/10 Low 0 unhealthy d/yr today · 0 by 30 yrs out
Nearby sold comps map
Loading sold comps map…
Walkable amenities ~0.75 mi
Loading nearby amenities…
Taxation est. · year 1
- Rental income
- $39,000
- − Mortgage interest
- −$10,357
- − Property taxes
- −$1,150
- − Insurance
- −$924
- − Repairs & maintenance
- −$3,120
- − Management
- −$3,120
- − Depreciation
- −$5,379
- Taxable income
- $14,949
- Est. tax owed @ 24.0%
- −$3,588
- After-tax cash flow
- $13,512/yr
For passive investors: Depreciation is non-cash, so a rental often shows a tax loss while cash-flowing — sheltering income. Rental losses are passive: they offset passive income freely, and up to $25,000/yr can offset ordinary (W-2) income if you actively participate and your MAGI is under $100k (phasing out to $0 by $150k); unused losses carry forward. On sale, claimed depreciation is recaptured at up to 25%, and gains may owe capital-gains tax (a 1031 exchange can defer both). Figures are a year-1 estimate at your 24.0% rate — not tax advice; consult a CPA.
Schools (NCES district)
- District
- Wichita Falls ISD
- NCES district ID
- 4845780
- Math proficiency
- 31% ▼ -10.00%
- Reading proficiency
- 33% ▼ -7.00%
- Median HH income
- $41,604
- Composite
- 27.06/100
- National rank
- #7051
- State rank
- #585 of 826 in TX
Livability — Wichita Falls
- Score
- 69/100
- State rank
- #437
- US rank
- #8940
Category grades
Schools grade is shown separately in the Schools card above.
Census & demographics
- Census place
- Wichita Falls, TX
- County
- Wichita County · 95,694 people
- City population
- 95,694
- Metro
- Wichita Falls, TX
- Population (ZIP)
- 15,479
- Household income
- $41,947
- Rent vs Own
- Severe rent burden
- 577.0
Population outlook (Wichita County) Hauer SSP2
- Today (2025)
- 129,638 people
- By 2030
- 128,366 · -1.0%
- By 2040
- 124,466 · -4.0%
- By 2050
- 120,499 · -7.0%
- By 2075
- 113,884 · -12.2%
- By 2100
- 101,818 · -21.5%
Race, ethnicity, and origin ACS 2023
- Neighborhood character
- Diverse neighborhood (Simpson 0.67)
- Race & ethnicity
- White 40% Hispanic / Latino 38% Black 18% Two or more races 15% Asian 1%
- Hispanic origin (detail)
- Mexican 36%
- Common ancestry
- Slovak 3% Lithuanian 2% Italian 1%
- Foreign-born
- 11% · Canada, Vietnam
- Languages at home
- 76% English-only · Spanish 22%
Political lean MEDSL · Wichita
- 2024 margin
- Solid R (+44.0) · D 27.5% · R 71.5%
- 2008→2024 swing
- -5.2pp toward R · 2008: -38.9pp · 2024: -44.0pp
- All cycles
- 2024: R+44.0 2020: R+41.1 2016: R+49.7 2012: R+47.1 2008: R+38.9
Not yet ingested
- Civics
- —
Market trends
- HPI YoY
- ▼ -69.89%
- Current HPI
- 135.1511
- Rent YoY
- ▲ 5.27%
- Metro
- Wichita Falls, TX
- State GDP YoY
- ▲ 3.95%
- F500 in state
- 110
Industry mix (Fortune 500 HQ in TX)
| Industry | F500 HQs | Revenue |
|---|---|---|
| Energy | 16 | $1,198B |
|
||
| Technology | 5 | $198B |
|
||
| Engineering / Construction | 4 | $72B |
|
||
| Energy Services | 3 | $60B |
|
||
| Utilities | 3 | $41B |
|
||
| Healthcare | 2 | $330B |
|
||
Property tax history
+5.4%/yrLatest (2025): $1,150 · +17.8% YoY. Source: county tax records.
Cash-flow waterfall
monthlySold comps — $/sqft
last 12 mo · ≤1 miLoading sold comps…