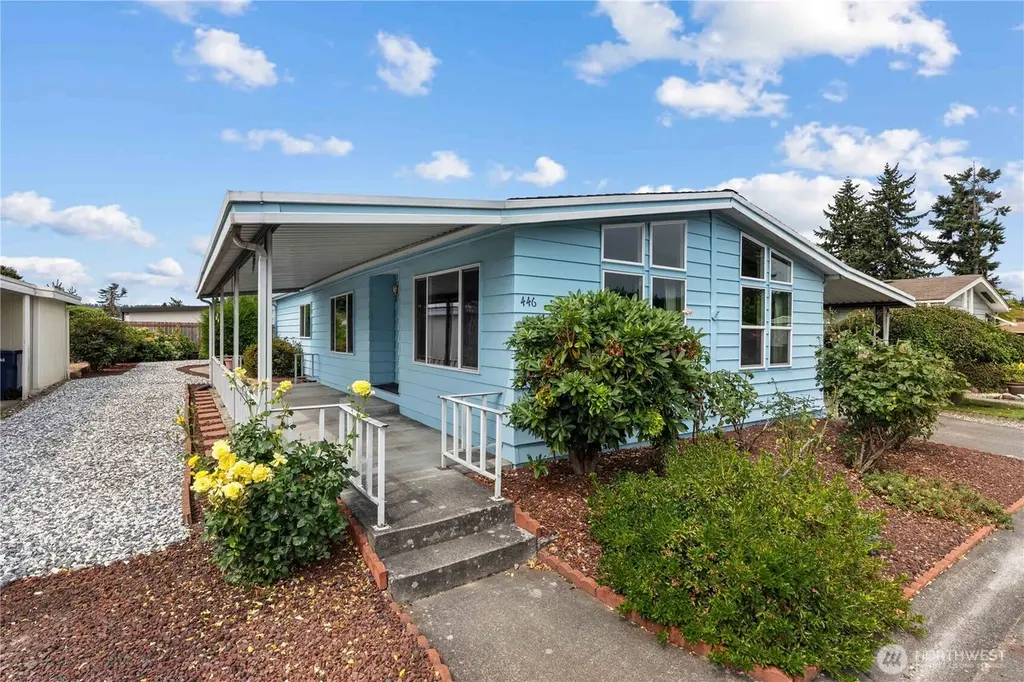
1402 22nd St NE #446 · Auburn, WA
Flood risk 6/10 · Moderate
- FEMA flood zone
- X (unshaded)
- Chance of flooding over 30 yrs
- 0.27%
- Est. flood insurance / yr
- $507 – $1,088
Fire risk 1/10 · Minimal
- Est. fire insurance / yr
- $604 – $1,122
Heat risk 4/10 · Minor
- Hot days now (above 87°F)
- 7 days/yr
- Hot days in 30 yrs
- 16 days/yr
Wind risk 1/10 · Minimal
- Chance of severe wind over 30 yrs
- —
Air-quality risk 7/10 · Major
- Unhealthy air days now
- 10 days/yr
- Unhealthy air days in 30 yrs
- 11 days/yr
Risk factors via First Street. Map © Google.
Why this score? — see what drove the B+ grade
The composite is a weighted blend of 9 inputs, each scored 0–100. Each bar is that input's sub-score; the figure is the points it added to the 100-point composite (weight × sub-score).
- Cash flow +30.0/30.0
- ARV discount +15.0/15.0
- 1% rule +10.0/10.0
- DSCR +10.0/10.0
- Schools +4.7/10.0
- Livability +4.0/5.0
- Rent growth +2.9/5.0
- Condition / age +2.5/5.0
- Appreciation +0.0/10.0
$79,500
🖨 Deal sheet 📄 Offer letter ✓ Due diligence
Listing remarks
Welcome home to Rio Verde, a well-maintained, gated community for 55+ in Auburn. Vaulted ceilings and lots of natural light from the floor-to-ceiling double pane windows await! This home is well-situated in the neighborhood, right across from the community park and gazebo, so you've got additional parking for guests. This 2 bed 2 bath home has many recent updates including new flooring in kitchen and laundry room, newer windows, a 3yr old heat pump for central A/C, and the roof was replaced less than 10 years ago! The home has an open floor plan and a wood stove to keep cozy in the winter. Kitchen has tons of cabinet and counter space and all appliances stay. Home is move in ready, but you
Key facts
- Community pool
- Built 1981
- Listed 51 days
Property features AI
Finance
- Other: Seller reports property as residential manufactured home; approved for sale in park
- Financial info: Land lease amount: $1,263; Listing terms: Cash or Conventional
- HOA & community: Located in Rio Verde senior community; Park amenities: clubhouse, common area, exercise room, laundry, pool, RV parking, security gate; Land lease
Exterior
- Parking: Carport
- Security: Security gate
- Utilities: Public water; Electric and wood energy sources
- Home design: Manufactured home (double wide); One story; Hillcrest make; Entry on slab foundation; Mobile home remains
- Construction: Metal/vinyl construction; Composition roof; Slab foundation; Manufactured after 06/15/1976
- Exterior features: Metal/vinyl exterior; Paved lot; Has a view
Interior
- Kitchen: Double oven; Stove/Range; Refrigerator
- Bedrooms: 2 bedrooms
- Flooring: Laminate; Vinyl plank; Carpet
- Bathrooms: 2 full bathrooms
- Heating & cooling: Forced air heating; Heat pump (heating and cooling)
- Interior features: Vaulted ceilings; Skylights; Drapes; Jetted/soaking tub; Bath off primary; Landscaped; Patio/porch/deck; Double pane windows; Awnings
- Laundry & utility: Washer; Dryer
Neighborhood map
What this means for you Summary
Snapshot
- This is a 2-bed/2.0-bath manufactured listed at $80k.
Deal economics
- At list price, monthly cash flow is $990 ($12k/yr) — positive.
- The deal already cash-flows at list — no discount required.
- Meets the 1% rule at list price ($2k rent vs $80k).
- Recommended offer: $77k (3.0% below list) — sets the bar for market timing.
- Cap rate 21.2% vs local median 2.7% in Auburn — top-decile yield for the area; either an underpriced asset or a hidden risk that comps aren't pricing in. Stress-test before assuming the spread holds.
Location & tenants
- Location reads 81/100 on livability (#75 in WA, #1,371 nationally) — a professional / high-income tenant draw. Strengths: amenities A+, commute A+, employment A+; Watch: crime F, cost of living F.
- Auburn School District (urban): math 47% / reading 56% proficiency, ranked #125 of 291 in WA (top 43%) — acceptable for families but not a draw, mixed tenant base, ~2y average lease.
- Market conditions: Rents rising (+1.5%/yr); 171 active listings in the ZIP; 36 comparable units currently listed for rent nearby; rentals at typical pace (median 15d on market — plan ~3-4 weeks tenant-placement turnaround); solid renter incomes; 10,555 units permitted in King County in 2024 (7,119 in 5+ unit buildings).
Forward outlook
- Local home prices are declining (-3.0%/yr); year-one equity from $550 of loan paydown is wiped out by about $2k of value loss. Plan a longer hold.
- King County population projected at +44% by 2050 — long-run rental-demand tailwind backs the buy-and-hold thesis.
- At projected returns (-3.0% appreciation + 1.5% rent growth), your $22k cash investment doubles in ~3 years — after that, you're playing with house money.
Negotiation context
- It's been on market 51 days — a 3% lower offer ($77k) is reasonable based on typical stale-listing flexibility.
- 3 sale attempts since 16y ago; this cycle's ask has dropped $6k (6%) from the opening price — seller is motivated, your offer sets the floor, not the list.
- Current owner paid $18k; list at $80k implies a 354% gain — meaningful room to come down on a strong offer.
Risks & watch-outs
- Climate carrying-cost: major flood risk — expect insurance premiums to compound above CPI over the hold.
Questions for the listing agent
- It's been on market 51 days. Have you received any prior offers? Is the seller open to a 3% concession, seller financing, or rate buy-down credit?
- Is there a deadline driving the sale (1031 exchange, divorce, estate, relocation)? That informs how much negotiation room exists.
- Crime grade is F in this area — have there been break-ins, vandalism, or insurance claims at this property in the last 3 years? What carrier currently insures it and at what premium?
- What's the average days-on-market for RENTAL listings here right now (not sales)? A rising rental-DOM trend means longer vacancies and softer asking-rent achievability than the comps imply.
- What's the recent tenant-quality profile in this submarket — average credit score on applications, eviction rate, late-payment / NSF rate, and stable-employment percentage? A property-management company in the area should have these aggregated.
- How much new for-sale + rental construction is in the pipeline within 1–3 miles? Heavy new supply typically softens prices + rents 12–24 months out; constrained supply supports both.
Investment metrics
- 1% rule
- 2.45% ✓
- Cap rate
- 21.24%
- Cash-on-cash
- 53.38%
- DSCR
- 3.38
- GRM
- 3.4
CMA / ARV
- ARV (on-the-fly)
- $99,840
- Comps found
- 11
Show comp detail 11 sales within ~0.75 mi
| Address | Dist | Beds/Ba | Sqft | Sold | Price | $/sf | Match |
|---|---|---|---|---|---|---|---|
| 1402 22nd St NE #424 | 0.00mi | 2/2.0 | 1,248 (0%) | 1mo | $124,500 | $100 | 99 |
| 1402 22ND St NE #39 | 0.00mi | 2/2.0 | 1,248 (0%) | 11mo | $158,000 | $127 | 91 |
| 1402 22nd St NE #222 | 0.02mi | 2/2.0 | 1,248 (0%) | 12mo | $90,000 | $72 | 89 |
| 1402 22nd St NE #11 | 0.00mi | 2/2.0 | 1,368 (+10%) | 2mo | $60,000 | $44 | 82 |
| 1402 22nd St NE #428 | 0.00mi | 2/2.0 | 1,344 (+8%) | 11mo | $140,000 | $104 | 78 |
| 1402 22nd St NE #27 | 0.25mi | 2/2.0 | 1,344 (+8%) | 0mo | $65,000 | $48 | 75 |
| 1402 22nd St NE #233 | 0.38mi | 2/2.0 | 1,248 (0%) | 9mo | $90,000 | $72 | 75 |
| 1402 22nd St NE #127 | 0.37mi | 2/2.0 | 1,320 (+6%) | 4mo | $137,500 | $104 | 70 |
| 1402 22nd St NE #315 | 0.00mi | 2/2.0 | 1,344 (+8%) | 23mo | $118,000 | $88 | 68 |
| 1402 22nd St NE #220 | 0.37mi | 2/2.0 | 1,248 (0%) | 24mo | $100,000 | $80 | 63 |
| 1402 22nd St NE #455 | 0.38mi | 2/2.0 | 1,344 (+8%) | 18mo | $107,200 | $80 | 54 |
Match score weights: distance 35% · size 25% · config 20% · recency 20%. Top-matched comps best support the ARV.
Projected returns pro-forma
-3.0% appreciation · 1.51% rent growth · sell at horizon
- IRR
- 49.8%
- Equity multiple
- 3.13×
- Total profit
- $47,335
- Equity at exit
- $11,854
- IRR
- 54.6%
- Equity multiple
- 5.99×
- Total profit
- $111,081
- Equity at exit
- $6,874
Cash invested: $22,260 (down + closing). Projections, not guarantees.
Landlord ↔ Tenant lean methodology
- Overall (STATE)
- 28 Tenant-Leaning
- State Washington
- 28 Tenant-Leaning · D+8
- County
- — inherits STATE
- City
- — inherits STATE
ZIP-level market 98002
- Rents YoY
- 1.5%
- Active inventory
- 171
- Price-to-rent
- 3.4×
Monthly cashflow live
- Estimated rent
- $1,949 high interval (Pro) →
- Mortgage (P&I)
- −$417
- Tax est. 1.5%
- −$99 /mo · $1,192/yr
- Insurance
- −$33
- HOA
- −$0
- Vacancy / Maint / Mgmt
- −$409
- Net cashflow
- $990
Break-even live
UW: 25.0% down · 7.5% · 30yr · 1.5% tax · 5.0% vac · 8.0% maint · 8.0% mgmt
Financing live
Cash to close
- Down payment
- $19,875
- Closing costs
- $2,385
- Reserves months
- —
- Total cash needed
- —
Loan-product check · same deal, 3 products live
Conventional
25% down · 7.5% · 30yr
- Down + closing
- —
- Monthly P&I
- —
- Monthly cashflow
- —
- DSCR
- —
- Eligible?
- —
Personal DTI + credit; lowest rate.
DSCR
20% down · 8.5% · 30yr
- Down + closing
- —
- Monthly P&I
- —
- Monthly cashflow
- —
- DSCR
- —
- Eligible?
- —
No personal income docs; deal must DSCR.
Hard money
10% down · 12.0% · 12mo
- Down + closing
- —
- Monthly P&I
- —
- Monthly cashflow
- —
- DSCR
- —
- Eligible?
- —
Short-term bridge; refi at stabilization.
Rent comps 36 comps
| Address | Beds | Baths | Sqft | Rent | $/sqft | DOM | Units | Dist |
|---|---|---|---|---|---|---|---|---|
| 2212 O St NE Unit D Auburn, WA | 3.0 | 1.0 | 1000 | $1,925 | $1.93 | 21d | 1 | 0.07mi |
| 2025 M St NE Unit 2045 Auburn, WA | 2.0 | 1.5 | 1248 | $2,095 | $1.68 | 21d | 1 | 0.13mi |
| 2222 L St NE Unit 2222LA Auburn, WA | 2.0 | 1.0 | 895 | $1,995 | $2.23 | 2d | 1 | 0.16mi |
| 2409 N St NE Auburn, WA | 2.0 | 1.0 | 900 | $1,950 | $2.17 | 14d | 1 | 0.17mi |
| 2414 N St NE Unit C Auburn, WA | 3.0 | 1.0 | 1271 | $1,950 | $1.53 | 24d | 1 | 0.18mi |
| 2315 L St NE Unit 2315LA Auburn, WA | 2.0 | 1.0 | 990 | $1,995 | $2.02 | 2d | 1 | 0.22mi |
| 2319 L St NE Unit 2319LB Auburn, WA | 2.0 | 1.0 | 895 | $1,995 | $2.23 | 2d | 1 | 0.23mi |
| 2502 M St NE Unit 2502MA Auburn, WA | 2.0 | 1.0 | 910 | $2,050 | $2.25 | 2d | 1 | 0.23mi |
| 1015 18th St NE Unit 931 935 1001 1007 Auburn, WA | 2.0 | 1.0 | 900 | $1,699 | $1.89 | 24d | 1 | 0.25mi |
| 1741 22nd St NE Auburn, WA | 1.0–3.0 | 1.0–2.0 | 902 | $1,650 | $1.83 | 2d | 2 | 0.26mi |
| 2545 M Pl NE Unit 2545MPC Auburn, WA | 2.0 | 1.0 | 1000 | $1,895 | $1.90 | 24d | 1 | 0.27mi |
| 2556 M Pl NE Unit 2556MPC Auburn, WA | 2.0 | 1.0 | 1000 | $1,895 | $1.90 | 19d | 1 | 0.28mi |
| 2602 J St NE Auburn, WA | 2.0 | 1.0 | 897 | $1,972 | $2.20 | 3d | 10 | 0.37mi |
| 802 22nd St NE Unit 802 Auburn, WA | 2.0 | 1.0 | 750 | $1,585 | $2.11 | 12d | 1 | 0.38mi |
| 2317 I St NE Unit 2319 Auburn, WA | 3.0 | 2.0 | 1400 | $2,275 | $1.62 | 24d | 1 | 0.41mi |
| 987 26th Pl NE Auburn, WA | 2.0 | 1.5 | 939 | $1,795 | $1.91 | 24d | 1 | 0.42mi |
| 2701 J St NE Unit 2701JB Auburn, WA | 2.0 | 1.0 | 800 | $2,050 | $2.56 | 24d | 1 | 0.42mi |
| 2441 I St NE Auburn, WA | 2.0 | 1.0 | 910 | $1,795 | $1.97 | 14d | 1 | 0.43mi |
| 1413 12th St NE Unit ADU Auburn, WA | 3.0 | 1.0 | 1000 | $2,400 | $2.40 | 5d | 1 | 0.49mi |
| 1433 8th St NE Auburn, WA | 1.0–3.0 | 1.0–1.5 | 1025 | $2,244 | $2.19 | 1d | 13 | 0.69mi |
| 31900 104th Ave SE Unit A206 Auburn, WA | 2.0 | 1.5 | 1250 | $2,000 | $1.60 | 24d | 1 | 0.72mi |
| 1608 8th St NE Auburn, WA | 2.0 | 1.0 | 809 | $1,500 | $1.85 | 10d | 1 | 0.78mi |
| 634 M St NE Unit 3 Auburn, WA | 2.0 | 1.5 | 900 | $1,650 | $1.83 | 24d | 1 | 0.82mi |
| 1314 6th Pl NE Auburn, WA | 3.0 | 1.5 | 1180 | $3,200 | $2.71 | 24d | 1 | 0.84mi |
| 511 M St NE Auburn, WA | 2.0 | 1.0 | 742 | $1,695 | $2.28 | 5d | 1 | 0.92mi |
| 502 8th St NE Auburn, WA | 1.0–2.0 | 1.0 | 687 | $1,795 | $2.61 | 2d | 3 | 0.96mi |
| 1221 A St NE Auburn, WA | 1.0–2.0 | 1.0–2.0 | 741 | $1,986 | $2.68 | 1d | 14 | 0.96mi |
| 1107 A St NE Auburn, WA | 1.0–2.0 | 1.0 | 654 | $2,022 | $3.09 | 2d | 26 | 1.00mi |
| 29 R St NE Unit A Auburn, WA | 2.0 | 1.0 | 900 | $1,695 | $1.88 | 24d | 1 | 1.17mi |
| 421 3rd St NE Auburn, WA | 2.0 | 1.0 | 870 | $1,600 | $1.84 | 12d | 1 | 1.21mi |
| 515 N Division St Auburn, WA | 1.0–2.0 | 1.0 | 700 | $1,750 | $2.50 | 24d | 4 | 1.27mi |
| 44 5th St NE Apt 4 Auburn, WA | 3.0 | 1.0 | 1000 | $1,999 | $2.00 | 24d | 1 | 1.29mi |
| 107 N St SE Unit A Auburn, WA | 2.0 | 1.0 | 1080 | $1,750 | $1.62 | 21d | 1 | 1.32mi |
| 225 I St SE Unit 225 Auburn, WA | 2.0 | 1.0 | 980 | $2,100 | $2.14 | 14d | 1 | 1.47mi |
| 24 Auburn Way S Auburn, WA | 2.0 | 1.0 | 1000 | $1,495 | $1.50 | 24d | 1 | 1.47mi |
| 128 E Main St Auburn, WA | 2.0 | 1.0–2.0 | 680 | $2,425 | $3.56 | 5d | 6 | 1.50mi |
Listing history 18 events
-
2026-06-01status $79,500 Pending 51 DOM
-
2026-05-31days on market $79,500 Active 51 DOM
-
2026-05-11price $79,500
-
2026-04-10$85,000 Active
-
2015-05-10historical
-
2015-05-08soldstatus $17,500 Sold
-
2015-03-20status Pending
-
2015-03-06status Pending Inspection
-
2015-02-25status Pending
-
2015-01-31price $19,500
-
2014-12-19price $23,500
-
2014-10-17price $29,900
-
2014-09-01$34,500 Active
-
2010-09-13soldstatus $33,000 Sold
-
2010-08-26status Pending
-
2010-08-25status Pending Inspection
-
2010-05-20price $34,900
-
2010-05-20$32,900 Active
ⓘ Source: listings_history table (triggers on properties + properties_extension) + one-shot
backfill from property_details.listing_events for pre-trigger history.
Climate risk First Street
- Flood 6/10 Major FEMA zone X (unshaded) · 27% chance over 30 yrs
- Wildfire 1/10 Low
- Heat 4/10 Moderate 7 d/yr ≥87°F today · 16 d/yr by 30 yrs out
- Wind 1/10 Low
- Air quality 7/10 Severe 10 unhealthy d/yr today · 11 by 30 yrs out
Nearby sold comps map
Loading sold comps map…
Walkable amenities ~0.75 mi
Loading nearby amenities…
Taxation est. · year 1
- Rental income
- $23,387
- − Mortgage interest
- −$4,453
- − Property taxes
- −$1,192
- − Insurance
- −$398
- − Repairs & maintenance
- −$1,871
- − Management
- −$1,871
- − Depreciation
- −$2,313
- Taxable income
- $11,289
- Est. tax owed @ 24.0%
- −$2,709
- After-tax cash flow
- $9,173/yr
For passive investors: Depreciation is non-cash, so a rental often shows a tax loss while cash-flowing — sheltering income. Rental losses are passive: they offset passive income freely, and up to $25,000/yr can offset ordinary (W-2) income if you actively participate and your MAGI is under $100k (phasing out to $0 by $150k); unused losses carry forward. On sale, claimed depreciation is recaptured at up to 25%, and gains may owe capital-gains tax (a 1031 exchange can defer both). Figures are a year-1 estimate at your 24.0% rate — not tax advice; consult a CPA.
Schools (NCES district)
- District
- Auburn School District
- NCES district ID
- 5300300
- Math proficiency
- 47% ▼ -3.00%
- Reading proficiency
- 56% ▼ -1.00%
- Median HH income
- $58,048
- Composite
- 46.73/100
- National rank
- #5240
- State rank
- #125 of 291 in WA
Livability — Auburn
- Score
- 81/100
- State rank
- #75
- US rank
- #1371
Category grades
Schools grade is shown separately in the Schools card above.
Census & demographics
- Census place
- Auburn, WA
- County
- King County · 2,251,916 people
- City population
- 74,969
- Metro
- Seattle-Tacoma-Bellevue, WA
- Population (ZIP)
- 37,509
- Household income
- $78,684
- Rent vs Own
- Severe rent burden
- 2202.0
Population outlook (King County) Hauer SSP2
- Today (2025)
- 2,576,485 people
- By 2030
- 2,803,316 · +8.8%
- By 2040
- 3,255,921 · +26.4%
- By 2050
- 3,706,444 · +43.9%
- By 2075
- 4,746,063 · +84.2%
- By 2100
- 5,407,730 · +109.9%
Race, ethnicity, and origin ACS 2023
- Neighborhood character
- Highly diverse neighborhood (Simpson 0.72)
- Race & ethnicity
- White 46% Hispanic / Latino 24% Two or more races 13% Black 12% Asian 6% Pacific Islander 4% Native American 2%
- Hispanic origin (detail)
- Mexican 20%
- Common ancestry
- Portuguese 4% Subsaharan African 4% Lithuanian 3%
- Foreign-born
- 24% · Canada, Vietnam
- Languages at home
- 63% English-only · Spanish 19% Russian/Polish/Slavic 6% Other Asian/Pacific 3%
Political lean MEDSL · King
- 2024 margin
- Solid D (+51.7) · D 74.2% · R 22.5% · Other 3.4%
- 2008→2024 swing
- +9.6pp toward D · 2008: 42.1pp · 2024: 51.7pp
- All cycles
- 2024: D+51.7 2020: D+52.7 2016: D+50.4 2012: D+39.9 2008: D+42.1
Not yet ingested
- Civics
- —
Market trends
- HPI YoY
- ▼ -677.96%
- Current HPI
- 298.0849
- Rent YoY
- ▲ 1.51%
- Metro
- Seattle-Tacoma-Bellevue, WA
- State GDP YoY
- ▲ 4.65%
- F500 in state
- 22
Industry mix (Fortune 500 HQ in WA)
| Industry | F500 HQs | Revenue |
|---|---|---|
| Retail | 2 | $269B |
|
||
| Technology / Retail | 1 | $638B |
|
||
| Technology | 1 | $245B |
|
||
| Telecommunications | 1 | $38B |
|
||
| Food / Beverage | 1 | $36B |
|
||
| Automotive / Trucks | 1 | $34B |
|
||
Price history
+141.6% since first listed16 events — show timeline
- 2026-05-11 Price Changed $79,500 NWMLS as Distributed by MLS Grid
- 2026-04-10 Listed $85,000 NWMLS as Distributed by MLS Grid
- 2015-05-10 Delisted — NWMLS as Distributed by MLS Grid
- 2015-05-08 Sold (MLS) $17,500 NWMLS as Distributed by MLS Grid
- 2015-03-20 Pending — NWMLS as Distributed by MLS Grid
- 2015-03-06 Pending — NWMLS as Distributed by MLS Grid
- 2015-02-25 Pending — NWMLS as Distributed by MLS Grid
- 2015-01-31 Price Changed $19,500 NWMLS as Distributed by MLS Grid
- 2014-12-19 Price Changed $23,500 NWMLS as Distributed by MLS Grid
- 2014-10-17 Price Changed $29,900 NWMLS as Distributed by MLS Grid
- 2014-09-01 Listed $34,500 NWMLS as Distributed by MLS Grid
- 2010-09-13 Sold (MLS) $33,000 NWMLS as Distributed by MLS Grid
- 2010-08-26 Pending — NWMLS as Distributed by MLS Grid
- 2010-08-25 Pending — NWMLS as Distributed by MLS Grid
- 2010-05-20 Price Changed $34,900 NWMLS as Distributed by MLS Grid
- 2010-05-20 Listed $32,900 NWMLS as Distributed by MLS Grid
Cash-flow waterfall
monthlySold comps — $/sqft
last 12 mo · ≤1 miLoading sold comps…