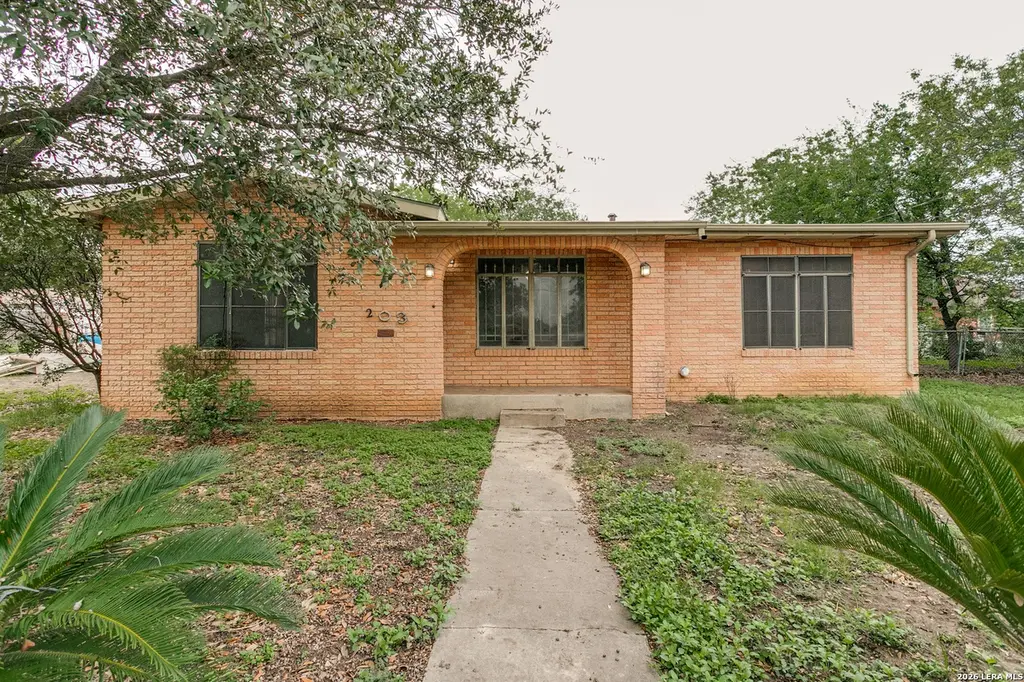
203 Paul St · San Antonio, TX
Flood risk 1/10 · Minimal
- FEMA flood zone
- X (unshaded)
- Chance of flooding over 30 yrs
- 0.0%
- Est. flood insurance / yr
- $507 – $1,088
Fire risk 1/10 · Minimal
- Est. fire insurance / yr
- $1,222 – $2,270
Heat risk 8/10 · Major
- Hot days now (above 108°F)
- 7 days/yr
- Hot days in 30 yrs
- 20 days/yr
Wind risk 8/10 · Major
- Chance of severe wind over 30 yrs
- 80.0%
Air-quality risk 2/10 · Minimal
- Unhealthy air days now
- 1 days/yr
- Unhealthy air days in 30 yrs
- 2 days/yr
Risk factors via First Street. Map © Google.
Why this score? — see what drove the B grade
The composite is a weighted blend of 9 inputs, each scored 0–100. Each bar is that input's sub-score; the figure is the points it added to the 100-point composite (weight × sub-score).
- Cash flow +23.6/30.0
- ARV discount +15.0/15.0
- DSCR +7.6/10.0
- 1% rule +6.6/10.0
- Appreciation +5.7/10.0
- Rent growth +5.0/5.0
- Livability +4.0/5.0
- Condition / age +2.5/5.0
- Schools +1.4/10.0
$160,000
🖨 Deal sheet (PDF) 📄 Offer letter ✓ Due diligence
Listing remarks
Investment Opportunity! 3BR/2BA home with 1,334 sqft on a 0.165-acre corner lot next to downtown San Antonio. Positioned as an investment property with value-add potential, suitable for renovation or Buyers seeking a Primary Residence with Potential for Updates. New roof installed in 2025. Existing layout includes 3 bedrooms and 2 bathrooms, offering flexibility for interior updates, reconfiguration, or expansion subject to buyer verification. Fenced yard with mature trees provides usable outdoor space and defined lot boundaries. Corner lot placement allows for multiple access points, site planning flexibility, and potential for additional improvements. Lot size of approximately 0.165 acres
Key facts
- Fenced yard
- Corner lot
- Mature trees
Tags
Property features AI
Finance
- Other: Possession at closing/funding; For sale (not a short sale)
- HOA & community: Subdivision: COMMERCE TO MLK DENVER HTS SOU
Exterior
- Utilities: City water and sewer
- Home design: Pre-owned property; Composition roof; Slab foundation; Approximately 71 years old
- Construction: Brick construction; Composition roof; Slab foundation; Built about 71 years ago
- Exterior features: Corner lot; Chain link fence; Brick exterior
Interior
- Kitchen: Stove/Range; Kitchen approx. 14 x 8
- Bedrooms: Master bedroom on lower level (14 x 12); Bedroom 2 (14 x 12); Bedroom 3 (14 x 12)
- Flooring: Carpeting; Ceramic tile
- Bathrooms: Two full bathrooms; Master bath with tub/shower combination (6 x 12)
- Heating & cooling: Central heating (electric); Central air conditioning
- Interior features: Ceiling fans; Some window coverings remain; Living/dining room combination; One living area
- Laundry & utility: Washer connection; Dryer connection
Neighborhood map
What this means for you Summary
Snapshot
- This is a 3-bed/2.0-bath single-family listed at $160k.
Deal economics
- At list price, monthly cash flow is $301 ($4k/yr) — positive.
- The deal already cash-flows at list — no discount required.
- Meets the 1% rule at list price ($2k rent vs $160k).
- Recommended offer: $155k (3.0% below list) — sets the bar for market timing.
- Cap rate 8.6% vs local median 3.8% in San Antonio — top-decile yield for the area; either an underpriced asset or a hidden risk that comps aren't pricing in. Stress-test before assuming the spread holds.
Location & tenants
- Location reads 80/100 on livability (#31 in TX, #1,616 nationally) — a professional / high-income tenant draw. Strengths: amenities A+, commute A+, cost of living A+; Watch: crime F.
- San Antonio ISD (urban): math 12% / reading 22% proficiency, ranked #805 of 826 in TX (top 98%) — low school quality limits family demand, transient renter base, plan for 1-2y turnover; 80% free/reduced lunch — lower-income household profile, screen leases tightly.
- Zoned schools: Herff El (math 16% / reading 25%, grade F, #3,515 of 4,322 statewide, top 82%, 277 students, 97% FRL); Brackenridge H S (math 12% / reading 25%, grade F, #1,436 of 1,632 statewide, top 88%, 1,568 students, 88% FRL).
- Market conditions: Rents rising fast (+10.9%/yr); 99 active listings in the ZIP; 40 comparable units currently listed for rent nearby; rentals at typical pace (median 25d on market — plan ~3-4 weeks tenant-placement turnaround); lower-income renter base — watch delinquency; 8,308 units permitted in Bexar County in 2024 (2,506 in 5+ unit buildings).
- At $1,849/mo this rent would consume 62% of the median local household income ($36k/yr) (locally 470% of renters already pay >50% of income on rent) — very limited rent-growth headroom before tenants either downsize or default.
Forward outlook
- In year one you build about $3k of equity ($1k loan paydown + $2k appreciation (1.3% local appreciation)).
- Bexar County population projected at +50% by 2050 — long-run rental-demand tailwind backs the buy-and-hold thesis.
- At projected returns (1.3% appreciation + 8.0% rent growth), your $45k cash investment doubles in ~5 years — after that, you're playing with house money.
- By year 10, paydown + projected appreciation supports a ~$33k cash-out refi (75% LTV) — recoverable capital for the next deal without selling this one.
Negotiation context
- It's been on market 48 days — a 3% lower offer ($155k) is reasonable based on typical stale-listing flexibility.
Risks & watch-outs
- Watch-outs: built in 1955 — expect roof / HVAC / electrical / plumbing capex.
- Climate carrying-cost: severe wind risk, 80% chance of damaging wind over 30y; extreme-heat days projected 7→20/yr by 2055 (HVAC capex compounding) — expect insurance premiums to compound above CPI over the hold.
Questions for the listing agent
- It's been on market 48 days. Have you received any prior offers? Is the seller open to a 3% concession, seller financing, or rate buy-down credit?
- Built in 1955 — when were the roof, HVAC, electrical panel, plumbing, and water heater last replaced?
- Is there a deadline driving the sale (1031 exchange, divorce, estate, relocation)? That informs how much negotiation room exists.
- Crime grade is F in this area — have there been break-ins, vandalism, or insurance claims at this property in the last 3 years? What carrier currently insures it and at what premium?
- What's the average days-on-market for RENTAL listings here right now (not sales)? A rising rental-DOM trend means longer vacancies and softer asking-rent achievability than the comps imply.
- What's the recent tenant-quality profile in this submarket — average credit score on applications, eviction rate, late-payment / NSF rate, and stable-employment percentage? A property-management company in the area should have these aggregated.
- How much new for-sale + rental construction is in the pipeline within 1–3 miles? Heavy new supply typically softens prices + rents 12–24 months out; constrained supply supports both.
Investment metrics
- 1% rule
- 1.16% ✓
- Cap rate
- 8.55%
- Cash-on-cash
- 8.07%
- DSCR
- 1.36
- GRM
- 7.2
CMA / ARV
- ARV (median comp)
- $259,203
- List price
- $160,000
- Delta
- -38.27%
- Verdict
- UNDERPRICED
- Comps
- 20 within 1.0 mi
Show comp detail 12 sales within ~0.75 mi
| Address | Dist | Beds/Ba | Sqft | Sold | Price | $/sf | Match |
|---|---|---|---|---|---|---|---|
| 828 Virginia Blvd | 0.35mi | 3/2.0 | 1,347 (+1%) | 4mo | $175,000 | $130 | 78 |
| 517 S Pine St | 0.19mi | 3/2.0 | 1,232 (-8%) | 5mo | $239,000 | $194 | 74 |
| 802 Piedmont Ave | 0.34mi | 3/2.0 | 1,296 (-3%) | 6mo | $249,000 | $192 | 74 |
| 512 Nevada St | 0.38mi | 3/1.0 | 1,332 (-0%) | 6mo | $150,000 | $113 | 73 |
| 231 Nelson | 0.50mi | 3/2.0 | 1,228 (-8%) | 3mo | $243,900 | $199 | 61 |
| 1048 Gibbs | 0.67mi | 3/2.0 | 1,280 (-4%) | 1mo | $249,000 | $195 | 61 |
| 219 Nelson Ave | 0.48mi | 4/2.0 (+1) | 1,424 (+7%) | 4mo | $249,000 | $175 | 58 |
| 223 Porter | 0.65mi | 4/2.0 (+1) | 1,383 (+4%) | 2mo | $134,900 | $98 | 57 |
| 403 N Palmetto | 0.60mi | 3/2.0 | 1,443 (+8%) | 2mo | $375,000 | $260 | 56 |
| 229 Nelson Ave | 0.49mi | 2/2.0 (-1) | 1,200 (-10%) | 3mo | $275,000 | $229 | 53 |
| 411 S Gevers | 0.66mi | 3/2.0 | 1,147 (-14%) | 2mo | $210,000 | $183 | 44 |
| 621 Center St | 0.57mi | 3/2.5 | 1,515 (+14%) | 6mo | $389,500 | $257 | 44 |
Match score weights: distance 35% · size 25% · config 20% · recency 20%. Top-matched comps best support the ARV.
Projected returns pro-forma
1.34% appreciation · 8.0% rent growth · sell at horizon
- IRR
- 14.3%
- Equity multiple
- 1.77×
- Total profit
- $34,658
- Equity at exit
- $57,433
- IRR
- 20.7%
- Equity multiple
- 3.97×
- Total profit
- $132,952
- Equity at exit
- $78,547
Cash invested: $44,800 (down + closing). Projections, not guarantees.
Landlord ↔ Tenant lean methodology
- Overall (STATE)
- 87 Strongly Landlord-Friendly
- State Texas
- 87 Strongly Landlord-Friendly · R+5
- County
- — inherits STATE
- City
- — inherits STATE
ZIP-level market 78203
- Home prices YoY
- 0.5%
- Rents YoY
- 10.9%
- Active inventory
- 99
- Price-to-rent
- 7.2×
Monthly cashflow live
- Estimated rent
- $1,849 high interval (Pro) →
- Mortgage (P&I)
- −$839
- Tax from tax record
- −$253 /mo · $3,040/yr
- Insurance
- −$67
- HOA
- −$0
- Vacancy / Maint / Mgmt
- −$388
- Net cashflow
- $301
Break-even live
Sensitivity live
| Price | -10% $392 | -5% $347 | +0% $301 | +5% $256 | +10% $211 |
|---|---|---|---|---|---|
| Rent | -10% $155 | -5% $228 | +0% $301 | +5% $374 | +10% $447 |
| Rate | -1.0pp $382 | -0.5pp $342 | base $301 | +0.5pp $260 | +1.0pp $218 |
UW: 25.0% down · 7.5% · 30yr · 1.5% tax · 5.0% vac · 8.0% maint · 8.0% mgmt
Financing live
Cash to close
- Down payment
- $40,000
- Closing costs
- $4,800
- Reserves months
- —
- Total cash needed
- —
Loan-product check · same deal, 3 products live
Conventional
25% down · 7.5% · 30yr
- Down + closing
- —
- Monthly P&I
- —
- Monthly cashflow
- —
- DSCR
- —
- Eligible?
- —
Personal DTI + credit; lowest rate.
DSCR
20% down · 8.5% · 30yr
- Down + closing
- —
- Monthly P&I
- —
- Monthly cashflow
- —
- DSCR
- —
- Eligible?
- —
No personal income docs; deal must DSCR.
Hard money
10% down · 12.0% · 12mo
- Down + closing
- —
- Monthly P&I
- —
- Monthly cashflow
- —
- DSCR
- —
- Eligible?
- —
Short-term bridge; refi at stabilization.
Rent comps 40 comps
| Address | Beds | Baths | Sqft | Rent | $/sqft | DOM | Units | Dist |
|---|---|---|---|---|---|---|---|---|
| 850 Nevada St Unit NA San Antonio, TX | 2.0 | 1.0 | 1345 | $1,795 | $1.33 | 14d | 1 | 0.04mi |
| 207 Gravel St Unit 102 San Antonio, TX | 3.0 | 2.5 | 1394 | $1,800 | $1.29 | 25d | 1 | 0.14mi |
| 313 Toledo San Antonio, TX | 2.0 | 1.0 | 924 | $1,400 | $1.52 | 12d | 1 | 0.16mi |
| 316 Toledo St Unit 102 San Antonio, TX | 2.0 | 2.0 | 1168 | $2,200 | $1.88 | 45d | 1 | 0.17mi |
| 109 Gravel St San Antonio, TX | 3.0 | 1.0 | 900 | $1,250 | $1.39 | 25d | 1 | 0.17mi |
| 1419 Wyoming St San Antonio, TX | 2.0 | 1.0 | 1232 | $1,550 | $1.26 | 5d | 1 | 0.17mi |
| 1205 Wyoming St San Antonio, TX | 2.0 | 2.0 | 1114 | $2,300 | $2.06 | 45d | 1 | 0.20mi |
| 210 Piedmont Ave Unit 101 San Antonio, TX | 2.0 | 2.5 | 1050 | $1,395 | $1.33 | 45d | 1 | 0.22mi |
| 802 Montana St Unit 2 San Antonio, TX | 3.0 | 1.0 | 1440 | $1,500 | $1.04 | 12d | 1 | 0.24mi |
| 415 S Olive St San Antonio, TX | 3.0 | 2.0 | 1348 | $2,600 | $1.93 | 45d | 1 | 0.24mi |
| 811 Montana St Unit 1301 San Antonio, TX | 2.0 | 2.0 | 1240 | $1,800 | $1.45 | 45d | 1 | 0.26mi |
| 630 Montana St Unit 301 San Antonio, TX | 2.0 | 2.0 | 1320 | $2,250 | $1.70 | 16d | 1 | 0.27mi |
| 218 S Olive St #2101 San Antonio, TX | 3.0 | 3.5 | 1800 | $3,199 | $1.78 | 45d | 1 | 0.27mi |
| 718 S Pine St San Antonio, TX | 2.0 | 2.0 | 1213 | $1,650 | $1.36 | 5d | 1 | 0.27mi |
| 732 S Pine St Unit 1 San Antonio, TX | 3.0 | 2.0 | 1371 | $1,650 | $1.20 | 45d | 1 | 0.30mi |
| 231 Cactus St San Antonio, TX | 2.0 | 1.0 | 876 | $1,195 | $1.36 | 25d | 1 | 0.30mi |
| 721 S Pine St San Antonio, TX | 2.0 | 1.0 | 1016 | $1,245 | $1.23 | 25d | 1 | 0.31mi |
| 803 Piedmont Ave San Antonio, TX | 3.0 | 1.0 | 1000 | $1,350 | $1.35 | 45d | 1 | 0.31mi |
| 1138 Iowa St San Antonio, TX | 3.0 | 2.0 | 1505 | $1,650 | $1.10 | 25d | 1 | 0.33mi |
| 104 Shenandoah San Antonio, TX | 3.0 | 2.5 | 1580 | $1,925 | $1.22 | 19d | 1 | 0.34mi |
| 419 Cactus St Unit 102 San Antonio, TX | 2.0 | 1.5 | 1091 | $1,750 | $1.60 | 45d | 1 | 0.39mi |
| 807 Dreiss St San Antonio, TX | 3.0 | 2.0 | 1200 | $2,095 | $1.75 | 25d | 1 | 0.39mi |
| 211 Utah St #601 San Antonio, TX | 2.0 | 2.5 | 1208 | $1,650 | $1.37 | 45d | 1 | 0.42mi |
| 603 S Mesquite St San Antonio, TX | 3.0 | 2.5 | 1333 | $1,750 | $1.31 | 23d | 1 | 0.42mi |
| 431 S Mesquite St San Antonio, TX | 3.0 | 2.0 | 1220 | $1,750 | $1.43 | 17d | 1 | 0.43mi |
| 610 Virginia Blvd Unit 2 San Antonio, TX | 3.0 | 1.0 | 1722 | $1,150 | $0.67 | 5d | 1 | 0.43mi |
| 136 Nelson Ave San Antonio, TX | 3.0 | 1.0 | 1092 | $1,316 | $1.21 | 45d | 1 | 0.43mi |
| 210 Utah St #101 San Antonio, TX | 3.0 | 2.5 | 1208 | $1,695 | $1.40 | 45d | 1 | 0.45mi |
| 723 Paso Hondo San Antonio, TX | 3.0 | 1.0 | 1224 | $1,500 | $1.23 | 45d | 1 | 0.49mi |
| 704 Cuney Way San Antonio, TX | 4.0 | 2.0 | 1528 | $2,600 | $1.70 | 25d | 1 | 0.49mi |
| 113 Dilworth St San Antonio, TX | 3.0 | 3.0 | 1383 | $1,850 | $1.34 | 25d | 1 | 0.49mi |
| 123 Dilworth St San Antonio, TX | 3.0 | 2.0 | 1384 | $1,900 | $1.37 | 45d | 1 | 0.51mi |
| 1618 Dakota St Unit 102 San Antonio, TX | 3.0 | 2.5 | 1768 | $1,925 | $1.09 | 17d | 1 | 0.52mi |
| 521 S Polaris St San Antonio, TX | 3.0 | 1.0 | 1200 | $1,249 | $1.04 | 5d | 1 | 0.53mi |
| 1022 Delaware St Unit 3 San Antonio, TX | 3.0 | 2.5 | 1244 | $1,800 | $1.45 | 0d | 1 | 0.53mi |
| 1021 S Hackberry St Unit 201 San Antonio, TX | 3.0 | 3.5 | 1747 | $2,950 | $1.69 | 45d | 1 | 0.56mi |
| 620 Potomac San Antonio, TX | 2.0 | 1.0 | 900 | $1,050 | $1.17 | 23d | 1 | 0.61mi |
| 631 Potomac San Antonio, TX | 3.0 | 2.5 | 1844 | $1,797 | $0.97 | 25d | 1 | 0.65mi |
| 343 Porter St #101 San Antonio, TX | 3.0 | 2.5 | 1600 | $2,100 | $1.31 | 5d | 1 | 0.66mi |
| 1146 S Olive St San Antonio, TX | 2.0 | 2.0 | 1276 | $1,800 | $1.41 | 5d | 1 | 0.67mi |
Listing history 17 events
-
2026-06-21days on market $160,000 Active 48 DOM
-
2026-06-18days on market $160,000 Active 45 DOM
-
2026-06-17days on market $160,000 Active 44 DOM
-
2026-06-16days on market $160,000 Active 43 DOM
-
2026-06-15days on market $160,000 Active 42 DOM
-
2026-06-13days on market $160,000 Active 40 DOM
-
2026-06-09statusdays on market $160,000 Active 36 DOM
-
2026-06-08days on market $160,000 Price Change 35 DOM
-
2026-06-07days on market $160,000 Price Change 34 DOM
-
2026-06-04days on market $160,000 Price Change 31 DOM
-
2026-06-03days on market $160,000 Price Change 30 DOM
-
2026-06-02days on market $160,000 Price Change 29 DOM
-
2026-06-01days on market $160,000 Price Change 28 DOM
-
2026-05-31days on market $160,000 Price Change 27 DOM
-
2026-05-04$189,000 New 1402-char remark
-
2013-12-02soldstatus
-
2005-11-09soldstatus
ⓘ Source: listings_history table (triggers on properties + properties_extension) + one-shot
backfill from property_details.listing_events for pre-trigger history.
Tax reassessment forecast TX · Resets to sale price
- Current annual tax
- $3,040 · $253/mo
- Projected year-2 tax
- $3,040 · $253/mo
- Expected delta
- $0/yr ($0/mo · 0.0%)
ⓘ Screening estimate from a state-policy table — verify with the county assessor before closing.
Climate risk First Street
- Flood 1/10 Low FEMA zone X (unshaded) · 0% chance over 30 yrs
- Wildfire 1/10 Low
- Heat 8/10 Severe 7 d/yr ≥108°F today · 20 d/yr by 30 yrs out
- Wind 8/10 Severe 80% chance of damaging wind over 30 yrs
- Air quality 2/10 Low 1 unhealthy d/yr today · 2 by 30 yrs out
Nearby sold comps map
Loading sold comps map…
Walkable amenities ~0.75 mi
Loading nearby amenities…
Taxation est. · year 1
- Rental income
- $22,183
- − Mortgage interest
- −$8,962
- − Property taxes
- −$3,040
- − Insurance
- −$800
- − Repairs & maintenance
- −$1,775
- − Management
- −$1,775
- − Depreciation
- −$4,655
- Taxable income
- $1,177
- Est. tax owed @ 24.0%
- −$282
- After-tax cash flow
- $3,334/yr
For passive investors: Depreciation is non-cash, so a rental often shows a tax loss while cash-flowing — sheltering income. Rental losses are passive: they offset passive income freely, and up to $25,000/yr can offset ordinary (W-2) income if you actively participate and your MAGI is under $100k (phasing out to $0 by $150k); unused losses carry forward. On sale, claimed depreciation is recaptured at up to 25%, and gains may owe capital-gains tax (a 1031 exchange can defer both). Figures are a year-1 estimate at your 24.0% rate — not tax advice; consult a CPA.
Schools (NCES district)
- District
- San Antonio ISD
- NCES district ID
- 4838730
- Math proficiency
- 12% ▼ -21.00%
- Reading proficiency
- 22% ▼ -7.00%
- Median HH income
- $30,952
- Composite
- 13.57/100
- National rank
- #9512
- State rank
- #805 of 826 in TX
Livability — San Antonio
- Score
- 80/100
- State rank
- #31
- US rank
- #1616
Category grades
Schools grade is shown separately in the Schools card above.
Census & demographics
- Census place
- San Antonio, TX
- County
- Bexar County · 1,990,555 people
- City population
- 1,806,925
- Metro
- San Antonio-New Braunfels, TX
- Population (ZIP)
- 5,200
- Household income
- $35,536
- Rent vs Own
- Severe rent burden
- 470.0
Population outlook (Bexar County) Hauer SSP2
- Today (2025)
- 2,336,851 people
- By 2030
- 2,560,728 · +9.6%
- By 2040
- 3,020,569 · +29.3%
- By 2050
- 3,493,522 · +49.5%
- By 2075
- 4,668,459 · +99.8%
- By 2100
- 5,533,242 · +136.8%
Race, ethnicity, and origin ACS 2023
- Neighborhood character
- Predominantly Hispanic (84%)
- Race & ethnicity
- Hispanic / Latino 84% Two or more races 37% Black 8% White 7% Native American 1%
- Hispanic origin (detail)
- Mexican 67% Puerto Rican 3%
- Common ancestry
- Portuguese 2% Lithuanian 2%
- Foreign-born
- 18% · Canada
- Languages at home
- 53% English-only · Spanish 46%
Political lean MEDSL · Bexar
- 2024 margin
- Lean D (+9.8) · D 54.3% · R 44.6% · Other 1.1%
- 2008→2024 swing
- +4.2pp toward D · 2008: 5.6pp · 2024: 9.8pp
- All cycles
- 2024: D+9.8 2020: D+18.2 2016: D+13.5 2012: D+4.6 2008: D+5.6
Not yet ingested
- Civics
- —
Market trends
- HPI YoY
- ▲ 1.34%
- Current HPI
- 257.4183
- Rent YoY
- ▲ 10.86%
- Metro
- San Antonio-New Braunfels, TX
- State GDP YoY
- ▲ 3.95%
- F500 in state
- 110
Industry mix (Fortune 500 HQ in TX)
| Industry | F500 HQs | Revenue |
|---|---|---|
| Energy | 16 | $1,198B |
|
||
| Technology | 5 | $198B |
|
||
| Engineering / Construction | 4 | $72B |
|
||
| Energy Services | 3 | $60B |
|
||
| Utilities | 3 | $41B |
|
||
| Healthcare | 2 | $330B |
|
||
Price history
-15.3% since first listed4 events — show timeline
- 2026-05-30 Price Changed $160,000 LERA
- 2026-05-04 Listed $189,000 LERA
- 2013-12-02 Sold (Public Records) — Public Records
- 2005-11-09 Sold (Public Records) — Public Records
Property tax history
+5.2%/yrLatest (2025): $3,040 · +10.0% YoY. Source: county tax records.
Cash-flow waterfall
monthlySold comps — $/sqft
last 12 mo · ≤1 miLoading sold comps…