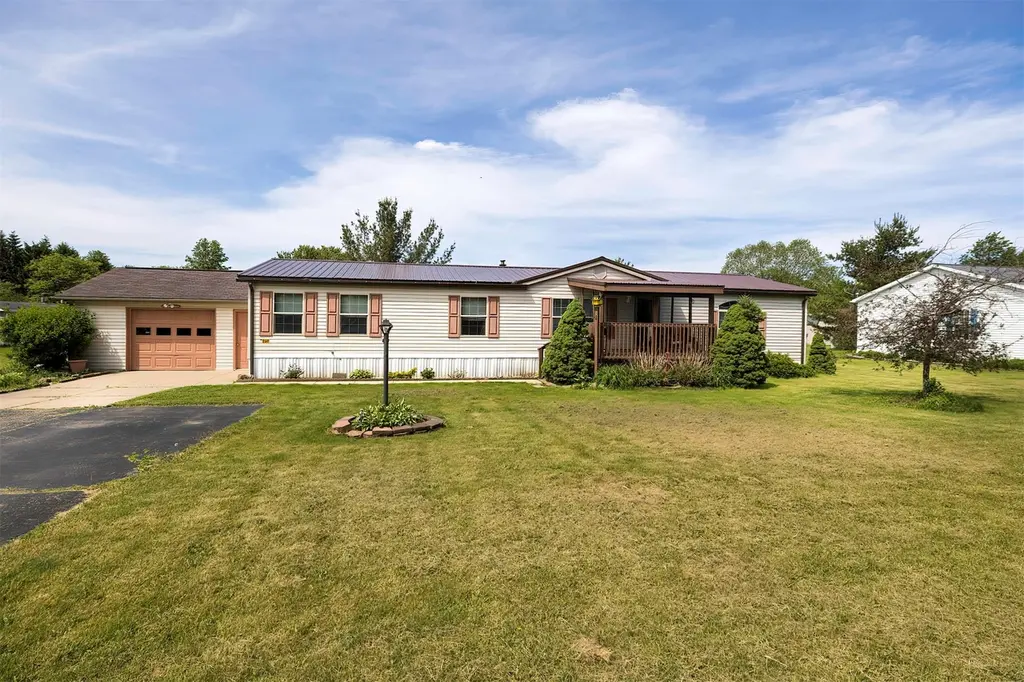
7260 Footmill Rd · Erie, PA
Flood risk 1/10 · Minimal
- FEMA flood zone
- X (unshaded)
- Chance of flooding over 30 yrs
- 0.0%
- Est. flood insurance / yr
- $473 – $860
Fire risk 1/10 · Minimal
- Est. fire insurance / yr
- $511 – $949
Heat risk 2/10 · Minimal
- Hot days now (above 89°F)
- 7 days/yr
- Hot days in 30 yrs
- 16 days/yr
Wind risk 1/10 · Minimal
- Chance of severe wind over 30 yrs
- —
Air-quality risk 4/10 · Minor
- Unhealthy air days now
- 3 days/yr
- Unhealthy air days in 30 yrs
- 7 days/yr
Risk factors via First Street. Map © Google.
Why this score? — see what drove the F grade
The composite is a weighted blend of 9 inputs, each scored 0–100. Each bar is that input's sub-score; the figure is the points it added to the 100-point composite (weight × sub-score).
- 1% rule +10.0/10.0
- Cash flow +8.0/30.0
- Schools +5.1/10.0
- Livability +4.2/5.0
- Rent growth +2.5/5.0
- Condition / age +2.5/5.0
- DSCR +2.1/10.0
- ARV discount +0.0/15.0
- Appreciation +0.0/10.0
$99,900
🖨 Deal sheet (PDF) 📄 Offer letter ✓ Due diligence
Listing remarks
Welcome home to this beautifully maintained 3-bedroom, 2-bath double-wide manufactured home featuring nearly 1,800 square feet of living space and vaulted ceilings throughout. The spacious layout offers an inviting atmosphere with plenty of room to relax and entertain. The large kitchen is the heart of the home, featuring abundant cabinet and counter space along with a center island that provides additional workspace, storage, and seating for casual meals and gatherings. A new metal roof installed in 2022 and a hot water heater installed in 2021 provide added peace of mind. Ideally situated in a highly convenient Erie location close to shopping, restaurants, I90 and everyday amenities. This
Key facts
- New metal roof
- Direct street access
- Hot water heater
Tags
Property features AI
Finance
- HOA & community: Homeowners association with monthly fee of $583 (includes water, sewer, trash)
Exterior
- Parking: Attached garage (1.5 spaces)
- Utilities: Well water; Public sewer
- Home design: Residential mobile home (double wide)
- Construction: Frame construction with vinyl siding; Asphalt and metal roof
- Exterior features: Deck; Landscaped lot; Level lot; Paved road access
Interior
- Kitchen: Dishwasher; Exhaust fan; Gas oven; Gas range; Refrigerator
- Flooring: Carpet; Vinyl
- Bathrooms: 2 full bathrooms
- Heating & cooling: Forced air heating; No cooling
- Interior features: Fireplace (1); 10 total rooms; No basement
Neighborhood map
What this means for you Summary
Snapshot
- This is a 3-bed/2.0-bath manufactured listed at $100k.
Deal economics
- At list price, monthly cash flow is $-102 ($-1k/yr) — negative.
- To cash-flow at today's rent, offer at most $82k (18.0% below list).
- Meets the 1% rule at list price ($2k rent vs $100k).
- Recommended offer: $82k (18.0% below list) — sets the bar for cash-flow.
Location & tenants
- Location reads 83/100 on livability (#109 in PA, #840 nationally) — a professional / high-income tenant draw. Strengths: amenities A+, commute A+, cost of living A+; Watch: crime D+, employment F.
- Fort Leboeuf SD (rural): math 52% / reading 68% proficiency, ranked #77 of 539 in PA (top 14%) — acceptable for families but not a draw, mixed tenant base, ~2y average lease.
- Zoned schools: Robison El Sch (math 77% / reading 82%, grade A, #49 of 1,518 statewide, top 4%, 381 students, 40% FRL); Fort Leboeuf Ms (math 38% / reading 63%, grade C, #125 of 512 statewide, top 25%, 473 students, 46% FRL); Fort Leboeuf Shs (math 72% / reading 50%, grade C+, #77 of 437 statewide, top 17%, 663 students, 45% FRL).
- Market conditions: 120 active listings in the ZIP; 364 units permitted in Erie County in 2024 (188 in 5+ unit buildings).
Forward outlook
- Local home prices are declining (-3.0%/yr); year-one equity from $691 of loan paydown is wiped out by about $3k of value loss. Plan a longer hold.
- Erie County population projected at -14% by 2050 — secular population decline; favor cash flow + early exit over multi-decade hold.
Negotiation context
- Only 7 days on market — expect competitive offers; lowballing is unlikely to land.
Risks & watch-outs
- Watch-outs: HOA is 38% of rent.
Questions for the listing agent
- What do current leases actually rent for vs. the listed asking? Can we see a recent rent roll and the last 12 months of T-12 income?
- What does the HOA fee cover, when was the last increase, and are there any pending special assessments or reserve-fund shortfalls?
- Is there a deadline driving the sale (1031 exchange, divorce, estate, relocation)? That informs how much negotiation room exists.
- Crime grade is D in this area — have there been break-ins, vandalism, or insurance claims at this property in the last 3 years? What carrier currently insures it and at what premium?
- The area grade is low — what's the realistic commute time and amenity access for the typical tenant pool here? Any planned neighborhood developments (good or bad) we should know about?
- What's the average days-on-market for RENTAL listings here right now (not sales)? A rising rental-DOM trend means longer vacancies and softer asking-rent achievability than the comps imply.
- What's the recent tenant-quality profile in this submarket — average credit score on applications, eviction rate, late-payment / NSF rate, and stable-employment percentage? A property-management company in the area should have these aggregated.
- How much new for-sale + rental construction is in the pipeline within 1–3 miles? Heavy new supply typically softens prices + rents 12–24 months out; constrained supply supports both.
Investment metrics
- 1% rule
- 1.52% ✓
- Cap rate
- 5.07%
- Cash-on-cash
- -4.37%
- DSCR
- 0.81
- GRM
- 5.5
CMA / ARV
- ARV (on-the-fly)
- $79,968
- Comps found
- 1
Show comp detail 1 sale within ~0.75 mi
| Address | Dist | Beds/Ba | Sqft | Sold | Price | $/sf | Match |
|---|---|---|---|---|---|---|---|
| 331 Holly Park Dr | 0.24mi | 3/2.0 | 1,680 (-12%) | 11mo | $70,000 | $42 | 60 |
Match score weights: distance 35% · size 25% · config 20% · recency 20%. Top-matched comps best support the ARV.
Projected returns pro-forma
-3.0% appreciation · 3.0% rent growth · sell at horizon
- IRR
- -23.1%
- Equity multiple
- 0.20×
- Total profit
- $-22,280
- Equity at exit
- $14,895
- IRR
- -16.4%
- Equity multiple
- 0.07×
- Total profit
- $-26,143
- Equity at exit
- $8,638
Cash invested: $27,972 (down + closing). Projections, not guarantees.
Landlord ↔ Tenant lean methodology
- Overall (STATE)
- 62 Landlord-Friendly
- State Pennsylvania
- 62 Landlord-Friendly · EVEN
- County
- — inherits STATE
- City
- — inherits STATE
ZIP-level market 16509
- Home prices YoY
- -30.7%
- Active inventory
- 120
- Price-to-rent
- 5.5×
Monthly cashflow live
- Estimated rent
- $1,517 medium interval (Pro) →
- Mortgage (P&I)
- −$524
- Tax from tax record
- −$152 /mo · $1,820/yr
- Insurance
- −$42
- HOA
- −$583
- Vacancy / Maint / Mgmt
- −$319
- Net cashflow
- $-102
Break-even live
Sensitivity live
| Price | -10% $-45 | -5% $-74 | +0% $-102 | +5% $-130 | +10% $-158 |
|---|---|---|---|---|---|
| Rent | -10% $-222 | -5% $-162 | +0% $-102 | +5% $-42 | +10% $18 |
| Rate | -1.0pp $-52 | -0.5pp $-76 | base $-102 | +0.5pp $-128 | +1.0pp $-154 |
UW: 25.0% down · 7.5% · 30yr · 1.5% tax · 5.0% vac · 8.0% maint · 8.0% mgmt
Financing live
Cash to close
- Down payment
- $24,975
- Closing costs
- $2,997
- Reserves months
- —
- Total cash needed
- —
Loan-product check · same deal, 3 products live
Conventional
25% down · 7.5% · 30yr
- Down + closing
- —
- Monthly P&I
- —
- Monthly cashflow
- —
- DSCR
- —
- Eligible?
- —
Personal DTI + credit; lowest rate.
DSCR
20% down · 8.5% · 30yr
- Down + closing
- —
- Monthly P&I
- —
- Monthly cashflow
- —
- DSCR
- —
- Eligible?
- —
No personal income docs; deal must DSCR.
Hard money
10% down · 12.0% · 12mo
- Down + closing
- —
- Monthly P&I
- —
- Monthly cashflow
- —
- DSCR
- —
- Eligible?
- —
Short-term bridge; refi at stabilization.
HOA detail
- Monthly dues
- $583 · $6,996/yr
- Likely covers
- water
Listing history 7 events
-
2026-06-15status $99,900 Pending 7 DOM
-
2026-06-15days on market $99,900 Active 7 DOM
-
2026-06-14days on market $99,900 Active 5 DOM
-
2026-06-13days on market $99,900 Active 4 DOM
-
2026-06-10days on market $99,900 Active 2 DOM
-
2026-06-09remarks 699-char remark
-
2026-06-09$99,900 Active 1 DOM
ⓘ Source: listings_history table (triggers on properties + properties_extension) + one-shot
backfill from property_details.listing_events for pre-trigger history.
Tax reassessment forecast PA · Partial reset (capped growth)
- Current annual tax
- $1,820 · $152/mo
- Projected year-2 tax
- $1,820 · $152/mo
- Expected delta
- $0/yr ($0/mo · 0.0%)
ⓘ Screening estimate from a state-policy table — verify with the county assessor before closing.
Climate risk First Street
- Flood 1/10 Low FEMA zone X (unshaded) · 0% chance over 30 yrs
- Wildfire 1/10 Low
- Heat 2/10 Low 7 d/yr ≥89°F today · 16 d/yr by 30 yrs out
- Wind 1/10 Low
- Air quality 4/10 Moderate 3 unhealthy d/yr today · 7 by 30 yrs out
Nearby sold comps map
Loading sold comps map…
Walkable amenities ~0.75 mi
Loading nearby amenities…
Taxation est. · year 1
- Rental income
- $18,202
- − Mortgage interest
- −$5,596
- − Property taxes
- −$1,820
- − Insurance
- −$500
- − Repairs & maintenance
- −$1,456
- − Management
- −$1,456
- − HOA
- −$6,996
- − Depreciation
- −$2,906
- Taxable loss
- −$2,528
- Est. tax savings @ 24.0%
- +$607
- After-tax cash flow
- $-616/yr
For passive investors: Depreciation is non-cash, so a rental often shows a tax loss while cash-flowing — sheltering income. Rental losses are passive: they offset passive income freely, and up to $25,000/yr can offset ordinary (W-2) income if you actively participate and your MAGI is under $100k (phasing out to $0 by $150k); unused losses carry forward. On sale, claimed depreciation is recaptured at up to 25%, and gains may owe capital-gains tax (a 1031 exchange can defer both). Figures are a year-1 estimate at your 24.0% rate — not tax advice; consult a CPA.
Schools (NCES district)
- District
- Fort Leboeuf SD
- NCES district ID
- 4209990
- Math proficiency
- 52% ▼ -12.00%
- Reading proficiency
- 68% ▼ -6.00%
- Median HH income
- $54,607
- Composite
- 51.46/100
- National rank
- #1725
- State rank
- #77 of 539 in PA
Livability — Erie
- Score
- 83/100
- State rank
- #109
- US rank
- #840
Category grades
Schools grade is shown separately in the Schools card above.
Census & demographics
- County
- Erie County · 92,215 people
- City population
- 92,215
- Metro
- Erie, PA
- Population (ZIP)
- 28,595
- Household income
- $68,846
- Rent vs Own
- Severe rent burden
- 870.0
Population outlook (Erie County) Hauer SSP2
- Today (2025)
- 272,159 people
- By 2030
- 266,299 · -2.2%
- By 2040
- 250,987 · -7.8%
- By 2050
- 234,925 · -13.7%
- By 2075
- 199,164 · -26.8%
- By 2100
- 162,985 · -40.1%
Race, ethnicity, and origin ACS 2023
- Neighborhood character
- Predominantly White (87%)
- Race & ethnicity
- White 87% Two or more races 6% Black 4% Hispanic / Latino 3% Asian 1%
- Common ancestry
- Romanian 14% Slovak 4% Scotch-Irish 2%
- Foreign-born
- 6% · Canada
- Languages at home
- 92% English-only · Russian/Polish/Slavic 3% German/W. Germanic 1% Spanish 1%
Political lean MEDSL · Erie
- 2024 margin
- Toss-up / Even · D 49.0% · R 50.0%
- 2008→2024 swing
- -20.9pp toward R · 2008: 19.9pp · 2024: -1.0pp
- All cycles
- 2024: R+1.0 2020: D+1.0 2016: R+2.0 2012: D+16.9 2008: D+19.9
Not yet ingested
- Civics
- —
Market trends
- HPI YoY
- ▼ -106.54%
- Current HPI
- 240.361
- Rent YoY
- —
- Metro
- Erie, PA
- State GDP YoY
- ▲ 1.68%
- F500 in state
- 34
Industry mix (Fortune 500 HQ in PA)
| Industry | F500 HQs | Revenue |
|---|---|---|
| Healthcare | 2 | $309B |
|
||
| Insurance | 2 | $27B |
|
||
| Telecommunications / Media | 1 | $124B |
|
||
| Industrial Distribution | 1 | $22B |
|
||
| Financial Services | 1 | $20B |
|
||
| Chemicals / Materials | 1 | $18B |
|
||
Price history
1 event — show timeline
- 2026-06-05 Listed $99,900 GEBOR
Property tax history
+2.8%/yrLatest (2026): $1,820 · +4.8% YoY. Source: county tax records.
Cash-flow waterfall
monthlySold comps — $/sqft
last 12 mo · ≤1 miLoading sold comps…