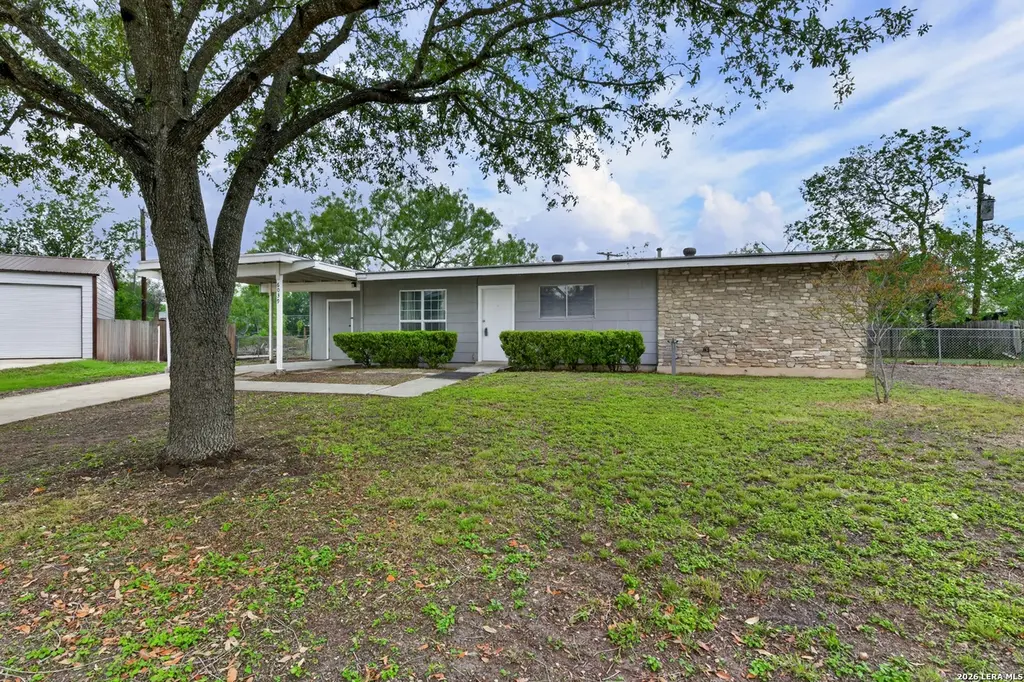
6039 Golden Valley Dr · San Antonio, TX
Flood risk 1/10 · Minimal
- FEMA flood zone
- X (unshaded)
- Chance of flooding over 30 yrs
- 0.0%
- Est. flood insurance / yr
- $507 – $1,088
Fire risk 4/10 · Minor
- Est. fire insurance / yr
- $1,222 – $2,270
Heat risk 8/10 · Major
- Hot days now (above 108°F)
- 7 days/yr
- Hot days in 30 yrs
- 23 days/yr
Wind risk 8/10 · Major
- Chance of severe wind over 30 yrs
- 80.0%
Air-quality risk 2/10 · Minimal
- Unhealthy air days now
- 1 days/yr
- Unhealthy air days in 30 yrs
- 1 days/yr
Risk factors via First Street. Map © Google.
Why this score? — see what drove the C- grade
The composite is a weighted blend of 9 inputs, each scored 0–100. Each bar is that input's sub-score; the figure is the points it added to the 100-point composite (weight × sub-score).
- Cash flow +18.1/30.0
- ARV discount +13.0/15.0
- 1% rule +6.2/10.0
- DSCR +5.7/10.0
- Livability +4.0/5.0
- Condition / age +2.5/5.0
- Rent growth +2.2/5.0
- Schools +1.4/10.0
- Appreciation +0.0/10.0
$140,000
🖨 Deal sheet (PDF) 📄 Offer letter ✓ Due diligence
Listing remarks
Nestled on a cul-de-sac with mature trees, this single-story home offers a simple, comfortable layout with a light-filled living and dining area highlighted by vaulted ceilings and decorative wood beams. Tile flooring runs throughout for easy maintenance, and the kitchen features gas cooking and opens to the dining area, creating a practical, everyday flow. The three bedrooms are modest in size, providing functional spaces for daily living. A roof replacement completed in 2023 adds peace of mind. Out back, a spacious yard offers plenty of room to enjoy the outdoors, whether for pets, gardening, or relaxing under the trees. A covered patio with an attached laundry area adds convenience, alon
Key facts
- Gas cooking
- Tile flooring
- Cul-de-sac
Tags
Property features AI
Finance
- HOA & community: Located in Lackland City subdivision
Exterior
- Parking: Level driveway
- Utilities: Water: SAWS (city water/sewer); Sewer: SAWS (city sewer); Gas: CPS; Electricity: CPS; City garbage service
- Home design: Pre-owned single-family residence; Approximate age: 59 years; All bedrooms on first/lower level; Bathroom on first floor
- Construction: Asbestos shingle and brick exterior; Composition roof; Slab foundation
- Exterior features: Covered patio; Chain-link and partial fencing; Storage building/shed; Mature trees; Level lot; Level drive; Cul-de-sac/Dead-end lot; Street paved (city street)
Interior
- Kitchen: Stove/Range
- Bedrooms: Master bedroom on lower level with ceiling fan (13 x 11); Bedroom 2 (10 x 9); Bedroom 3 (11 x 10)
- Flooring: Ceramic tile floor
- Bathrooms: One full bathroom
- Heating & cooling: Natural gas heat; Panel heating; 3+ window A/C units
- Interior features: Ceiling fans; Chandelier; Smoke alarm; Carbon monoxide detector; Gas water heater; City garbage service; High ceilings; Cable TV available; High-speed internet; Laundry located in closet; Washer and dryer connections; Separate dining room; One living area; All bedrooms on lower level; Bathroom on first floor; Accessible/adaptive home
- Laundry & utility: Washer connection; Dryer connection; Laundry in closet
Neighborhood map
What this means for you Summary
Snapshot
- This is a 3-bed/1.0-bath single-family listed at $140k.
Deal economics
- At list price, monthly cash flow is $122 ($1k/yr) — positive.
- The deal already cash-flows at list — no discount required.
- Meets the 1% rule at list price ($2k rent vs $140k).
- Cap rate 7.3% vs local median 3.8% in San Antonio — top-decile yield for the area; either an underpriced asset or a hidden risk that comps aren't pricing in. Stress-test before assuming the spread holds.
Location & tenants
- Location reads 80/100 on livability (#31 in TX, #1,616 nationally) — a professional / high-income tenant draw. Strengths: amenities A+, commute A+, cost of living A+; Watch: crime F.
- South San Antonio ISD (urban): math 13% / reading 20% proficiency, ranked #804 of 826 in TX (top 97%) — low school quality limits family demand, transient renter base, plan for 1-2y turnover.
- Zoned schools: Five Palms El (math 12% / reading 17%, grade F, #4,048 of 4,322 statewide, top 95%, 510 students, 93% FRL); South San Antonio H S (math 27% / reading 32%, grade F, #1,112 of 1,632 statewide, top 70%, 1,786 students, 93% FRL) — zoned schools average 93% FRL vs 42% district-wide (51 pts higher); higher-poverty schools than district average — tighter screening recommended.
- Market conditions: Rents soft (-1.3%/yr); 92 active listings in the ZIP; 35 comparable units currently listed for rent nearby; rentals at typical pace (median 18d on market — plan ~3-4 weeks tenant-placement turnaround); 8,308 units permitted in Bexar County in 2024 (2,506 in 5+ unit buildings).
- This rent runs 37% of the median local income ($51k/yr) — at the standard rent-burdened threshold; future hikes will face affordability resistance.
Forward outlook
- Local home prices are declining (-3.0%/yr); year-one equity from $968 of loan paydown is wiped out by about $4k of value loss. Plan a longer hold.
- Bexar County population projected at +50% by 2050 — long-run rental-demand tailwind backs the buy-and-hold thesis.
Negotiation context
- Only 12 days on market — expect competitive offers; lowballing is unlikely to land.
Risks & watch-outs
- Watch-outs: property tax is 2.8% of price.
- Climate carrying-cost: severe wind risk, 80% chance of damaging wind over 30y; extreme-heat days projected 7→23/yr by 2055 (HVAC capex compounding) — expect insurance premiums to compound above CPI over the hold.
Questions for the listing agent
- Built in 1967 — when were the roof, HVAC, electrical panel, plumbing, and water heater last replaced?
- Property tax is high relative to price — has the assessment been appealed recently, and will the sale trigger a re-assessment?
- Is there a deadline driving the sale (1031 exchange, divorce, estate, relocation)? That informs how much negotiation room exists.
- Crime grade is F in this area — have there been break-ins, vandalism, or insurance claims at this property in the last 3 years? What carrier currently insures it and at what premium?
- What's the average days-on-market for RENTAL listings here right now (not sales)? A rising rental-DOM trend means longer vacancies and softer asking-rent achievability than the comps imply.
- What's the recent tenant-quality profile in this submarket — average credit score on applications, eviction rate, late-payment / NSF rate, and stable-employment percentage? A property-management company in the area should have these aggregated.
- How much new for-sale + rental construction is in the pipeline within 1–3 miles? Heavy new supply typically softens prices + rents 12–24 months out; constrained supply supports both.
Investment metrics
- 1% rule
- 1.12% ✓
- Cap rate
- 7.34%
- Cash-on-cash
- 3.74%
- DSCR
- 1.17
- GRM
- 7.4
CMA / ARV
- ARV (median comp)
- $159,671
- List price
- $140,000
- Delta
- -12.32%
- Verdict
- UNDERPRICED
- Comps
- 20 within 1.0 mi
Show comp detail 12 sales within ~0.75 mi
| Address | Dist | Beds/Ba | Sqft | Sold | Price | $/sf | Match |
|---|---|---|---|---|---|---|---|
| 6039 Golden Valley Dr | 0.00mi | 3/1.0 | 1,032 (0%) | 1mo | $140,000 | $136 | 100 |
| 6134 Cedar Vly | 0.29mi | 3/1.0 | 1,032 (0%) | 2mo | $159,900 | $155 | 84 |
| 5914 Fir Vly | 0.16mi | 3/1.0 | 984 (-5%) | 2mo | $164,900 | $168 | 83 |
| 6034 Pine Vly | 0.56mi | 3/1.0 | 1,008 (-2%) | 7mo | $137,000 | $136 | 64 |
| 7038 Apple Vly | 0.06mi | 4/1.0 (+1) | 1,173 (+14%) | 10mo | $169,900 | $145 | 61 |
| 5746 Elm Vly | 0.61mi | 3/2.0 | 1,056 (+2%) | 3mo | $199,999 | $189 | 61 |
| 6719 Walnut Vly | 0.67mi | 3/2.0 | 1,020 (-1%) | 3mo | $173,500 | $170 | 60 |
| 5910 Fairgreen | 0.60mi | 2/2.0 (-1) | 1,024 (-1%) | 4mo | $99,950 | $98 | 59 |
| 5922 Autumn Palms | 0.36mi | 2/1.0 (-1) | 950 (-8%) | 10mo | $170,000 | $179 | 57 |
| 151 Reefridge | 0.71mi | 3/1.0 | 946 (-8%) | 2mo | $139,500 | $147 | 51 |
| 5915 Middlefield | 0.69mi | 3/2.0 | 1,180 (+14%) | 3mo | $175,900 | $149 | 38 |
| 7502 Apple Vly | 0.67mi | 4/1.0 (+1) | 1,178 (+14%) | 7mo | $122,000 | $104 | 34 |
Match score weights: distance 35% · size 25% · config 20% · recency 20%. Top-matched comps best support the ARV.
Projected returns pro-forma
-3.0% appreciation · 0.0% rent growth · sell at horizon
- IRR
- -14.3%
- Equity multiple
- 0.51×
- Total profit
- $-19,394
- Equity at exit
- $20,874
- IRR
- -12.3%
- Equity multiple
- 0.38×
- Total profit
- $-24,192
- Equity at exit
- $12,105
Cash invested: $39,200 (down + closing). Projections, not guarantees.
Landlord ↔ Tenant lean methodology
- Overall (STATE)
- 87 Strongly Landlord-Friendly
- State Texas
- 87 Strongly Landlord-Friendly · R+5
- County
- — inherits STATE
- City
- — inherits STATE
ZIP-level market 78242
- Home prices YoY
- -17.6%
- Rents YoY
- -1.3%
- Active inventory
- 92
- Price-to-rent
- 7.4×
Monthly cashflow live
- Estimated rent
- $1,571 high interval (Pro) →
- Mortgage (P&I)
- −$734
- Tax from tax record
- −$327 /mo · $3,922/yr
- Insurance
- −$58
- HOA
- −$0
- Vacancy / Maint / Mgmt
- −$330
- Net cashflow
- $122
Break-even live
Sensitivity live
| Price | -10% $201 | -5% $162 | +0% $122 | +5% $83 | +10% $43 |
|---|---|---|---|---|---|
| Rent | -10% $-2 | -5% $60 | +0% $122 | +5% $184 | +10% $246 |
| Rate | -1.0pp $193 | -0.5pp $158 | base $122 | +0.5pp $86 | +1.0pp $49 |
UW: 25.0% down · 7.5% · 30yr · 1.5% tax · 5.0% vac · 8.0% maint · 8.0% mgmt
Financing live
Cash to close
- Down payment
- $35,000
- Closing costs
- $4,200
- Reserves months
- —
- Total cash needed
- —
Loan-product check · same deal, 3 products live
Conventional
25% down · 7.5% · 30yr
- Down + closing
- —
- Monthly P&I
- —
- Monthly cashflow
- —
- DSCR
- —
- Eligible?
- —
Personal DTI + credit; lowest rate.
DSCR
20% down · 8.5% · 30yr
- Down + closing
- —
- Monthly P&I
- —
- Monthly cashflow
- —
- DSCR
- —
- Eligible?
- —
No personal income docs; deal must DSCR.
Hard money
10% down · 12.0% · 12mo
- Down + closing
- —
- Monthly P&I
- —
- Monthly cashflow
- —
- DSCR
- —
- Eligible?
- —
Short-term bridge; refi at stabilization.
Rent comps 35 comps
| Address | Beds | Baths | Sqft | Rent | $/sqft | DOM | Units | Dist |
|---|---|---|---|---|---|---|---|---|
| 6106 Cedar Valley Dr San Antonio, TX | 3.0 | 1.0 | 984 | $1,375 | $1.40 | 5d | 1 | 0.25mi |
| 7411 Hazel Cv San Antonio, TX | 3.0 | 2.0 | 1287 | $1,450 | $1.13 | 17d | 1 | 0.37mi |
| 5938 Autumn Palms San Antonio, TX | 3.0 | 2.0 | 1350 | $2,400 | $1.78 | 0d | 1 | 0.37mi |
| 6627 Freedom Rnch San Antonio, TX | 3.0 | 2.0 | 1400 | $1,750 | $1.25 | 25d | 1 | 0.37mi |
| 6619 Freedom Hls San Antonio, TX | 4.0 | 2.5 | 1410 | $1,900 | $1.35 | 3d | 1 | 0.40mi |
| 6230 Hazel Valley St San Antonio, TX | 3.0 | 2.0 | 1344 | $1,650 | $1.23 | 23d | 1 | 0.40mi |
| 6802 Cougar Cv San Antonio, TX | 3.0 | 2.0 | 1251 | $1,550 | $1.24 | 45d | 1 | 0.48mi |
| 6214 Slate Valley Dr San Antonio, TX | 3.0 | 1.0 | 920 | $1,100 | $1.20 | 25d | 1 | 0.52mi |
| 6611 Cougar Vlg San Antonio, TX | 3.0 | 2.0 | 1251 | $1,495 | $1.20 | 16d | 1 | 0.54mi |
| 6010 Ray Ellison Blvd San Antonio, TX | 1.0–3.0 | 1.0–2.0 | 974 | $1,418 | $1.46 | 45d | 1 | 0.55mi |
| 7319 Walnut Valley Dr San Antonio, TX | 3.0 | 2.0 | 1152 | $1,900 | $1.65 | 14d | 1 | 0.55mi |
| 6719 Dragon Crk San Antonio, TX | 3.0 | 2.0 | 1210 | $1,700 | $1.40 | 25d | 1 | 0.60mi |
| 5927 Mohave Vly San Antonio, TX | 3.0 | 2.0 | 1464 | $1,750 | $1.20 | 25d | 1 | 0.69mi |
| 6286 Apple Valley Dr San Antonio, TX | 3.0 | 2.0 | 1188 | $1,395 | $1.17 | 3d | 1 | 0.75mi |
| 5611 Elm Valley Dr San Antonio, TX | 3.0 | 2.0 | 1445 | $1,700 | $1.18 | 45d | 1 | 0.79mi |
| 6243 Indian Valley Dr San Antonio, TX | 3.0 | 1.0 | 975 | $1,400 | $1.44 | 5d | 1 | 0.80mi |
| 8671 SW Loop 410 San Antonio, TX | 2.0–3.0 | 2.0 | 1024 | $1,405 | $1.37 | 17d | 7 | 0.88mi |
| 7327 Aphelion Cv San Antonio, TX | 3.0 | 2.0 | 1408 | $1,499 | $1.06 | 45d | 1 | 0.99mi |
| 5619 Stonybrook Dr San Antonio, TX | 3.0 | 1.0 | 888 | $1,425 | $1.60 | 45d | 1 | 0.99mi |
| 6911 Hallie Rdg San Antonio, TX | 3.0 | 2.5 | 1463 | $1,475 | $1.01 | 45d | 1 | 1.00mi |
| 5415 Ray Ellison Blvd San Antonio, TX | 1.0–2.0 | 1.0–2.0 | 878 | $1,240 | $1.41 | 5d | 24 | 1.03mi |
| 5547 Stonybrook Dr San Antonio, TX | 3.0 | 2.0 | 1014 | $1,425 | $1.41 | 25d | 1 | 1.07mi |
| 6943 Emerald Vly San Antonio, TX | 3.0 | 2.0 | 1341 | $1,650 | $1.23 | 16d | 1 | 1.11mi |
| 7515 Holm Rd San Antonio, TX | 1.0–3.0 | 1.0–2.0 | 886 | $1,404 | $1.58 | 4d | 31 | 1.11mi |
| 154 Morning Valley St San Antonio, TX | 3.0 | 2.0 | 1400 | $1,300 | $0.93 | 4d | 1 | 1.20mi |
| 7307 Apastron Haze San Antonio, TX | 3.0 | 2.0 | 1274 | $1,395 | $1.09 | 25d | 1 | 1.24mi |
| 5350 Military Dr W Unit 710 San Antonio, TX | 2.0 | 2.0 | 1082 | $907 | $0.84 | 17d | 1 | 1.24mi |
| 5350 W Military Dr San Antonio, TX | 1.0–3.0 | 1.0–2.0 | 972 | $1,356 | $1.40 | 3d | 54 | 1.24mi |
| 150 Rustleaf Dr San Antonio, TX | 1.0–3.0 | 1.0–2.0 | 898 | $1,099 | $1.22 | 3d | 46 | 1.28mi |
| 134 Lake Valley St San Antonio, TX | 2.0 | 2.0 | 940 | $1,350 | $1.44 | 45d | 1 | 1.31mi |
| 326 Whitewood Dr San Antonio, TX | 2.0 | 1.0 | 668 | $1,216 | $1.82 | 3d | 8 | 1.34mi |
| 5523 Indian Desert St San Antonio, TX | 4.0 | 1.5 | 1192 | $1,325 | $1.11 | 19d | 1 | 1.35mi |
| 5507 Prairie Flower Dr San Antonio, TX | 3.0 | 2.0 | 1172 | $2,000 | $1.71 | 11d | 1 | 1.41mi |
| 5427 Indian Desert St San Antonio, TX | 3.0 | 2.0 | 888 | $1,195 | $1.35 | 23d | 1 | 1.41mi |
| 5542 Snow Fox St San Antonio, TX | 4.0 | 1.5 | 1280 | $1,900 | $1.48 | 45d | 1 | 1.48mi |
Listing history 4 events
-
2026-05-13status Pending 923-char remark
-
2026-05-05historical Active Option 923-char remark
-
2026-05-01$140,000 New 923-char remark
-
1983-06-01soldstatus
ⓘ Source: listings_history table (triggers on properties + properties_extension) + one-shot
backfill from property_details.listing_events for pre-trigger history.
Tax reassessment forecast TX · Resets to sale price
- Current annual tax
- $3,922 · $327/mo
- Projected year-2 tax
- $3,922 · $327/mo
- Expected delta
- $0/yr ($0/mo · 0.0%)
ⓘ Screening estimate from a state-policy table — verify with the county assessor before closing.
Climate risk First Street
- Flood 1/10 Low FEMA zone X (unshaded) · 0% chance over 30 yrs
- Wildfire 4/10 Moderate
- Heat 8/10 Severe 7 d/yr ≥108°F today · 23 d/yr by 30 yrs out
- Wind 8/10 Severe 80% chance of damaging wind over 30 yrs
- Air quality 2/10 Low 1 unhealthy d/yr today · 1 by 30 yrs out
Nearby sold comps map
Loading sold comps map…
Walkable amenities ~0.75 mi
Loading nearby amenities…
Taxation est. · year 1
- Rental income
- $18,858
- − Mortgage interest
- −$7,842
- − Property taxes
- −$3,922
- − Insurance
- −$700
- − Repairs & maintenance
- −$1,509
- − Management
- −$1,509
- − Depreciation
- −$4,073
- Taxable loss
- −$696
- Est. tax savings @ 24.0%
- +$167
- After-tax cash flow
- $1,633/yr
For passive investors: Depreciation is non-cash, so a rental often shows a tax loss while cash-flowing — sheltering income. Rental losses are passive: they offset passive income freely, and up to $25,000/yr can offset ordinary (W-2) income if you actively participate and your MAGI is under $100k (phasing out to $0 by $150k); unused losses carry forward. On sale, claimed depreciation is recaptured at up to 25%, and gains may owe capital-gains tax (a 1031 exchange can defer both). Figures are a year-1 estimate at your 24.0% rate — not tax advice; consult a CPA.
Schools (NCES district)
- District
- South San Antonio ISD
- NCES district ID
- 4840680
- Math proficiency
- 13% ▼ -20.00%
- Reading proficiency
- 20% ▼ -10.00%
- Median HH income
- $35,460
- Composite
- 13.6/100
- National rank
- #9511
- State rank
- #804 of 826 in TX
Livability — San Antonio
- Score
- 80/100
- State rank
- #31
- US rank
- #1616
Category grades
Schools grade is shown separately in the Schools card above.
Census & demographics
- Census place
- San Antonio, TX
- County
- Bexar County · 1,990,555 people
- City population
- 1,806,925
- Metro
- San Antonio-New Braunfels, TX
- Population (ZIP)
- 36,168
- Household income
- $50,644
- Rent vs Own
- Severe rent burden
- 1778.0
Population outlook (Bexar County) Hauer SSP2
- Today (2025)
- 2,336,851 people
- By 2030
- 2,560,728 · +9.6%
- By 2040
- 3,020,569 · +29.3%
- By 2050
- 3,493,522 · +49.5%
- By 2075
- 4,668,459 · +99.8%
- By 2100
- 5,533,242 · +136.8%
Race, ethnicity, and origin ACS 2023
- Neighborhood character
- Predominantly Hispanic (86%)
- Race & ethnicity
- Hispanic / Latino 86% Two or more races 25% White 8% Black 3% Native American 2%
- Hispanic origin (detail)
- Mexican 67%
- Common ancestry
- Romanian 1% Italian 1%
- Foreign-born
- 20% · Canada
- Languages at home
- 43% English-only · Spanish 55%
Political lean MEDSL · Bexar
- 2024 margin
- Lean D (+9.8) · D 54.3% · R 44.6% · Other 1.1%
- 2008→2024 swing
- +4.2pp toward D · 2008: 5.6pp · 2024: 9.8pp
- All cycles
- 2024: D+9.8 2020: D+18.2 2016: D+13.5 2012: D+4.6 2008: D+5.6
Not yet ingested
- Civics
- —
Market trends
- HPI YoY
- ▼ -55.63%
- Current HPI
- 259.9788
- Rent YoY
- ▼ -1.32%
- Metro
- San Antonio-New Braunfels, TX
- State GDP YoY
- ▲ 3.95%
- F500 in state
- 110
Industry mix (Fortune 500 HQ in TX)
| Industry | F500 HQs | Revenue |
|---|---|---|
| Energy | 16 | $1,198B |
|
||
| Technology | 5 | $198B |
|
||
| Engineering / Construction | 4 | $72B |
|
||
| Energy Services | 3 | $60B |
|
||
| Utilities | 3 | $41B |
|
||
| Healthcare | 2 | $330B |
|
||
Price history
5 events — show timeline
- 2026-06-03 Sold (MLS) — LERA
- 2026-05-13 Pending — LERA
- 2026-05-05 Contingent — LERA
- 2026-05-01 Listed $140,000 LERA
- 1983-06-01 Sold (Public Records) — Public Records
Property tax history
+7.3%/yrLatest (2025): $3,922 · -4.1% YoY. Source: county tax records.
Cash-flow waterfall
monthlySold comps — $/sqft
last 12 mo · ≤1 miLoading sold comps…