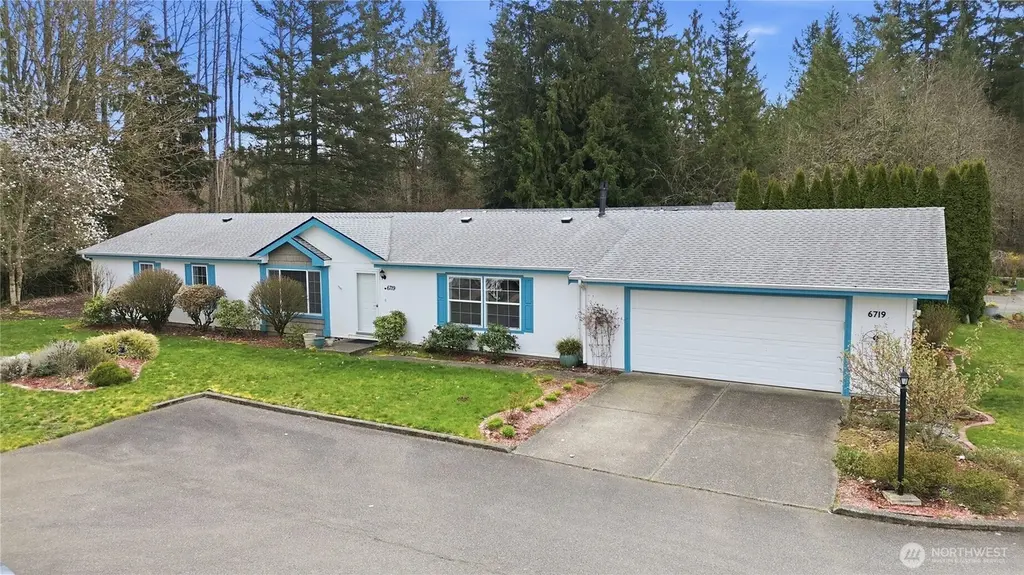
6719 241st Ave E #46 · Lake Tapps, WA
Flood risk 1/10 · Minimal
- FEMA flood zone
- X (shaded)
- Chance of flooding over 30 yrs
- 0.0%
- Est. flood insurance / yr
- $507 – $1,088
Fire risk 3/10 · Minor
- Est. fire insurance / yr
- $604 – $1,122
Heat risk 2/10 · Minimal
- Hot days now (above 88°F)
- 7 days/yr
- Hot days in 30 yrs
- 16 days/yr
Wind risk 1/10 · Minimal
- Chance of severe wind over 30 yrs
- —
Air-quality risk 6/10 · Moderate
- Unhealthy air days now
- 10 days/yr
- Unhealthy air days in 30 yrs
- 12 days/yr
Risk factors via First Street. Map © Google.
Why this score? — see what drove the B grade
The composite is a weighted blend of 9 inputs, each scored 0–100. Each bar is that input's sub-score; the figure is the points it added to the 100-point composite (weight × sub-score).
- Cash flow +30.0/30.0
- DSCR +10.0/10.0
- ARV discount +9.4/15.0
- 1% rule +8.3/10.0
- Schools +5.7/10.0
- Livability +3.4/5.0
- Rent growth +2.5/5.0
- Condition / age +2.5/5.0
- Appreciation +0.0/10.0
$249,500
🖨 Deal sheet 📄 Offer letter ✓ Due diligence
Listing remarks
Welcome to the sought-after 55+ community of Golden Valley Estates in Buckley! Tucked inside a gated community and backing to open space, this updated 1,890 sq ft home offers privacy, comfort, and an exceptional main-level floor plan. Inside, you’re greeted by a bright living room with vaulted ceilings and new carpet throughout. The kitchen is both functional and inviting, featuring stainless steel appliances, cabinets with added drawer storage, and a large island with pop-up outlets—perfect for everyday use or hosting. It flows seamlessly into the dining area, where a slider opens to the covered patio for easy indoor-outdoor living. The cozy family room with a gas fireplace is
Key facts
- Garage
- Built 2003
- Listed 40 days
Neighborhood map
What this means for you Summary
Snapshot
- This is a 3-bed/2.0-bath manufactured listed at $250k.
Deal economics
- At list price, monthly cash flow is $974 ($12k/yr) — positive.
- The deal already cash-flows at list — no discount required.
- Meets the 1% rule at list price ($3k rent vs $250k).
- Recommended offer: $242k (3.0% below list) — sets the bar for market timing.
- Cap rate 11.0% vs local median 2.7% in Lake Tapps — top-decile yield for the area; either an underpriced asset or a hidden risk that comps aren't pricing in. Stress-test before assuming the spread holds.
Location & tenants
- Location reads 68/100 on livability (#289 in WA) — a middle-class / working-renter tenant base. Strengths: schools A+, crime A+, employment A+; Watch: amenities F, commute F, cost of living F.
- White River School District (suburban): math 57% / reading 68% proficiency, ranked #35 of 291 in WA (top 12%) — acceptable for families but not a draw, mixed tenant base, ~2y average lease.
- Market conditions: 235 active listings in the ZIP; 3,209 units permitted in Pierce County in 2024 (1,269 in 5+ unit buildings).
Forward outlook
- Local home prices are declining (-3.0%/yr); year-one equity from $2k of loan paydown is wiped out by about $7k of value loss. Plan a longer hold.
- Pierce County population projected at +26% by 2050 — long-run rental-demand tailwind backs the buy-and-hold thesis.
- At projected returns (-3.0% appreciation + 3.0% rent growth), your $70k cash investment doubles in ~8 years — after that, you're playing with house money.
Negotiation context
- It's been on market 40 days — a 3% lower offer ($242k) is reasonable based on typical stale-listing flexibility.
- 2 sale attempts with the ask held roughly flat each time — persistent listings suggest the price (not the market) is what's stuck; bring a comps-based counter.
Questions for the listing agent
- It's been on market 40 days. Have you received any prior offers? Is the seller open to a 3% concession, seller financing, or rate buy-down credit?
- Is there a deadline driving the sale (1031 exchange, divorce, estate, relocation)? That informs how much negotiation room exists.
- Schools are A-rated — typically a magnet for longer-tenancy family renters. What's the average tenant stay here, and is there a school-zone premium baked into asking?
- What's the average days-on-market for RENTAL listings here right now (not sales)? A rising rental-DOM trend means longer vacancies and softer asking-rent achievability than the comps imply.
- What's the recent tenant-quality profile in this submarket — average credit score on applications, eviction rate, late-payment / NSF rate, and stable-employment percentage? A property-management company in the area should have these aggregated.
- How much new for-sale + rental construction is in the pipeline within 1–3 miles? Heavy new supply typically softens prices + rents 12–24 months out; constrained supply supports both.
Investment metrics
- 1% rule
- 1.33% ✓
- Cap rate
- 10.98%
- Cash-on-cash
- 16.74%
- DSCR
- 1.74
- GRM
- 6.3
CMA / ARV
- ARV (median comp)
- $260,576
- List price
- $249,500
- Delta
- -4.25%
- Verdict
- FAIR
- Comps
- 4 within 1.0 mi
Show comp detail 6 sales within ~0.75 mi
| Address | Dist | Beds/Ba | Sqft | Sold | Price | $/sf | Match |
|---|---|---|---|---|---|---|---|
| 6719 241st Ave E #46 | 0.00mi | 3/2.0 | 1,890 (0%) | 1mo | $235,000 | $124 | 100 |
| 24218 66th St E #100 | 0.08mi | 3/2.0 | 1,728 (-9%) | 12mo | $285,000 | $165 | 72 |
| 24319 68th St E #84 | 0.10mi | 3/2.5 | 2,155 (+14%) | 1mo | $316,000 | $147 | 69 |
| 24317 68th St E #83 | 0.11mi | 3/2.0 | 1,782 (-6%) | 23mo | $310,000 | $174 | 66 |
| 6707 243rd Ave E #78 | 0.08mi | 3/2.0 | 1,620 (-14%) | 22mo | $295,000 | $182 | 54 |
| 24223 66th St E #69 | 0.11mi | 2/2.0 (-1) | 1,664 (-12%) | 22mo | $265,000 | $159 | 51 |
Match score weights: distance 35% · size 25% · config 20% · recency 20%. Top-matched comps best support the ARV.
Projected returns pro-forma
-3.0% appreciation · 3.0% rent growth · sell at horizon
- IRR
- 7.9%
- Equity multiple
- 1.31×
- Total profit
- $21,635
- Equity at exit
- $37,201
- IRR
- 17.2%
- Equity multiple
- 2.41×
- Total profit
- $98,755
- Equity at exit
- $21,572
Cash invested: $69,860 (down + closing). Projections, not guarantees.
Landlord ↔ Tenant lean methodology
- Overall (STATE)
- 28 Tenant-Leaning
- State Washington
- 28 Tenant-Leaning · D+8
- County
- — inherits STATE
- City
- — inherits STATE
ZIP-level market 98321
- Active inventory
- 235
- Price-to-rent
- 6.3×
Monthly cashflow live
- Estimated rent
- $3,311 medium interval (Pro) →
- Mortgage (P&I)
- −$1,308
- Tax from tax record
- −$229 /mo · $2,746/yr
- Insurance
- −$104
- HOA
- −$0
- Vacancy / Maint / Mgmt
- −$695
- Net cashflow
- $974
Break-even live
UW: 25.0% down · 7.5% · 30yr · 1.5% tax · 5.0% vac · 8.0% maint · 8.0% mgmt
Financing live
Cash to close
- Down payment
- $62,375
- Closing costs
- $7,485
- Reserves months
- —
- Total cash needed
- —
Loan-product check · same deal, 3 products live
Conventional
25% down · 7.5% · 30yr
- Down + closing
- —
- Monthly P&I
- —
- Monthly cashflow
- —
- DSCR
- —
- Eligible?
- —
Personal DTI + credit; lowest rate.
DSCR
20% down · 8.5% · 30yr
- Down + closing
- —
- Monthly P&I
- —
- Monthly cashflow
- —
- DSCR
- —
- Eligible?
- —
No personal income docs; deal must DSCR.
Hard money
10% down · 12.0% · 12mo
- Down + closing
- —
- Monthly P&I
- —
- Monthly cashflow
- —
- DSCR
- —
- Eligible?
- —
Short-term bridge; refi at stabilization.
Listing history 4 events
-
2026-05-13status Pending
-
2026-05-13status Pending
-
2026-04-02$249,500 Active
-
2026-04-02$249,500 Active
ⓘ Source: listings_history table (triggers on properties + properties_extension) + one-shot
backfill from property_details.listing_events for pre-trigger history.
Tax reassessment forecast WA · Resets to sale price
- Current annual tax
- $2,746 · $229/mo
- Projected year-2 tax
- $2,746 · $229/mo
- Expected delta
- $0/yr ($0/mo · 0.0%)
ⓘ Screening estimate from a state-policy table — verify with the county assessor before closing.
Climate risk First Street
- Flood 1/10 Low FEMA zone X (shaded) · 0% chance over 30 yrs
- Wildfire 3/10 Moderate
- Heat 2/10 Low 7 d/yr ≥88°F today · 16 d/yr by 30 yrs out
- Wind 1/10 Low
- Air quality 6/10 Major 10 unhealthy d/yr today · 12 by 30 yrs out
Nearby sold comps map
Loading sold comps map…
Walkable amenities ~0.75 mi
Loading nearby amenities…
Taxation est. · year 1
- Rental income
- $39,732
- − Mortgage interest
- −$13,976
- − Property taxes
- −$2,746
- − Insurance
- −$1,248
- − Repairs & maintenance
- −$3,179
- − Management
- −$3,179
- − Depreciation
- −$7,258
- Taxable income
- $8,147
- Est. tax owed @ 24.0%
- −$1,955
- After-tax cash flow
- $9,739/yr
For passive investors: Depreciation is non-cash, so a rental often shows a tax loss while cash-flowing — sheltering income. Rental losses are passive: they offset passive income freely, and up to $25,000/yr can offset ordinary (W-2) income if you actively participate and your MAGI is under $100k (phasing out to $0 by $150k); unused losses carry forward. On sale, claimed depreciation is recaptured at up to 25%, and gains may owe capital-gains tax (a 1031 exchange can defer both). Figures are a year-1 estimate at your 24.0% rate — not tax advice; consult a CPA.
Schools (NCES district)
- District
- White River School District
- NCES district ID
- 5309780
- Math proficiency
- 57% ▲ 3.00%
- Reading proficiency
- 68% ▲ 6.00%
- Median HH income
- $71,369
- Composite
- 56.68/100
- National rank
- #2423
- State rank
- #35 of 291 in WA
Livability — Lake Tapps
- Score
- 68/100
- State rank
- #289
- US rank
- #10068
Category grades
Schools grade is shown separately in the Schools card above.
Census & demographics
- Population (ZIP)
- 17,601
Population outlook (Pierce County) Hauer SSP2
- Today (2025)
- 956,648 people
- By 2030
- 1,010,862 · +5.7%
- By 2040
- 1,113,170 · +16.4%
- By 2050
- 1,206,524 · +26.1%
- By 2075
- 1,436,425 · +50.2%
- By 2100
- 1,563,654 · +63.5%
Race, ethnicity, and origin ACS 2023
- Neighborhood character
- Predominantly White (87%)
- Race & ethnicity
- White 87% Hispanic / Latino 6% Two or more races 5% Native American 2% Asian 1%
- Hispanic origin (detail)
- Mexican 3% Puerto Rican 2%
- Common ancestry
- Portuguese 7% Italian 4% Lithuanian 3%
- Foreign-born
- 2% · China, Canada
- Languages at home
- 97% English-only · Spanish 1% Other Asian/Pacific 1%
Political lean MEDSL · Pierce
- 2024 margin
- D (+10.8) · D 53.9% · R 43.1% · Other 3.0%
- 2008→2024 swing
- -1.4pp toward R · 2008: 12.2pp · 2024: 10.8pp
- All cycles
- 2024: D+10.8 2020: D+11.2 2016: D+7.5 2012: D+11.0 2008: D+12.2
Not yet ingested
- Civics
- —
Market trends
- HPI YoY
- ▼ -206.67%
- Current HPI
- 310.6568
- Rent YoY
- —
- Metro
- —
- State GDP YoY
- ▲ 4.65%
- F500 in state
- 22
Industry mix (Fortune 500 HQ in WA)
| Industry | F500 HQs | Revenue |
|---|---|---|
| Retail | 2 | $269B |
|
||
| Technology / Retail | 1 | $638B |
|
||
| Technology | 1 | $245B |
|
||
| Telecommunications | 1 | $38B |
|
||
| Food / Beverage | 1 | $36B |
|
||
| Automotive / Trucks | 1 | $34B |
|
||
Price history
+0.0% since first listed4 events — show timeline
- 2026-05-13 Pending — NWMLS as Distributed by MLS Grid
- 2026-05-13 Pending — NWMLS as Distributed by MLS Grid
- 2026-04-02 Listed $249,500 NWMLS as Distributed by MLS Grid
- 2026-04-02 Listed $249,500 NWMLS as Distributed by MLS Grid
Property tax history
+5.0%/yrLatest (2026): $2,746 · +6.6% YoY. Source: county tax records.
Cash-flow waterfall
monthlySold comps — $/sqft
last 12 mo · ≤1 miLoading sold comps…