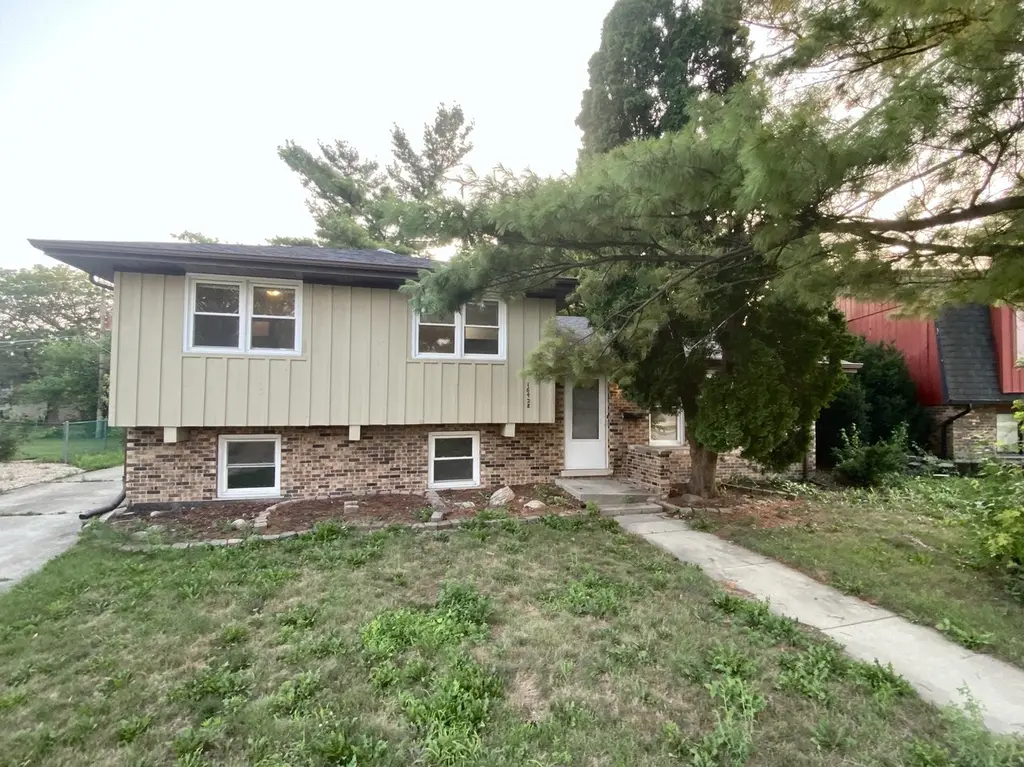
16428 Wabash Ave · South Holland, IL
Flood risk 6/10 · Moderate
- FEMA flood zone
- X (unshaded)
- Chance of flooding over 30 yrs
- 0.68%
- Est. flood insurance / yr
- $473 – $860
Fire risk 1/10 · Minimal
- Est. fire insurance / yr
- $804 – $1,492
Heat risk 3/10 · Minor
- Hot days now (above 102°F)
- 7 days/yr
- Hot days in 30 yrs
- 15 days/yr
Wind risk 2/10 · Minimal
- Chance of severe wind over 30 yrs
- —
Air-quality risk 4/10 · Minor
- Unhealthy air days now
- 4 days/yr
- Unhealthy air days in 30 yrs
- 5 days/yr
Risk factors via First Street. Map © Google.
Why this score? — see what drove the B- grade
The composite is a weighted blend of 9 inputs, each scored 0–100. Each bar is that input's sub-score; the figure is the points it added to the 100-point composite (weight × sub-score).
- Cash flow +25.8/30.0
- ARV discount +15.0/15.0
- 1% rule +9.7/10.0
- DSCR +8.6/10.0
- Livability +3.9/5.0
- Rent growth +2.5/5.0
- Condition / age +2.5/5.0
- Schools +0.7/10.0
- Appreciation +0.0/10.0
$194,000
🖨 Deal sheet 📄 Offer letter ✓ Due diligence
Listing remarks
A fantastic opportunity awaits in South Holland! This home offers a solid foundation for you to customize and build instant equity. It features hardwood floors throughout that are ready for your personal touch, a versatile finished lower level for extra living space, and a detached two-car garage for vehicles and storage. The three-bedroom layout provides a practical and desirable floor plan. The backyard is a blank canvas, complete with a wonderful gazebo over the back deck, ready for you to design your perfect outdoor oasis. Located with quick and easy access to major expressways like I-94 and I-294, your commute is simplified. This property is a great find!
Key facts
- Back deck
- Backyard gazebo
- Hardwood floors
Tags
Property features AI
Finance
- Financial info: Special service area: No
- HOA & community: No master association fee required; Community amenities include park, curbs, sidewalks, street lights and paved streets
Exterior
- Parking: Detached garage (owned), approximately 2.5 garage/total parking spaces
- Utilities: Public water; Public sewer; 100 amp electric service
- Home design: Detached single-family home; Tri-level / split-level design; Fee simple ownership; School bus service available; Age about 41–50 years
- Construction: Cedar exterior; Asphalt roof; Concrete perimeter foundation
- Exterior features: Screened porch; Porch; Fenced yard; Irregular lot; Lot dimensions approximately 50 x 107 x 84.113
Interior
- Kitchen: Eating-area kitchen (15 x 11, marble flooring); Range; Refrigerator
- Bedrooms: Three bedrooms total; Master bedroom on the second level (15 x 10, carpet); Second bedroom on the second level (12 x 9, carpet); Third bedroom on the second level (11 x 10, carpet)
- Flooring: Hardwood in portions of the home; Carpet in bedrooms, living and family areas; Marble in the kitchen; Other flooring in laundry
- Bathrooms: One full bathroom; One half bathroom; Soaking tub
- Heating & cooling: Natural gas forced-air heating; Central air conditioning
- Interior features: Seven total rooms; Window screens; Full unfinished attic; Separate dining room; Crawl space basement
- Laundry & utility: Lower-level laundry room (10 x 10)
Neighborhood map
What this means for you Summary
Snapshot
- This is a 3-bed/1.5-bath single-family listed at $194k.
Deal economics
- At list price, monthly cash flow is $468 ($6k/yr) — positive.
- The deal already cash-flows at list — no discount required.
- Meets the 1% rule at list price ($3k rent vs $194k).
Location & tenants
- Location reads 77/100 on livability (#167 in IL, #3,071 nationally) — a middle-class / working-renter tenant base. Strengths: commute A+, housing A+, cost of living A; Watch: crime C-, amenities C-, schools D+.
- Thornton Twp Hsd 205 (suburban): math 7% / reading 8% proficiency, ranked #594 of 620 in IL (top 96%) — low school quality limits family demand, transient renter base, plan for 1-2y turnover.
- Market conditions: 135 active listings in the ZIP; 4 comparable units currently listed for rent nearby; rentals at typical pace (median 25d on market — plan ~3-4 weeks tenant-placement turnaround); 6,272 units permitted in Cook County in 2024 (4,658 in 5+ unit buildings).
Forward outlook
- Local home prices are declining (-3.0%/yr); year-one equity from $1k of loan paydown is wiped out by about $6k of value loss. Plan a longer hold.
Negotiation context
- Only 6 days on market — expect competitive offers; lowballing is unlikely to land.
- 6 sale attempts since 14y ago; this cycle's ask has dropped $22k (10%) from the opening price — seller is motivated, your offer sets the floor, not the list.
Risks & watch-outs
- Watch-outs: property tax is 4.3% of price.
- Climate carrying-cost: major flood risk — expect insurance premiums to compound above CPI over the hold.
Questions for the listing agent
- Built in 1978 — when were the roof, HVAC, electrical panel, plumbing, and water heater last replaced?
- Property tax is high relative to price — has the assessment been appealed recently, and will the sale trigger a re-assessment?
- Is there a deadline driving the sale (1031 exchange, divorce, estate, relocation)? That informs how much negotiation room exists.
- Schools are D-rated, which usually means shorter tenancies and higher turnover. Who's the typical renter profile here, and what's been the actual vacancy rate?
- What's the average days-on-market for RENTAL listings here right now (not sales)? A rising rental-DOM trend means longer vacancies and softer asking-rent achievability than the comps imply.
- What's the recent tenant-quality profile in this submarket — average credit score on applications, eviction rate, late-payment / NSF rate, and stable-employment percentage? A property-management company in the area should have these aggregated.
- How much new for-sale + rental construction is in the pipeline within 1–3 miles? Heavy new supply typically softens prices + rents 12–24 months out; constrained supply supports both.
Investment metrics
- 1% rule
- 1.47% ✓
- Cap rate
- 9.19%
- Cash-on-cash
- 10.34%
- DSCR
- 1.46
- GRM
- 5.7
CMA / ARV
- ARV (on-the-fly)
- $232,841
- Comps found
- 12
Show comp detail 12 sales within ~0.75 mi
| Address | Dist | Beds/Ba | Sqft | Sold | Price | $/sf | Match |
|---|---|---|---|---|---|---|---|
| 1 E 164th St | 0.10mi | 3/2.0 | 1,255 (+9%) | 5mo | $195,000 | $155 | 74 |
| 16061 Wabash Ave | 0.47mi | 3/1.5 | 1,159 (+1%) | 6mo | $235,000 | $203 | 72 |
| 16811 Wausau Ave | 0.51mi | 3/2.0 | 1,145 (-0%) | 3mo | $245,000 | $214 | 71 |
| 112 E 160th Pl | 0.53mi | 3/2.0 | 1,141 (-0%) | 2mo | $210,000 | $184 | 71 |
| 16550 Elm Ct | 0.49mi | 4/2.5 (+1) | 1,144 (-0%) | 4mo | $252,000 | $220 | 65 |
| 16815 Wausau Ave | 0.52mi | 3/2.0 | 1,076 (-6%) | 2mo | $151,000 | $140 | 62 |
| 509 E 161st Pl | 0.69mi | 3/2.0 | 1,176 (+2%) | 4mo | $182,000 | $155 | 58 |
| 16417 Claire Ln | 0.61mi | 3/2.5 | 1,209 (+5%) | 2mo | $254,995 | $211 | 57 |
| 535 E 166th Pl | 0.66mi | 2/1.5 (-1) | 1,200 (+5%) | 2mo | $156,500 | $130 | 55 |
| 503 Marie Dr | 0.62mi | 3/2.0 | 1,056 (-8%) | 5mo | $216,900 | $205 | 51 |
| 459 E 166th St | 0.56mi | 4/2.0 (+1) | 1,300 (+13%) | 1mo | $235,000 | $181 | 44 |
| 519 E 161st St | 0.74mi | 3/2.0 | 1,024 (-11%) | 5mo | $210,000 | $205 | 41 |
Match score weights: distance 35% · size 25% · config 20% · recency 20%. Top-matched comps best support the ARV.
Projected returns pro-forma
-3.0% appreciation · 3.0% rent growth · sell at horizon
- IRR
- -0.6%
- Equity multiple
- 0.98×
- Total profit
- $-1,310
- Equity at exit
- $28,926
- IRR
- 9.2%
- Equity multiple
- 1.71×
- Total profit
- $38,533
- Equity at exit
- $16,774
Cash invested: $54,320 (down + closing). Projections, not guarantees.
Landlord ↔ Tenant lean methodology
- Overall (STATE)
- 43 Moderately Tenant-Leaning
- State Illinois
- 43 Moderately Tenant-Leaning · D+7
- County
- — inherits STATE
- City
- — inherits STATE
ZIP-level market 60473
- Active inventory
- 135
- Price-to-rent
- 5.7×
Monthly cashflow live
- Estimated rent
- $2,854 medium interval (Pro) →
- Mortgage (P&I)
- −$1,017
- Tax from tax record
- −$689 /mo · $8,265/yr
- Insurance
- −$81
- HOA
- −$0
- Vacancy / Maint / Mgmt
- −$599
- Net cashflow
- $468
Break-even live
UW: 25.0% down · 7.5% · 30yr · 1.5% tax · 5.0% vac · 8.0% maint · 8.0% mgmt
Financing live
Cash to close
- Down payment
- $48,500
- Closing costs
- $5,820
- Reserves months
- —
- Total cash needed
- —
Loan-product check · same deal, 3 products live
Conventional
25% down · 7.5% · 30yr
- Down + closing
- —
- Monthly P&I
- —
- Monthly cashflow
- —
- DSCR
- —
- Eligible?
- —
Personal DTI + credit; lowest rate.
DSCR
20% down · 8.5% · 30yr
- Down + closing
- —
- Monthly P&I
- —
- Monthly cashflow
- —
- DSCR
- —
- Eligible?
- —
No personal income docs; deal must DSCR.
Hard money
10% down · 12.0% · 12mo
- Down + closing
- —
- Monthly P&I
- —
- Monthly cashflow
- —
- DSCR
- —
- Eligible?
- —
Short-term bridge; refi at stabilization.
Rent comps 4 comps
| Address | Beds | Baths | Sqft | Rent | $/sqft | DOM | Units | Dist |
|---|---|---|---|---|---|---|---|---|
| 16048 Halsted St Unit 2 Harvey, IL | 3.0 | 1.0 | 1091 | $1,650 | $1.51 | 24d | 1 | 1.13mi |
| 16246 Dobson Ave South Holland, IL | 3.0 | 2.0 | 1250 | $3,170 | $2.54 | 2d | 1 | 1.19mi |
| 15509 Park Ln South Holland, IL | 4.0 | 1.5 | 1200 | $3,400 | $2.83 | 8d | 1 | 1.36mi |
| 15509 Park Ln South Holland, IL | 4.0 | 1.5 | 1200 | $3,400 | $2.83 | 24d | 1 | 1.36mi |
Listing history 42 events
-
2026-06-18days on market $194,000 Active 6 DOM
-
2026-06-17days on market $194,000 Active 5 DOM
-
2026-06-16days on market $194,000 Active 4 DOM
-
2026-06-15days on market $194,000 Active 3 DOM
-
2026-06-13days on market $194,000 Active 1 DOM
-
2026-06-09days on market $194,000 Active 138 DOM
-
2026-06-08days on market $194,000 Active 137 DOM
-
2026-06-07days on market $194,000 Active 136 DOM
-
2026-06-04days on market $194,000 Active 133 DOM
-
2026-06-03days on market $194,000 Active 132 DOM
-
2026-06-02days on market $194,000 Active 131 DOM
-
2026-06-01days on market $194,000 Active 130 DOM
-
2026-05-31days on market $194,000 Active 129 DOM
-
2026-04-24price $194,000
-
2026-03-27price $200,000
-
2026-02-27price $204,000
-
2026-01-31price $210,000
-
2026-01-22$216,000 Active
-
2026-01-22historical
-
2026-01-09price
-
2025-12-05price
-
2025-10-31Active
-
2025-10-31historical
-
2025-10-17price
-
2025-09-27price
-
2025-09-12price
-
2025-09-05price
-
2025-08-29price
-
2025-08-21price
-
2025-08-07Active
-
2018-07-09soldstatus $1,328,000
-
2016-12-30soldstatus $133,000
-
2013-07-25soldstatus $132,500 Closed Sale
-
2013-07-22soldstatus $60,500
-
2013-05-15Contingent
-
2013-05-01soldstatus $60,200 Closed Sale
-
2013-04-03historical Contingent
-
2013-03-23price $75,000 Reactivated
-
2013-03-23status Reactivated
-
2013-01-17historical
-
2012-11-13price $95,000 Price Change
-
2012-07-19$99,000 New
ⓘ Source: listings_history table (triggers on properties + properties_extension) + one-shot
backfill from property_details.listing_events for pre-trigger history.
Tax reassessment forecast IL · Partial reset (capped growth)
- Current annual tax
- $8,265 · $689/mo
- Projected year-2 tax
- $8,265 · $689/mo
- Expected delta
- $0/yr ($0/mo · 0.0%)
ⓘ Screening estimate from a state-policy table — verify with the county assessor before closing.
Climate risk First Street
- Flood 6/10 Major FEMA zone X (unshaded) · 68% chance over 30 yrs
- Wildfire 1/10 Low
- Heat 3/10 Moderate 7 d/yr ≥102°F today · 15 d/yr by 30 yrs out
- Wind 2/10 Low
- Air quality 4/10 Moderate 4 unhealthy d/yr today · 5 by 30 yrs out
Nearby sold comps map
Loading sold comps map…
Walkable amenities ~0.75 mi
Loading nearby amenities…
Taxation est. · year 1
- Rental income
- $34,253
- − Mortgage interest
- −$10,867
- − Property taxes
- −$8,265
- − Insurance
- −$970
- − Repairs & maintenance
- −$2,740
- − Management
- −$2,740
- − Depreciation
- −$5,644
- Taxable income
- $3,027
- Est. tax owed @ 24.0%
- −$726
- After-tax cash flow
- $4,890/yr
For passive investors: Depreciation is non-cash, so a rental often shows a tax loss while cash-flowing — sheltering income. Rental losses are passive: they offset passive income freely, and up to $25,000/yr can offset ordinary (W-2) income if you actively participate and your MAGI is under $100k (phasing out to $0 by $150k); unused losses carry forward. On sale, claimed depreciation is recaptured at up to 25%, and gains may owe capital-gains tax (a 1031 exchange can defer both). Figures are a year-1 estimate at your 24.0% rate — not tax advice; consult a CPA.
Schools (NCES district)
- District
- Thornton Twp Hsd 205
- NCES district ID
- 1738970
- Math proficiency
- 7% ▬ 0.00%
- Reading proficiency
- 8% ▼ -2.00%
- Median HH income
- $43,392
- Composite
- 6.92/100
- National rank
- #9976
- State rank
- #594 of 620 in IL
Livability — South Holland
- Score
- 77/100
- State rank
- #167
- US rank
- #3071
Category grades
Schools grade is shown separately in the Schools card above.
Census & demographics
- Census place
- South Holland, IL
- City population
- 21,407
- Population (ZIP)
- 21,407
Population outlook (Cook County) Hauer SSP2
- Today (2025)
- 5,347,519 people
- By 2030
- 5,357,703 · +0.2%
- By 2040
- 5,324,924 · -0.4%
- By 2050
- 5,230,762 · -2.2%
- By 2075
- 4,785,735 · -10.5%
- By 2100
- 4,188,836 · -21.7%
Race, ethnicity, and origin ACS 2023
- Neighborhood character
- Predominantly Black (75%)
- Race & ethnicity
- Black 75% White 10% Hispanic / Latino 10% Two or more races 3% Asian 1%
- Hispanic origin (detail)
- Mexican 9% Puerto Rican 1%
- Common ancestry
- Iranian 3% Romanian 2%
- Foreign-born
- 6% · Canada, China
- Languages at home
- 87% English-only · Spanish 8% Other Asian/Pacific 1% Russian/Polish/Slavic 1%
Political lean MEDSL · Cook
- 2024 margin
- Solid D (+42.0) · D 70.4% · R 28.4% · Other 1.2%
- 2008→2024 swing
- -11.4pp toward R · 2008: 53.4pp · 2024: 42.0pp
- All cycles
- 2024: D+42.0 2020: D+50.3 2016: D+53.0 2012: D+49.4 2008: D+53.4
Not yet ingested
- Civics
- —
Market trends
- HPI YoY
- ▼ -114.36%
- Current HPI
- 201.2479
- Rent YoY
- —
- Metro
- —
- State GDP YoY
- ▲ 1.59%
- F500 in state
- 60
Industry mix (Fortune 500 HQ in IL)
| Industry | F500 HQs | Revenue |
|---|---|---|
| Insurance | 4 | $201B |
|
||
| Consumer Goods | 4 | $87B |
|
||
| Industrial Machinery | 3 | $64B |
|
||
| Healthcare | 2 | $55B |
|
||
| Retail / Pharmacy | 1 | $148B |
|
||
| Agriculture / Food | 1 | $86B |
|
||
Price history
+96.0% since first listed29 events — show timeline
- 2026-04-24 Price Changed $194,000 MRED as Distributed by MLS Grid
- 2026-03-27 Price Changed $200,000 MRED as Distributed by MLS Grid
- 2026-02-27 Price Changed $204,000 MRED as Distributed by MLS Grid
- 2026-01-31 Price Changed $210,000 MRED as Distributed by MLS Grid
- 2026-01-22 Listing Removed — MRED as Distributed by MLS Grid
- 2026-01-22 Listed $216,000 MRED as Distributed by MLS Grid
- 2026-01-09 Price Changed — MRED as Distributed by MLS Grid
- 2025-12-05 Price Changed — MRED as Distributed by MLS Grid
- 2025-10-31 Listing Removed — MRED as Distributed by MLS Grid
- 2025-10-31 Listed — MRED as Distributed by MLS Grid
- 2025-10-17 Price Changed — MRED as Distributed by MLS Grid
- 2025-09-27 Price Changed — MRED as Distributed by MLS Grid
- 2025-09-12 Price Changed — MRED as Distributed by MLS Grid
- 2025-09-05 Price Changed — MRED as Distributed by MLS Grid
- 2025-08-29 Price Changed — MRED as Distributed by MLS Grid
- 2025-08-21 Price Changed — MRED as Distributed by MLS Grid
- 2025-08-07 Listed — MRED as Distributed by MLS Grid
- 2018-07-09 Sold (Public Records) $1,328,000 Public Records
- 2016-12-30 Sold (Public Records) $133,000 Public Records
- 2013-07-25 Sold (MLS) $132,500 MRED as Distributed by MLS Grid
- 2013-07-22 Sold (Public Records) $60,500 Public Records
- 2013-05-15 Listed — MRED as Distributed by MLS Grid
- 2013-05-01 Sold (MLS) $60,200 MRED as Distributed by MLS Grid
- 2013-04-03 Contingent — MRED as Distributed by MLS Grid
- 2013-03-23 Relisted — MRED as Distributed by MLS Grid
- 2013-03-23 Price Changed $75,000 MRED as Distributed by MLS Grid
- 2013-01-17 Listing Removed — MRED as Distributed by MLS Grid
- 2012-11-13 Price Changed $95,000 MRED as Distributed by MLS Grid
- 2012-07-19 Listed $99,000 MRED as Distributed by MLS Grid
Property tax history
+4.5%/yrLatest (2023): $8,265 · +15.3% YoY. Source: county tax records.
Cash-flow waterfall
monthlySold comps — $/sqft
last 12 mo · ≤1 miLoading sold comps…