3350 Tungsten Mine Rd · Stovall, NC
Flood risk 1/10 · Minimal
- FEMA flood zone
- X (unshaded)
- Chance of flooding over 30 yrs
- 0.0%
- Est. flood insurance / yr
- $507 – $1,088
Fire risk 3/10 · Minor
- Est. fire insurance / yr
- $906 – $1,684
Heat risk 6/10 · Moderate
- Hot days now (above 104°F)
- 7 days/yr
- Hot days in 30 yrs
- 17 days/yr
Wind risk 6/10 · Moderate
- Chance of severe wind over 30 yrs
- 27.0%
Air-quality risk 1/10 · Minimal
- Unhealthy air days now
- 0 days/yr
- Unhealthy air days in 30 yrs
- 0 days/yr
Risk factors via First Street. Map © Google.
Why this score? — see what drove the B grade
The composite is a weighted blend of 9 inputs, each scored 0–100. Each bar is that input's sub-score; the figure is the points it added to the 100-point composite (weight × sub-score).
- Cash flow +30.0/30.0
- DSCR +10.0/10.0
- 1% rule +9.4/10.0
- ARV discount +7.5/15.0
- Appreciation +4.5/10.0
- Livability +3.4/5.0
- Rent growth +2.5/5.0
- Condition / age +2.5/5.0
- Schools +1.9/10.0
$89,000
🖨 Deal sheet 📄 Offer letter ✓ Due diligence
Listing remarks
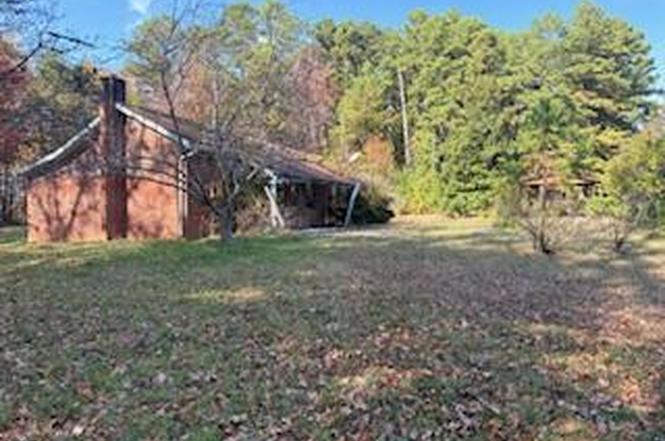
Bring your vision and make this home shine! This brick house sits on 4.6 beautiful acres featuring mature hardwoods and a cleared, open backyard perfect for gardening, recreation, or future expansion. The home needs some work, offering the ideal opportunity for renovation or investment. Located just 6 miles from Kerr Lake's Island Creek Boat Ramp, enjoy easy access to boating, fishing, and outdoor recreation while maintaining the peace and privacy of country living. Don't miss this chance to own acreage close to the lakeâ€''schedule your showing today! Property is being sold as order of sale from Special Proceeding, Vance Co. Please see further information for procedure.
Key facts
- Mature hardwoods
- Peace and privacy
- 4.6 acres
Tags
Property features AI
Finance
- Other: Located in Vance County, postal code 27507
- HOA & community: No association
Exterior
- Parking: 2-space carport; Open parking with about 6 spaces
- Utilities: Well water (see remarks); Septic tank (sewer); secondary status unknown
- Home design: Single-story house
- Construction: Brick construction; Brick/mortar foundation; Shingle roof; Built as a house (one level)
- Exterior features: Approximately 4.67-acre lot; Publicly maintained road access; Directions: Highway 15 north to Bullock, right onto Buckhorn Road, left onto Tungsten Mine Road; property approx. 3 miles on left
Interior
- Bedrooms: 2 bedrooms (both on the main level)
- Flooring: Carpet; Laminate
- Bathrooms: 2 full bathrooms
- Heating & cooling: Heating present (other; see remarks); No central cooling
- Interior features: Carpet and laminate flooring
Neighborhood map
What this means for you Summary
Snapshot
- This is a 3-bed/1.5-bath single-family listed at $89k.
Deal economics
- At list price, monthly cash flow is $440 ($5k/yr) — positive.
- The deal already cash-flows at list — no discount required.
- Meets the 1% rule at list price ($1k rent vs $89k).
- Recommended offer: $78k (12.0% below list) — sets the bar for market timing.
Location & tenants
- Location reads 67/100 on livability (#231 in NC) — a middle-class / working-renter tenant base. Strengths: cost of living A+, housing A+, health & safety A+; Watch: crime F, amenities F, commute F.
- Vance County Schools (rural): math 20% / reading 27% proficiency, ranked #166 of 178 in NC (top 93%) — low school quality limits family demand, transient renter base, plan for 1-2y turnover; 81% free/reduced lunch — lower-income household profile, screen leases tightly.
- Zoned schools: Vance County Middle School (math 13% / reading 17%, grade F, #459 of 475 statewide, top 97%, 797 students, 100% FRL); Vance County High School (math 12% / reading 27%, grade F, #499 of 535 statewide, top 94%, 958 students, 100% FRL) — zoned schools average 100% FRL vs 81% district-wide (19 pts higher); higher-poverty schools than district average — tighter screening recommended.
- Market conditions: 25 active listings in the ZIP; 73 units permitted in Vance County in 2024 (0 in 5+ unit buildings).
Forward outlook
- Local home prices are declining (-0.9%/yr); year-one equity from $615 of loan paydown is wiped out by about $833 of value loss. Plan a longer hold.
- Vance County population projected at -23% by 2050 — secular population decline; favor cash flow + early exit over multi-decade hold.
- At projected returns (-0.9% appreciation + 3.0% rent growth), your $25k cash investment doubles in ~5 years — after that, you're playing with house money.
Negotiation context
- It's been on market 216 days — a 12% lower offer ($78k) is reasonable based on typical stale-listing flexibility.
Risks & watch-outs
- Climate carrying-cost: major wind risk, 27% chance of damaging wind over 30y; extreme-heat days projected 7→17/yr by 2055 (HVAC capex compounding) — expect insurance premiums to compound above CPI over the hold.
Questions for the listing agent
- It's been on market 216 days. Have you received any prior offers? Is the seller open to a 12% concession, seller financing, or rate buy-down credit?
- Built in 1965 — when were the roof, HVAC, electrical panel, plumbing, and water heater last replaced?
- Why hasn't it sold? Are there any deal-killer items the seller is aware of (foundation, flood, title, zoning, code violations)?
- Is there a deadline driving the sale (1031 exchange, divorce, estate, relocation)? That informs how much negotiation room exists.
- Schools are F-rated, which usually means shorter tenancies and higher turnover. Who's the typical renter profile here, and what's been the actual vacancy rate?
- Crime grade is F in this area — have there been break-ins, vandalism, or insurance claims at this property in the last 3 years? What carrier currently insures it and at what premium?
- What's the average days-on-market for RENTAL listings here right now (not sales)? A rising rental-DOM trend means longer vacancies and softer asking-rent achievability than the comps imply.
- What's the recent tenant-quality profile in this submarket — average credit score on applications, eviction rate, late-payment / NSF rate, and stable-employment percentage? A property-management company in the area should have these aggregated.
- How much new for-sale + rental construction is in the pipeline within 1–3 miles? Heavy new supply typically softens prices + rents 12–24 months out; constrained supply supports both.
Investment metrics
- 1% rule
- 1.44% ✓
- Cap rate
- 12.22%
- Cash-on-cash
- 21.17%
- DSCR
- 1.94
- GRM
- 5.8
CMA / ARV
No comps found within radius.
Projected returns pro-forma
-0.94% appreciation · 3.0% rent growth · sell at horizon
- IRR
- 18.9%
- Equity multiple
- 1.86×
- Total profit
- $21,555
- Equity at exit
- $21,757
- IRR
- 24.4%
- Equity multiple
- 3.50×
- Total profit
- $62,322
- Equity at exit
- $23,081
Cash invested: $24,920 (down + closing). Projections, not guarantees.
Landlord ↔ Tenant lean methodology
- Overall (STATE)
- 85 Strongly Landlord-Friendly
- State North Carolina
- 85 Strongly Landlord-Friendly · R+3
- County
- — inherits STATE
- City
- — inherits STATE
ZIP-level market 27507
- Home prices YoY
- -0.4%
- Active inventory
- 25
- Price-to-rent
- 5.8×
Monthly cashflow live
- Estimated rent
- $1,283 medium interval (Pro) →
- Mortgage (P&I)
- −$467
- Tax from tax record
- −$70 /mo · $842/yr
- Insurance
- −$37
- HOA
- −$0
- Vacancy / Maint / Mgmt
- −$269
- Net cashflow
- $440
Break-even live
UW: 25.0% down · 7.5% · 30yr · 1.5% tax · 5.0% vac · 8.0% maint · 8.0% mgmt
Financing live
Cash to close
- Down payment
- $22,250
- Closing costs
- $2,670
- Reserves months
- —
- Total cash needed
- —
Loan-product check · same deal, 3 products live
Conventional
25% down · 7.5% · 30yr
- Down + closing
- —
- Monthly P&I
- —
- Monthly cashflow
- —
- DSCR
- —
- Eligible?
- —
Personal DTI + credit; lowest rate.
DSCR
20% down · 8.5% · 30yr
- Down + closing
- —
- Monthly P&I
- —
- Monthly cashflow
- —
- DSCR
- —
- Eligible?
- —
No personal income docs; deal must DSCR.
Hard money
10% down · 12.0% · 12mo
- Down + closing
- —
- Monthly P&I
- —
- Monthly cashflow
- —
- DSCR
- —
- Eligible?
- —
Short-term bridge; refi at stabilization.
Listing history 14 events
-
2026-06-18days on market $89,000 Active 216 DOM
-
2026-06-17days on market $89,000 Active 215 DOM
-
2026-06-16days on market $89,000 Active 214 DOM
-
2026-06-15days on market $89,000 Active 213 DOM
-
2026-06-13days on market $89,000 Active 211 DOM
-
2026-06-09days on market $89,000 Active 207 DOM
-
2026-06-08days on market $89,000 Active 206 DOM
-
2026-06-07days on market $89,000 Active 205 DOM
-
2026-06-03days on market $89,000 Active 201 DOM
-
2026-06-02days on market $89,000 Active 200 DOM
-
2026-06-01days on market $89,000 Active 199 DOM
-
2026-05-31days on market $89,000 Active 198 DOM
-
2026-03-30price $89,000
-
2025-11-13$98,000 Active
ⓘ Source: listings_history table (triggers on properties + properties_extension) + one-shot
backfill from property_details.listing_events for pre-trigger history.
Tax reassessment forecast NC · Resets to sale price
- Current annual tax
- $842 · $70/mo
- Projected year-2 tax
- $842 · $70/mo
- Expected delta
- $0/yr ($0/mo · 0.0%)
ⓘ Screening estimate from a state-policy table — verify with the county assessor before closing.
Climate risk First Street
- Flood 1/10 Low FEMA zone X (unshaded) · 0% chance over 30 yrs
- Wildfire 3/10 Moderate
- Heat 6/10 Major 7 d/yr ≥104°F today · 17 d/yr by 30 yrs out
- Wind 6/10 Major 27% chance of damaging wind over 30 yrs
- Air quality 1/10 Low 0 unhealthy d/yr today · 0 by 30 yrs out
Nearby sold comps map
Loading sold comps map…
Walkable amenities ~0.75 mi
Loading nearby amenities…
Taxation est. · year 1
- Rental income
- $15,398
- − Mortgage interest
- −$4,985
- − Property taxes
- −$842
- − Insurance
- −$445
- − Repairs & maintenance
- −$1,232
- − Management
- −$1,232
- − Depreciation
- −$2,589
- Taxable income
- $4,073
- Est. tax owed @ 24.0%
- −$977
- After-tax cash flow
- $4,299/yr
For passive investors: Depreciation is non-cash, so a rental often shows a tax loss while cash-flowing — sheltering income. Rental losses are passive: they offset passive income freely, and up to $25,000/yr can offset ordinary (W-2) income if you actively participate and your MAGI is under $100k (phasing out to $0 by $150k); unused losses carry forward. On sale, claimed depreciation is recaptured at up to 25%, and gains may owe capital-gains tax (a 1031 exchange can defer both). Figures are a year-1 estimate at your 24.0% rate — not tax advice; consult a CPA.
Schools (NCES district)
- District
- Vance County Schools
- NCES district ID
- 3704650
- Math proficiency
- 20% ▼ -7.00%
- Reading proficiency
- 27% ▼ -5.00%
- Median HH income
- $34,323
- Composite
- 19.29/100
- National rank
- #8801
- State rank
- #166 of 178 in NC
Livability — Stovall
- Score
- 67/100
- State rank
- #231
- US rank
- #10718
Category grades
Schools grade is shown separately in the Schools card above.
Census & demographics
- City population
- 307
- Population (ZIP)
- 1,983
Population outlook (Vance County) Hauer SSP2
- Today (2025)
- 41,985 people
- By 2030
- 40,286 · -4.0%
- By 2040
- 36,372 · -13.4%
- By 2050
- 32,466 · -22.7%
- By 2075
- 24,229 · -42.3%
- By 2100
- 17,784 · -57.6%
Race, ethnicity, and origin ACS 2023
- Neighborhood character
- Diverse neighborhood (Simpson 0.59)
- Race & ethnicity
- White 59% Two or more races 19% Black 18% Hispanic / Latino 17% Native American 2%
- Hispanic origin (detail)
- Puerto Rican 17%
- Common ancestry
- Serbian 10% Lithuanian 4% Slovak 1%
- Languages at home
- 99% English-only · Spanish 1%
Political lean MEDSL · Vance
- 2024 margin
- D (+13.3) · D 56.3% · R 42.9%
- 2008→2024 swing
- -13.3pp toward R · 2008: 26.6pp · 2024: 13.3pp
- All cycles
- 2024: D+13.3 2020: D+19.2 2016: D+24.6 2012: D+28.3 2008: D+26.6
Not yet ingested
- Civics
- —
Market trends
- HPI YoY
- ▼ -0.94%
- Current HPI
- 257.9832
- Rent YoY
- —
- Metro
- —
- State GDP YoY
- ▲ 3.28%
- F500 in state
- 26
Industry mix (Fortune 500 HQ in NC)
| Industry | F500 HQs | Revenue |
|---|---|---|
| Financial Services | 2 | $213B |
|
||
| Retail | 2 | $95B |
|
||
| Industrial Conglomerate | 1 | $38B |
|
||
| Metals / Steel | 1 | $35B |
|
||
| Utilities | 1 | $30B |
|
||
| Industrial Machinery | 1 | $19B |
|
||
Price history
-9.2% since first listed2 events — show timeline
- 2026-03-30 Price Changed $89,000 TMLS
- 2025-11-13 Listed $98,000 TMLS
Property tax history
+1.2%/yrLatest (2024): $842 · +3.7% YoY. Source: county tax records.
Cash-flow waterfall
monthlySold comps — $/sqft
last 12 mo · ≤1 miLoading sold comps…