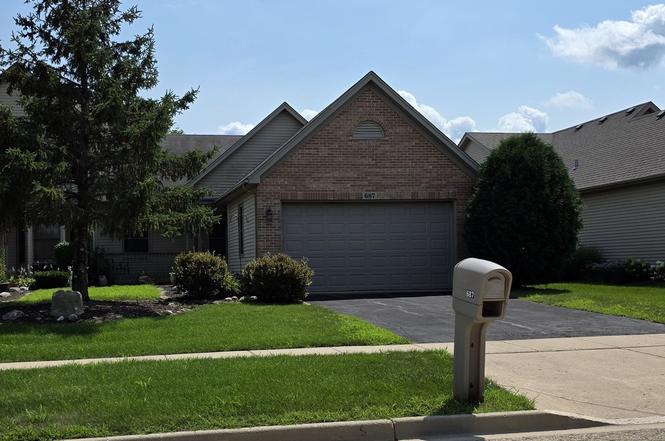
687 Hampshire Dr · Hampshire, IL
Flood risk 1/10 · Minimal
- FEMA flood zone
- X (unshaded)
- Chance of flooding over 30 yrs
- 0.0%
- Est. flood insurance / yr
- $473 – $860
Fire risk 1/10 · Minimal
- Est. fire insurance / yr
- $804 – $1,492
Heat risk 2/10 · Minimal
- Hot days now (above 102°F)
- 7 days/yr
- Hot days in 30 yrs
- 14 days/yr
Wind risk 2/10 · Minimal
- Chance of severe wind over 30 yrs
- 1.0%
Air-quality risk 1/10 · Minimal
- Unhealthy air days now
- 0 days/yr
- Unhealthy air days in 30 yrs
- 0 days/yr
Risk factors via First Street. Map © Google.
Why this score? — see what drove the B- grade
The composite is a weighted blend of 9 inputs, each scored 0–100. Each bar is that input's sub-score; the figure is the points it added to the 100-point composite (weight × sub-score).
- Cash flow +29.4/30.0
- 1% rule +10.0/10.0
- DSCR +10.0/10.0
- ARV discount +7.5/15.0
- Livability +3.6/5.0
- Rent growth +2.5/5.0
- Schools +2.5/10.0
- Condition / age +2.5/5.0
- Appreciation +0.0/10.0
$150,000
🖨 Deal sheet 📄 Offer letter ✓ Due diligence
Listing remarks MLS
There are no remarks available.
Key facts
- $130 HOA
- 2 garage spots
- Built 2003
Neighborhood map
What this means for you Summary
Snapshot
- This is a 2-bed/3.0-bath single-family listed at $150k.
Deal economics
- At list price, monthly cash flow is $532 ($6k/yr) — positive.
- The deal already cash-flows at list — no discount required.
- Meets the 1% rule at list price ($3k rent vs $150k).
- Recommended offer: $141k (6.0% below list) — sets the bar for market timing.
- Cap rate 10.5% vs local median 4.6% in Hampshire — top-decile yield for the area; either an underpriced asset or a hidden risk that comps aren't pricing in. Stress-test before assuming the spread holds.
Location & tenants
- Location reads 71/100 on livability (#350 in IL) — a middle-class / working-renter tenant base. Strengths: crime A+, employment A+, housing A+; Watch: amenities F, commute F, health & safety F.
- CUSD 300 (suburban): math 24% / reading 27% proficiency, ranked #261 of 620 in IL (top 42%) — low school quality limits family demand, transient renter base, plan for 1-2y turnover.
- Market conditions: 254 active listings in the ZIP; 3 comparable units currently listed for rent nearby; rentals leasing fast (median 2d on market — plan ~1-2 weeks tenant-placement turnaround); high-income renter base; 1,944 units permitted in Kane County in 2024 (357 in 5+ unit buildings).
Forward outlook
- Local home prices are declining (-3.0%/yr); year-one equity from $1k of loan paydown is wiped out by about $4k of value loss. Plan a longer hold.
- At projected returns (-3.0% appreciation + 3.0% rent growth), your $42k cash investment doubles in ~8 years — after that, you're playing with house money.
Negotiation context
- It's been on market 78 days — a 6% lower offer ($141k) is reasonable based on typical stale-listing flexibility.
- 3 sale attempts since 9y ago with the ask held roughly flat each time — persistent listings suggest the price (not the market) is what's stuck; bring a comps-based counter.
Risks & watch-outs
- Watch-outs: property tax is 4.0% of price.
Questions for the listing agent
- It's been on market 78 days. Have you received any prior offers? Is the seller open to a 6% concession, seller financing, or rate buy-down credit?
- Property tax is high relative to price — has the assessment been appealed recently, and will the sale trigger a re-assessment?
- What does the HOA fee cover, when was the last increase, and are there any pending special assessments or reserve-fund shortfalls?
- Why hasn't it sold? Are there any deal-killer items the seller is aware of (foundation, flood, title, zoning, code violations)?
- Is there a deadline driving the sale (1031 exchange, divorce, estate, relocation)? That informs how much negotiation room exists.
- What's the average days-on-market for RENTAL listings here right now (not sales)? A rising rental-DOM trend means longer vacancies and softer asking-rent achievability than the comps imply.
- What's the recent tenant-quality profile in this submarket — average credit score on applications, eviction rate, late-payment / NSF rate, and stable-employment percentage? A property-management company in the area should have these aggregated.
- How much new for-sale + rental construction is in the pipeline within 1–3 miles? Heavy new supply typically softens prices + rents 12–24 months out; constrained supply supports both.
Investment metrics
- 1% rule
- 1.70% ✓
- Cap rate
- 10.55%
- Cash-on-cash
- 15.19%
- DSCR
- 1.68
- GRM
- 4.9
CMA / ARV
- ARV (on-the-fly)
- $394,095
- Comps found
- 6
Show comp detail 6 sales within ~0.75 mi
| Address | Dist | Beds/Ba | Sqft | Sold | Price | $/sf | Match |
|---|---|---|---|---|---|---|---|
| 609 Prairieview Pkwy | 0.27mi | 3/3.0 (+1) | 1,800 (+7%) | 3mo | $439,000 | $244 | 68 |
| 519 Sawgrass Ln | 0.11mi | 3/2.0 (+1) | 1,824 (+9%) | 10mo | $433,000 | $237 | 63 |
| 300 Red Hawk Rd | 0.23mi | 3/2.0 (+1) | 1,808 (+8%) | 20mo | $380,000 | $210 | 51 |
| 426 Prairieview Pkwy | 0.38mi | 3/2.0 (+1) | 1,522 (-9%) | 20mo | $358,000 | $235 | 41 |
| 267 Terwilliger Ave | 0.68mi | 3/2.5 (+1) | 1,530 (-9%) | 18mo | $225,000 | $147 | 32 |
| 804 S State St | 0.71mi | 3/1.5 (+1) | 1,536 (-8%) | 14mo | $300,000 | $195 | 30 |
Match score weights: distance 35% · size 25% · config 20% · recency 20%. Top-matched comps best support the ARV.
Projected returns pro-forma
-3.0% appreciation · 3.0% rent growth · sell at horizon
- IRR
- 6.0%
- Equity multiple
- 1.23×
- Total profit
- $9,863
- Equity at exit
- $22,365
- IRR
- 15.5%
- Equity multiple
- 2.27×
- Total profit
- $53,450
- Equity at exit
- $12,969
Cash invested: $42,000 (down + closing). Projections, not guarantees.
Landlord ↔ Tenant lean methodology
- Overall (STATE)
- 43 Moderately Tenant-Leaning
- State Illinois
- 43 Moderately Tenant-Leaning · D+7
- County
- — inherits STATE
- City
- — inherits STATE
ZIP-level market 60140
- Home prices YoY
- -24.6%
- Active inventory
- 254
- Price-to-rent
- 4.9×
Monthly cashflow live
- Estimated rent
- $2,547 medium interval (Pro) →
- Mortgage (P&I)
- −$787
- Tax from tax record
- −$501 /mo · $6,016/yr
- Insurance
- −$62
- HOA
- −$130
- Vacancy / Maint / Mgmt
- −$535
- Net cashflow
- $532
Break-even live
UW: 25.0% down · 7.5% · 30yr · 1.5% tax · 5.0% vac · 8.0% maint · 8.0% mgmt
Financing live
Cash to close
- Down payment
- $37,500
- Closing costs
- $4,500
- Reserves months
- —
- Total cash needed
- —
Loan-product check · same deal, 3 products live
Conventional
25% down · 7.5% · 30yr
- Down + closing
- —
- Monthly P&I
- —
- Monthly cashflow
- —
- DSCR
- —
- Eligible?
- —
Personal DTI + credit; lowest rate.
DSCR
20% down · 8.5% · 30yr
- Down + closing
- —
- Monthly P&I
- —
- Monthly cashflow
- —
- DSCR
- —
- Eligible?
- —
No personal income docs; deal must DSCR.
Hard money
10% down · 12.0% · 12mo
- Down + closing
- —
- Monthly P&I
- —
- Monthly cashflow
- —
- DSCR
- —
- Eligible?
- —
Short-term bridge; refi at stabilization.
Rent comps 3 comps
| Address | Beds | Baths | Sqft | Rent | $/sqft | DOM | Units | Dist |
|---|---|---|---|---|---|---|---|---|
| 179 Terrabrook Way Hampshire, IL | 3.0–4.0 | 2.5 | 1828 | $2,750 | $1.50 | 1d | 1 | 1.27mi |
| 1059 Briar Glen Ct Unit 1059 Hampshire, IL | 2.0 | 2.5 | 1579 | $2,400 | $1.52 | 17d | 1 | 1.43mi |
| 1059 Briar Glen Ct Hampshire, IL | 2.0 | 2.5 | 1579 | $2,350 | $1.49 | 1d | 1 | 1.43mi |
HOA detail
- Monthly dues
- $130 · $1,560/yr
Listing history 11 events
-
2025-10-18status Pending
-
2025-08-03historical Contingent - Continue to Show
-
2025-07-31$150,000 Active
-
2018-01-19soldstatus $2,000,000
-
2018-01-12soldstatus $200,000 Closed Sale 31-char remark
Show marketing remark (31 chars)
There are no remarks available.
-
2018-01-03status Contingent 31-char remark
Show marketing remark (31 chars)
There are no remarks available.
-
2017-10-30historical Contingent 31-char remark
Show marketing remark (31 chars)
There are no remarks available.
-
2017-10-29historical 31-char remark
Show marketing remark (31 chars)
There are no remarks available.
-
2017-09-26price $210,000 31-char remark
Show marketing remark (31 chars)
There are no remarks available.
-
2017-07-14$220,000 New 31-char remark
Show marketing remark (31 chars)
There are no remarks available.
-
2003-07-21soldstatus $194,000
ⓘ Source: listings_history table (triggers on properties + properties_extension) + one-shot
backfill from property_details.listing_events for pre-trigger history.
Tax reassessment forecast IL · Partial reset (capped growth)
- Current annual tax
- $6,016 · $501/mo
- Projected year-2 tax
- $6,016 · $501/mo
- Expected delta
- $0/yr ($0/mo · 0.0%)
ⓘ Screening estimate from a state-policy table — verify with the county assessor before closing.
Climate risk First Street
- Flood 1/10 Low FEMA zone X (unshaded) · 0% chance over 30 yrs
- Wildfire 1/10 Low
- Heat 2/10 Low 7 d/yr ≥102°F today · 14 d/yr by 30 yrs out
- Wind 2/10 Low 100% chance of damaging wind over 30 yrs
- Air quality 1/10 Low 0 unhealthy d/yr today · 0 by 30 yrs out
Nearby sold comps map
Loading sold comps map…
Walkable amenities ~0.75 mi
Loading nearby amenities…
Taxation est. · year 1
- Rental income
- $30,563
- − Mortgage interest
- −$8,402
- − Property taxes
- −$6,016
- − Insurance
- −$750
- − Repairs & maintenance
- −$2,445
- − Management
- −$2,445
- − HOA
- −$1,560
- − Depreciation
- −$4,364
- Taxable income
- $4,581
- Est. tax owed @ 24.0%
- −$1,099
- After-tax cash flow
- $5,280/yr
For passive investors: Depreciation is non-cash, so a rental often shows a tax loss while cash-flowing — sheltering income. Rental losses are passive: they offset passive income freely, and up to $25,000/yr can offset ordinary (W-2) income if you actively participate and your MAGI is under $100k (phasing out to $0 by $150k); unused losses carry forward. On sale, claimed depreciation is recaptured at up to 25%, and gains may owe capital-gains tax (a 1031 exchange can defer both). Figures are a year-1 estimate at your 24.0% rate — not tax advice; consult a CPA.
Schools (NCES district)
- District
- CUSD 300
- NCES district ID
- 1708550
- Math proficiency
- 24% ▼ -12.00%
- Reading proficiency
- 27% ▼ -11.00%
- Median HH income
- $77,706
- Composite
- 25.12/100
- National rank
- #7524
- State rank
- #261 of 620 in IL
Livability — Hampshire
- Score
- 71/100
- State rank
- #350
- US rank
- #7222
Category grades
Schools grade is shown separately in the Schools card above.
Census & demographics
- Census place
- Hampshire, IL
- County
- Kane County · 361,735 people
- City population
- 22,689
- Metro
- Chicago-Naperville-Elgin, IL-IN-WI
- Population (ZIP)
- 22,689
- Household income
- $111,241
- Rent vs Own
- Severe rent burden
- 16.0
Population outlook (Kane County) Hauer SSP2
- Today (2025)
- 559,449 people
- By 2030
- 568,757 · +1.7%
- By 2040
- 575,969 · +3.0%
- By 2050
- 563,477 · +0.7%
- By 2075
- 492,321 · -12.0%
- By 2100
- 380,943 · -31.9%
Race, ethnicity, and origin ACS 2023
- Neighborhood character
- Predominantly White (70%)
- Race & ethnicity
- White 70% Hispanic / Latino 15% Two or more races 7% Asian 6% Black 5%
- Hispanic origin (detail)
- Mexican 11%
- Common ancestry
- Romanian 12% Lithuanian 3% Italian 2%
- Foreign-born
- 11% · Canada, Jamaica
- Languages at home
- 83% English-only · Spanish 11% Russian/Polish/Slavic 2% Tagalog/Filipino 2%
Political lean MEDSL · Kane
- 2024 margin
- Lean D (+9.4) · D 54.0% · R 44.6% · Other 1.4%
- 2008→2024 swing
- -2.4pp toward R · 2008: 11.8pp · 2024: 9.4pp
- All cycles
- 2024: D+9.4 2020: D+14.4 2016: D+8.9 2012: D+0.9 2008: D+11.8
Not yet ingested
- Civics
- —
Market trends
- HPI YoY
- ▼ -71.68%
- Current HPI
- 219.0902
- Rent YoY
- —
- Metro
- Chicago-Naperville-Elgin, IL-IN-WI
- State GDP YoY
- ▲ 1.59%
- F500 in state
- 60
Industry mix (Fortune 500 HQ in IL)
| Industry | F500 HQs | Revenue |
|---|---|---|
| Insurance | 4 | $201B |
|
||
| Consumer Goods | 4 | $87B |
|
||
| Industrial Machinery | 3 | $64B |
|
||
| Healthcare | 2 | $55B |
|
||
| Retail / Pharmacy | 1 | $148B |
|
||
| Agriculture / Food | 1 | $86B |
|
||
Price history
-22.7% since first listed11 events — show timeline
- 2025-10-18 Pending — MRED as Distributed by MLS Grid
- 2025-08-03 Contingent — MRED as Distributed by MLS Grid
- 2025-07-31 Listed $150,000 MRED as Distributed by MLS Grid
- 2018-01-19 Sold (Public Records) $2,000,000 Public Records
- 2018-01-12 Sold (MLS) $200,000 MRED as Distributed by MLS Grid
- 2018-01-03 Relisted — MRED as Distributed by MLS Grid
- 2017-10-30 Contingent — MRED as Distributed by MLS Grid
- 2017-10-29 Listing Removed — MRED as Distributed by MLS Grid
- 2017-09-26 Price Changed $210,000 MRED as Distributed by MLS Grid
- 2017-07-14 Listed $220,000 MRED as Distributed by MLS Grid
- 2003-07-21 Sold (Public Records) $194,000 Public Records
Property tax history
+1.7%/yrLatest (2024): $6,016 · +6.4% YoY. Source: county tax records.
Cash-flow waterfall
monthlySold comps — $/sqft
last 12 mo · ≤1 miLoading sold comps…