 Triplex
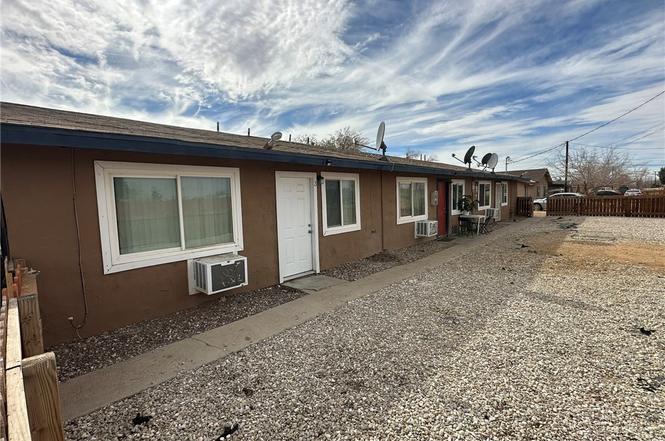
11895 White Ave · Adelanto, CA
Flood risk 1/10 · Minimal
- FEMA flood zone
- X (shaded)
- Chance of flooding over 30 yrs
- 0.0%
- Est. flood insurance / yr
- $507 – $1,088
Fire risk 4/10 · Minor
- Est. fire insurance / yr
- $659 – $1,223
Heat risk 7/10 · Major
- Hot days now (above 99°F)
- 6 days/yr
- Hot days in 30 yrs
- 16 days/yr
Wind risk 1/10 · Minimal
- Chance of severe wind over 30 yrs
- —
Air-quality risk 8/10 · Major
- Unhealthy air days now
- 16 days/yr
- Unhealthy air days in 30 yrs
- 20 days/yr
Risk factors via First Street. Map © Google.
Why this score? — see what drove the C- grade
The composite is a weighted blend of 9 inputs, each scored 0–100. Each bar is that input's sub-score; the figure is the points it added to the 100-point composite (weight × sub-score).
- Cash flow +14.6/30.0
- Appreciation +10.0/10.0
- ARV discount +7.5/15.0
- DSCR +4.4/10.0
- 1% rule +4.0/10.0
- Rent growth +3.7/5.0
- Condition / age +2.5/5.0
- Livability +2.4/5.0
- Schools +2.2/10.0
$495,000
🖨 Deal sheet 📄 Offer letter ✓ Due diligence
Multi-family units
County records classify this as Multi-Family (2-4 Unit). Listing-text estimate: 3 units. confirmed
Listing remarks MLS
* * * * Price Reduction * * * * Presenting 11895 White Ave—an excellent triplex investment opportunity in the growing High Desert rental market. Priced at $525,000, this single-story property features three 2-bedroom, 1-bath units, totaling approximately 2,414 rentable square feet on a 0.21-acre lot. The current annual gross income is $46,140, with market rents supporting a projected gross of $53,820. Operating at a 5.71% current CAP rate, this property provides the potential to push to a 6.76% pro forma CAP with minor rent adjustments. The pro forma GRM is 9.75, providing a solid value-add opportunity for investors seeking reliable cash flow and long-term appreciation.
Key facts
- 9,000 sq ft lot
- Built 1979
- Listed 392 days
Property features AI
Finance
- Other: Lot described as 2–5 units per acre; Lot and living area sourced from assessor/public records
- Financial info: Total of 3 units (triplex); 2+ common walls between units
Exterior
- Utilities: Public/district water; Septic tank sewer
- Home design: Triplex (attached property); Community apartment/common-interest property; Single-story (1 total story); Property has a view; Zoned R-3
- Construction: Year built reported in public records
- Exterior features: No pool
Interior
- Bedrooms: Main level bedrooms: 1
- Bathrooms: 3 full bathrooms; One bathroom on the main level
- Heating & cooling: Wall/window cooling units
- Interior features: Single-level home (one story); All bedrooms located on the main floor; Main-level entry
- Laundry & utility: No laundry on site
Neighborhood map
What this means for you Summary
Snapshot
- This is a 3 × 2-bed/1.0-bath units multifamily listed at $495k.
Deal economics
- At list price, monthly cash flow is $117 ($1k/yr) — positive. Per door: $39/mo.
- The deal already cash-flows at list — no discount required.
- To meet the 1% rule (rent ≥ 1% of price), the offer needs to be $448k (9.5% below list).
- Recommended offer: $436k (12.0% below list) — sets the bar for market timing.
- Cap rate 6.6% vs local median 4.2% in Adelanto — top-decile yield for the area; either an underpriced asset or a hidden risk that comps aren't pricing in. Stress-test before assuming the spread holds.
Location & tenants
- Location reads 47/100 on livability (#1,250 in CA) — a working-class tenant base; expect higher turnover. Strengths: housing A+; Watch: crime D, schools F, amenities F.
- Victor Valley Union High (urban): math 25% / reading 25% proficiency, ranked #407 of 517 in CA (top 79%) — low school quality limits family demand, transient renter base, plan for 1-2y turnover; 72% free/reduced lunch — lower-income household profile, screen leases tightly.
- Market conditions: Rents rising fast (+4.7%/yr); 615 active listings in the ZIP; 5,458 units permitted in San Bernardino County in 2024 (1,500 in 5+ unit buildings).
- At $4,478/mo this rent would consume 78% of the median local household income ($69k/yr) (locally 1345% of renters already pay >50% of income on rent) — very limited rent-growth headroom before tenants either downsize or default.
Forward outlook
- In year one you build about $53k of equity ($3k loan paydown + $50k appreciation (10.0% local appreciation)).
- San Bernardino County population projected at +15% by 2050 — modest demand growth; plan on rents tracking national, not racing it.
- At projected returns (10.0% appreciation + 4.7% rent growth), your $139k cash investment doubles in ~3 years — after that, you're playing with house money.
- By year 2, paydown + projected appreciation supports a ~$85k cash-out refi (75% LTV) — recoverable capital for the next deal without selling this one.
Negotiation context
- It's been on market 392 days — a 12% lower offer ($436k) is reasonable based on typical stale-listing flexibility.
- 5 sale attempts since 11y ago; this cycle's ask has dropped $30k (6%) from the opening price — seller is motivated, your offer sets the floor, not the list.
- Current owner paid $54k; list at $495k implies a 817% gain — meaningful room to come down on a strong offer.
Risks & watch-outs
- Climate carrying-cost: extreme-heat days projected 6→16/yr by 2055 (HVAC capex compounding) — expect insurance premiums to compound above CPI over the hold.
Questions for the listing agent
- It's been on market 392 days. Have you received any prior offers? Is the seller open to a 12% concession, seller financing, or rate buy-down credit?
- Can we see the unit-by-unit rent roll, current vacancy, and any below-market leases? What's the average tenancy length?
- What capital expenditures (roof, boiler, parking lot, exteriors) have been made in the last 5 years, and what's planned in the next 2?
- Built in 1979 — when were the roof, HVAC, electrical panel, plumbing, and water heater last replaced?
- Why hasn't it sold? Are there any deal-killer items the seller is aware of (foundation, flood, title, zoning, code violations)?
- Is there a deadline driving the sale (1031 exchange, divorce, estate, relocation)? That informs how much negotiation room exists.
- Schools are F-rated, which usually means shorter tenancies and higher turnover. Who's the typical renter profile here, and what's been the actual vacancy rate?
- Crime grade is D in this area — have there been break-ins, vandalism, or insurance claims at this property in the last 3 years? What carrier currently insures it and at what premium?
- What's the average days-on-market for RENTAL listings here right now (not sales)? A rising rental-DOM trend means longer vacancies and softer asking-rent achievability than the comps imply.
- What's the recent tenant-quality profile in this submarket — average credit score on applications, eviction rate, late-payment / NSF rate, and stable-employment percentage? A property-management company in the area should have these aggregated.
- How much new apartment / multifamily construction is in the pipeline within 1–3 miles? Heavy new supply (>2% of stock underway) typically softens rents 12–24 months out; light construction supports rent growth.
Investment metrics
- 1% rule
- 0.90% ✗
- Cap rate
- 6.58%
- Cash-on-cash
- 1.01%
- DSCR
- 1.04
- GRM
- 9.2
CMA / ARV
No comps found within radius.
Projected returns pro-forma
10.0% appreciation · 4.68% rent growth · sell at horizon
- IRR
- 25.6%
- Equity multiple
- 3.05×
- Total profit
- $284,792
- Equity at exit
- $445,935
- IRR
- 23.0%
- Equity multiple
- 7.13×
- Total profit
- $849,670
- Equity at exit
- $961,676
Cash invested: $138,600 (down + closing). Projections, not guarantees.
Landlord ↔ Tenant lean methodology
- Overall (STATE)
- 18 Strongly Tenant-Friendly
- State California
- 18 Strongly Tenant-Friendly · D+13
- County
- — inherits STATE
- City
- — inherits STATE
ZIP-level market 92301
- Home prices YoY
- 10.0%
- Rents YoY
- 4.7%
- Active inventory
- 615
- Price-to-rent
- 27.6×
Monthly cashflow live
- Estimated rent
- $4,478 high interval (Pro) →
- Mortgage (P&I)
- −$2,596
- Tax est. 1.5%
- −$619 /mo · $7,425/yr
- Insurance
- −$206
- HOA
- −$0
- Vacancy / Maint / Mgmt
- −$940
- Net cashflow
- $117
Break-even live
3-unit breakdown (identical units grouped — click to expand)
| Units | Beds | Baths | Est. rent |
|---|---|---|---|
| 3× units | 2 | 1 | $4,479 |
| #1 | 2 | 1 | $1,493 |
| #2 | 2 | 1 | $1,493 |
| #3 | 2 | 1 | $1,493 |
| Total (3 units) | $4,478 | ||
UW: 25.0% down · 7.5% · 30yr · 1.5% tax · 5.0% vac · 8.0% maint · 8.0% mgmt
Financing live
Cash to close
- Down payment
- $123,750
- Closing costs
- $14,850
- Reserves months
- —
- Total cash needed
- —
Loan-product check · same deal, 3 products live
Conventional
25% down · 7.5% · 30yr
- Down + closing
- —
- Monthly P&I
- —
- Monthly cashflow
- —
- DSCR
- —
- Eligible?
- —
Personal DTI + credit; lowest rate.
DSCR
20% down · 8.5% · 30yr
- Down + closing
- —
- Monthly P&I
- —
- Monthly cashflow
- —
- DSCR
- —
- Eligible?
- —
No personal income docs; deal must DSCR.
Hard money
10% down · 12.0% · 12mo
- Down + closing
- —
- Monthly P&I
- —
- Monthly cashflow
- —
- DSCR
- —
- Eligible?
- —
Short-term bridge; refi at stabilization.
Listing history 28 events
-
2026-06-18days on market $495,000 Active 392 DOM
-
2026-06-17days on market $495,000 Active 391 DOM
-
2026-06-16days on market $495,000 Active 390 DOM
-
2026-06-15days on market $495,000 Active 389 DOM
-
2026-06-13days on market $495,000 Active 387 DOM
-
2026-06-09days on market $495,000 Active 383 DOM
-
2026-06-08days on market $495,000 Active 382 DOM
-
2026-06-07days on market $495,000 Active 381 DOM
-
2026-06-04days on market $495,000 Active 378 DOM
-
2026-06-03statusdays on market $495,000 Active 377 DOM
-
2026-06-02days on market $495,000 Active Under Contract 376 DOM
-
2026-06-01days on market $495,000 Active Under Contract 375 DOM
-
2026-05-31days on market $495,000 Active Under Contract 374 DOM
-
2026-03-14historical Active Under Contract
Show marketing remark (690 chars)
* * * * Price Reduction * * * * Presenting 11895 White Ave—an excellent triplex investment opportunity in the growing High Desert rental market. Priced at $525,000, this single-story property features three 2-bedroom, 1-bath units, totaling approximately 2,414 rentable square feet on a 0.21-acre lot. The current annual gross income is $46,140, with market rents supporting a projected gross of $53,820. Operating at a 5.71% current CAP rate, this property provides the potential to push to a 6.76% pro forma CAP with minor rent adjustments. The pro forma GRM is 9.75, providing a solid value-add opportunity for investors seeking reliable cash flow and long-term appreciation.
-
2026-03-14historical Active Under Contract 690-char remark
Show marketing remark (690 chars)
* * * * Price Reduction * * * * Presenting 11895 White Ave—an excellent triplex investment opportunity in the growing High Desert rental market. Priced at $525,000, this single-story property features three 2-bedroom, 1-bath units, totaling approximately 2,414 rentable square feet on a 0.21-acre lot. The current annual gross income is $46,140, with market rents supporting a projected gross of $53,820. Operating at a 5.71% current CAP rate, this property provides the potential to push to a 6.76% pro forma CAP with minor rent adjustments. The pro forma GRM is 9.75, providing a solid value-add opportunity for investors seeking reliable cash flow and long-term appreciation.
-
2026-01-06price $495,000 690-char remark
Show marketing remark (690 chars)
* * * * Price Reduction * * * * Presenting 11895 White Ave—an excellent triplex investment opportunity in the growing High Desert rental market. Priced at $525,000, this single-story property features three 2-bedroom, 1-bath units, totaling approximately 2,414 rentable square feet on a 0.21-acre lot. The current annual gross income is $46,140, with market rents supporting a projected gross of $53,820. Operating at a 5.71% current CAP rate, this property provides the potential to push to a 6.76% pro forma CAP with minor rent adjustments. The pro forma GRM is 9.75, providing a solid value-add opportunity for investors seeking reliable cash flow and long-term appreciation.
-
2026-01-06price $495,000
Show marketing remark (690 chars)
* * * * Price Reduction * * * * Presenting 11895 White Ave—an excellent triplex investment opportunity in the growing High Desert rental market. Priced at $525,000, this single-story property features three 2-bedroom, 1-bath units, totaling approximately 2,414 rentable square feet on a 0.21-acre lot. The current annual gross income is $46,140, with market rents supporting a projected gross of $53,820. Operating at a 5.71% current CAP rate, this property provides the potential to push to a 6.76% pro forma CAP with minor rent adjustments. The pro forma GRM is 9.75, providing a solid value-add opportunity for investors seeking reliable cash flow and long-term appreciation.
-
2025-05-22$525,000 Active
-
2025-05-21status Active 690-char remark
Show marketing remark (690 chars)
* * * * Price Reduction * * * * Presenting 11895 White Ave—an excellent triplex investment opportunity in the growing High Desert rental market. Priced at $525,000, this single-story property features three 2-bedroom, 1-bath units, totaling approximately 2,414 rentable square feet on a 0.21-acre lot. The current annual gross income is $46,140, with market rents supporting a projected gross of $53,820. Operating at a 5.71% current CAP rate, this property provides the potential to push to a 6.76% pro forma CAP with minor rent adjustments. The pro forma GRM is 9.75, providing a solid value-add opportunity for investors seeking reliable cash flow and long-term appreciation.
-
2025-05-05price $525,000 690-char remark
Show marketing remark (690 chars)
* * * * Price Reduction * * * * Presenting 11895 White Ave—an excellent triplex investment opportunity in the growing High Desert rental market. Priced at $525,000, this single-story property features three 2-bedroom, 1-bath units, totaling approximately 2,414 rentable square feet on a 0.21-acre lot. The current annual gross income is $46,140, with market rents supporting a projected gross of $53,820. Operating at a 5.71% current CAP rate, this property provides the potential to push to a 6.76% pro forma CAP with minor rent adjustments. The pro forma GRM is 9.75, providing a solid value-add opportunity for investors seeking reliable cash flow and long-term appreciation.
-
2025-04-17$480,000 Active 690-char remark
Show marketing remark (690 chars)
* * * * Price Reduction * * * * Presenting 11895 White Ave—an excellent triplex investment opportunity in the growing High Desert rental market. Priced at $525,000, this single-story property features three 2-bedroom, 1-bath units, totaling approximately 2,414 rentable square feet on a 0.21-acre lot. The current annual gross income is $46,140, with market rents supporting a projected gross of $53,820. Operating at a 5.71% current CAP rate, this property provides the potential to push to a 6.76% pro forma CAP with minor rent adjustments. The pro forma GRM is 9.75, providing a solid value-add opportunity for investors seeking reliable cash flow and long-term appreciation.
-
2015-04-07soldstatus $54,000 514-char remark
Show marketing remark (514 chars)
Dont be fooled @ what you see, property is distressed, gutted & needs lots of work. Once rehabbed it can be quite a lucrative investment. Association Amenities: None Lot Location Type: Standard LocationPAVE Model 14 # of Full Baths: 0 Model 15 # of Full Baths: 0 Model 1 # 1/2 Baths: 0 Model 2 # 1/2 Baths: 0 Model 3 # 1/2 Baths: 0 Model 4 # 1/2 Baths: 0 Model 5 # 1/2 Baths: 0 Model 6 # 1/2 Baths: 0 Model 7 # 1/2 Baths: 0 Model 8 # 1/2 Baths: 0 Model 9 # 1/2 Baths: 0 Model 10 # 1/2 Baths: 0 Model 11 # 1/2 B
-
2015-04-07soldstatus $54,000
Show marketing remark (514 chars)
Dont be fooled @ what you see, property is distressed, gutted & needs lots of work. Once rehabbed it can be quite a lucrative investment. Association Amenities: None Lot Location Type: Standard LocationPAVE Model 14 # of Full Baths: 0 Model 15 # of Full Baths: 0 Model 1 # 1/2 Baths: 0 Model 2 # 1/2 Baths: 0 Model 3 # 1/2 Baths: 0 Model 4 # 1/2 Baths: 0 Model 5 # 1/2 Baths: 0 Model 6 # 1/2 Baths: 0 Model 7 # 1/2 Baths: 0 Model 8 # 1/2 Baths: 0 Model 9 # 1/2 Baths: 0 Model 10 # 1/2 Baths: 0 Model 11 # 1/2 B
-
2015-03-14$68,000 514-char remark
Show marketing remark (514 chars)
Dont be fooled @ what you see, property is distressed, gutted & needs lots of work. Once rehabbed it can be quite a lucrative investment. Association Amenities: None Lot Location Type: Standard LocationPAVE Model 14 # of Full Baths: 0 Model 15 # of Full Baths: 0 Model 1 # 1/2 Baths: 0 Model 2 # 1/2 Baths: 0 Model 3 # 1/2 Baths: 0 Model 4 # 1/2 Baths: 0 Model 5 # 1/2 Baths: 0 Model 6 # 1/2 Baths: 0 Model 7 # 1/2 Baths: 0 Model 8 # 1/2 Baths: 0 Model 9 # 1/2 Baths: 0 Model 10 # 1/2 Baths: 0 Model 11 # 1/2 B
-
2015-03-14$68,000
Show marketing remark (514 chars)
Dont be fooled @ what you see, property is distressed, gutted & needs lots of work. Once rehabbed it can be quite a lucrative investment. Association Amenities: None Lot Location Type: Standard LocationPAVE Model 14 # of Full Baths: 0 Model 15 # of Full Baths: 0 Model 1 # 1/2 Baths: 0 Model 2 # 1/2 Baths: 0 Model 3 # 1/2 Baths: 0 Model 4 # 1/2 Baths: 0 Model 5 # 1/2 Baths: 0 Model 6 # 1/2 Baths: 0 Model 7 # 1/2 Baths: 0 Model 8 # 1/2 Baths: 0 Model 9 # 1/2 Baths: 0 Model 10 # 1/2 Baths: 0 Model 11 # 1/2 B
-
1990-06-15soldstatus $65,000
-
1979-11-13soldstatus $60,000
ⓘ Source: listings_history table (triggers on properties + properties_extension) + one-shot
backfill from property_details.listing_events for pre-trigger history.
Climate risk First Street
- Flood 1/10 Low FEMA zone X (shaded) · 0% chance over 30 yrs
- Wildfire 4/10 Moderate
- Heat 7/10 Severe 6 d/yr ≥99°F today · 16 d/yr by 30 yrs out
- Wind 1/10 Low
- Air quality 8/10 Severe 16 unhealthy d/yr today · 20 by 30 yrs out
Nearby sold comps map
Loading sold comps map…
Walkable amenities ~0.75 mi
Loading nearby amenities…
Taxation est. · year 1
- Rental income
- $53,736
- − Mortgage interest
- −$27,728
- − Property taxes
- −$7,425
- − Insurance
- −$2,475
- − Repairs & maintenance
- −$4,299
- − Management
- −$4,299
- − Depreciation
- −$14,400
- Taxable loss
- −$6,889
- Est. tax savings @ 24.0%
- +$1,653
- After-tax cash flow
- $3,055/yr
For passive investors: Depreciation is non-cash, so a rental often shows a tax loss while cash-flowing — sheltering income. Rental losses are passive: they offset passive income freely, and up to $25,000/yr can offset ordinary (W-2) income if you actively participate and your MAGI is under $100k (phasing out to $0 by $150k); unused losses carry forward. On sale, claimed depreciation is recaptured at up to 25%, and gains may owe capital-gains tax (a 1031 exchange can defer both). Figures are a year-1 estimate at your 24.0% rate — not tax advice; consult a CPA.
Schools (NCES district)
- District
- Victor Valley Union High
- NCES district ID
- 0636972
- Math proficiency
- 25% ▲ 6.00%
- Reading proficiency
- 25% ▼ -12.00%
- Median HH income
- $45,112
- Composite
- 21.6/100
- National rank
- #8296
- State rank
- #407 of 517 in CA
Livability — Adelanto
- Score
- 47/100
- State rank
- #1250
- US rank
- #26338
Category grades
Schools grade is shown separately in the Schools card above.
Census & demographics
- Census place
- Adelanto, CA
- County
- San Bernardino County · 2,030,291 people
- City population
- 38,577
- Metro
- Riverside-San Bernardino-Ontario, CA
- Population (ZIP)
- 38,577
- Household income
- $68,676
- Rent vs Own
- Severe rent burden
- 1345.0
Population outlook (San Bernardino County) Hauer SSP2
- Today (2025)
- 2,300,329 people
- By 2030
- 2,378,907 · +3.4%
- By 2040
- 2,523,137 · +9.7%
- By 2050
- 2,642,388 · +14.9%
- By 2075
- 2,880,769 · +25.2%
- By 2100
- 2,909,436 · +26.5%
Race, ethnicity, and origin ACS 2023
- Neighborhood character
- Predominantly Hispanic (69%)
- Race & ethnicity
- Hispanic / Latino 69% Two or more races 34% Black 15% White 9% Asian 2% Native American 1%
- Hispanic origin (detail)
- Mexican 58%
- Foreign-born
- 18% · Canada
- Languages at home
- 52% English-only · Spanish 46%
Political lean MEDSL · San Bernardino
- 2024 margin
- Toss-up / Even · D 47.5% · R 49.7% · Other 2.8%
- 2008→2024 swing
- -8.5pp toward R · 2008: 6.3pp · 2024: -2.1pp
- All cycles
- 2024: R+2.1 2020: D+10.7 2016: D+9.8 2012: D+5.4 2008: D+6.3
Not yet ingested
- Civics
- —
Market trends
- HPI YoY
- ▲ 41.09%
- Current HPI
- 453.6071
- Rent YoY
- ▲ 4.68%
- Metro
- Riverside-San Bernardino-Ontario, CA
- State GDP YoY
- ▲ 3.21%
- F500 in state
- 116
Industry mix (Fortune 500 HQ in CA)
| Industry | F500 HQs | Revenue |
|---|---|---|
| Technology | 27 | $1,492B |
|
||
| Financial Services | 3 | $174B |
|
||
| Retail | 3 | $44B |
|
||
| Insurance | 3 | $26B |
|
||
| Media / Entertainment | 2 | $115B |
|
||
| Pharmaceuticals / Biotech | 2 | $62B |
|
||
Price history
+725.0% since first listed15 events — show timeline
- 2026-03-14 Contingent — CRMLS
- 2026-03-14 Contingent — CRMLS
- 2026-01-06 Price Changed $495,000 CRMLS
- 2026-01-06 Price Changed $495,000 CRMLS
- 2025-05-22 Listed $525,000 CRMLS
- 2025-05-21 Relisted — CRMLS
- 2025-05-05 Price Changed $525,000 CRMLS
- 2025-04-17 Listed $480,000 CRMLS
- 2015-04-07 Sold (Public Records) $54,000 Public Records
- 2015-04-07 Sold (MLS) $54,000 CRMLS
- 2015-04-07 Sold (MLS) $54,000 SDMLS
- 2015-03-14 Listed $68,000 CRMLS
- 2015-03-14 Listed $68,000 SDMLS
- 1990-06-15 Sold (Public Records) $65,000 Public Records
- 1979-11-13 Sold (Public Records) $60,000 Public Records
Property tax history
-4.9%/yrLatest (2025): $775 · +7.1% YoY. Source: county tax records.
Cash-flow waterfall
monthlySold comps — $/sqft
last 12 mo · ≤1 miLoading sold comps…