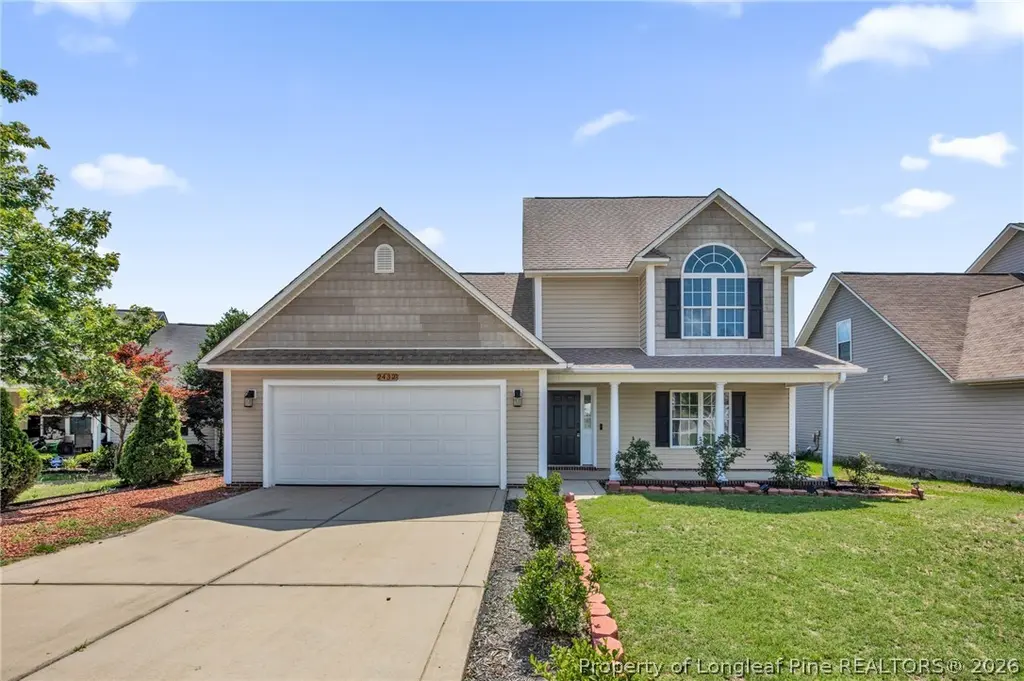
2432 Crosshill St · Eastover, NC
Flood risk 1/10 · Minimal
- FEMA flood zone
- X (unshaded)
- Chance of flooding over 30 yrs
- 0.0%
- Est. flood insurance / yr
- $507 – $1,088
Fire risk 6/10 · Moderate
- Est. fire insurance / yr
- $906 – $1,684
Heat risk 8/10 · Major
- Hot days now (above 106°F)
- 7 days/yr
- Hot days in 30 yrs
- 17 days/yr
Wind risk 6/10 · Moderate
- Chance of severe wind over 30 yrs
- 73.0%
Air-quality risk 1/10 · Minimal
- Unhealthy air days now
- 0 days/yr
- Unhealthy air days in 30 yrs
- 0 days/yr
Risk factors via First Street. Map © Google.
Why this score? — see what drove the D- grade
The composite is a weighted blend of 9 inputs, each scored 0–100. Each bar is that input's sub-score; the figure is the points it added to the 100-point composite (weight × sub-score).
- Appreciation +10.0/10.0
- Cash flow +7.8/30.0
- ARV discount +7.3/15.0
- Livability +3.4/5.0
- Schools +3.1/10.0
- Rent growth +2.5/5.0
- Condition / age +2.5/5.0
- DSCR +1.9/10.0
- 1% rule +1.5/10.0
$325,000
🖨 Deal sheet 📄 Offer letter ✓ Due diligence
Listing remarks MLS
-TRUE 4 BEDROOM 2.5 BATH BRAND NEW HOME! MASTER SUITE IS ON 1ST FLOOR W/3 BDRMS & BONUS RM UPSTAIRS. GOURMET KITCHEN HAS CENTER ISLAND & WALK IN PANTRY. SPACIOUS GREAT RM & AMPLE STORAGE! TRUE 4 BEDROOM 2.5 BATH BRAND NEW HOME! MASTER SUITE IS ON 1ST FLOOR W/3 BDRMS & BONUS RM UPSTAIRS. GOURMET KITCHEN HAS CENTER ISLAND & WALK IN PANTRY. SPACIOUS GREAT RM & AMPLE STORAGE! CALL MARA AT 910.728.9992
Key facts
- Primary suite
- Gourmet kitchen
- Cul-de-sac
Tags
Property features AI
Exterior
- Parking: Attached 2-car garage; 2 covered parking spaces
- Security: Smoke detectors
- Utilities: Public water; Public sewer
- Home design: Single-family residence; Two stories; Vinyl siding
- Construction: Vinyl siding exterior
- Exterior features: Covered patio; Privacy fencing; Located on a cul-de-sac; Cleared, level lot
Interior
- Kitchen: Refrigerator; Dishwasher; Disposal; Range
- Bedrooms: Total rooms: 7
- Flooring: Tile; Vinyl
- Bathrooms: 2 full bathrooms; 1 half bathroom
- Heating & cooling: Heat pump with zoned heating; Central electric air conditioning; Ceiling fans
- Interior features: Ceiling fans; Eat-in kitchen; Kitchen island; Walk-in closets; Factory-built gas-log fireplace
- Laundry & utility: Washer hookup in unit
Neighborhood map
What this means for you Summary
Snapshot
- This is a 4-bed/4.0-bath single-family listed at $325k.
Deal economics
- At list price, monthly cash flow is $-360 ($-4k/yr) — negative.
- To cash-flow at today's rent, offer at most $261k (19.6% below list).
- To meet the 1% rule (rent ≥ 1% of price), the offer needs to be $210k (35.4% below list).
- Recommended offer: $210k (35.4% below list) — sets the bar for 1% rule.
- Cap rate 5.0% vs local median 3.0% in Eastover — top-decile yield for the area; either an underpriced asset or a hidden risk that comps aren't pricing in. Stress-test before assuming the spread holds.
Location & tenants
- Location reads 67/100 on livability (#228 in NC) — a middle-class / working-renter tenant base. Strengths: crime A+, housing A+, cost of living A; Watch: employment C-, amenities F, commute F.
- Cumberland County Schools (urban): math 32% / reading 41% proficiency, ranked #126 of 178 in NC (top 71%) — families likely to look elsewhere, expect single-tenant / working-renter base with shorter leases.
- Zoned schools: Armstrong Elementary (math 43% / reading 40%, grade F, #673 of 1,410 statewide, top 48%, 478 students, 99% FRL); Mac Williams Middle (math 40% / reading 50%, grade D, #160 of 475 statewide, top 35%, 1,151 students, 58% FRL); Cape Fear High (math 75% / reading 47%, grade C+, #202 of 535 statewide, top 39%, 1,529 students, 50% FRL).
- Zoned-school proficiency averages 49% at this address vs 36% district-wide (+13 pts) — the actual schools serving this property are materially stronger than the Cumberland County Schools average implies; a family-tenant draw the district grade alone would hide.
- Market conditions: 222 active listings in the ZIP; 1 comparable units currently listed for rent nearby; 1,125 units permitted in Cumberland County in 2024 (104 in 5+ unit buildings).
Forward outlook
- In year one you build about $35k of equity ($2k loan paydown + $32k appreciation (10.0% local appreciation)).
- By year 2, paydown + projected appreciation supports a ~$56k cash-out refi (75% LTV) — recoverable capital for the next deal without selling this one.
Negotiation context
- Only 8 days on market — expect competitive offers; lowballing is unlikely to land.
- 2 sale attempts since 17y ago with the ask held roughly flat each time — persistent listings suggest the price (not the market) is what's stuck; bring a comps-based counter.
- Current owner paid $185k; list at $325k implies a 76% gain — meaningful room to come down on a strong offer.
Risks & watch-outs
- Climate carrying-cost: major wind risk, 73% chance of damaging wind over 30y; major wildfire risk; extreme-heat days projected 7→17/yr by 2055 (HVAC capex compounding) — expect insurance premiums to compound above CPI over the hold.
Questions for the listing agent
- What do current leases actually rent for vs. the listed asking? Can we see a recent rent roll and the last 12 months of T-12 income?
- Is there a deadline driving the sale (1031 exchange, divorce, estate, relocation)? That informs how much negotiation room exists.
- The area grade is low — what's the realistic commute time and amenity access for the typical tenant pool here? Any planned neighborhood developments (good or bad) we should know about?
- What's the average days-on-market for RENTAL listings here right now (not sales)? A rising rental-DOM trend means longer vacancies and softer asking-rent achievability than the comps imply.
- What's the recent tenant-quality profile in this submarket — average credit score on applications, eviction rate, late-payment / NSF rate, and stable-employment percentage? A property-management company in the area should have these aggregated.
- How much new for-sale + rental construction is in the pipeline within 1–3 miles? Heavy new supply typically softens prices + rents 12–24 months out; constrained supply supports both.
Investment metrics
- 1% rule
- 0.65% ✗
- Cap rate
- 4.96%
- Cash-on-cash
- -4.75%
- DSCR
- 0.79
- GRM
- 12.9
CMA / ARV
- ARV (on-the-fly)
- $323,824
- Comps found
- 4
Show comp detail 4 sales within ~0.75 mi
| Address | Dist | Beds/Ba | Sqft | Sold | Price | $/sf | Match |
|---|---|---|---|---|---|---|---|
| 2401 Crosshill St | 0.10mi | 4/3.5 | 1,977 (-10%) | 5mo | $303,500 | $154 | 73 |
| 2771 Gobbler Ln | 0.20mi | 3/3.0 (-1) | 1,980 (-10%) | 16mo | $287,000 | $145 | 53 |
| 3352 Eastgate St | 0.13mi | 3/2.0 (-1) | 2,000 (-9%) | 22mo | $295,000 | $148 | 48 |
| 2122 Middle Rd | 0.72mi | 3/2.0 (-1) | 2,254 (+3%) | 16mo | $325,000 | $144 | 36 |
Match score weights: distance 35% · size 25% · config 20% · recency 20%. Top-matched comps best support the ARV.
Projected returns pro-forma
10.0% appreciation · 3.0% rent growth · sell at horizon
- IRR
- 20.9%
- Equity multiple
- 2.69×
- Total profit
- $153,941
- Equity at exit
- $292,786
- IRR
- 18.9%
- Equity multiple
- 6.18×
- Total profit
- $471,169
- Equity at exit
- $631,404
Cash invested: $91,000 (down + closing). Projections, not guarantees.
Landlord ↔ Tenant lean methodology
- Overall (STATE)
- 85 Strongly Landlord-Friendly
- State North Carolina
- 85 Strongly Landlord-Friendly · R+3
- County
- — inherits STATE
- City
- — inherits STATE
ZIP-level market 28312
- Home prices YoY
- 6.9%
- Active inventory
- 222
- Price-to-rent
- 12.9×
Monthly cashflow live
- Estimated rent
- $2,100 medium interval (Pro) →
- Mortgage (P&I)
- −$1,704
- Tax from tax record
- −$180 /mo · $2,156/yr
- Insurance
- −$135
- HOA
- −$0
- Vacancy / Maint / Mgmt
- −$441
- Net cashflow
- $-360
Break-even live
UW: 25.0% down · 7.5% · 30yr · 1.5% tax · 5.0% vac · 8.0% maint · 8.0% mgmt
Financing live
Cash to close
- Down payment
- $81,250
- Closing costs
- $9,750
- Reserves months
- —
- Total cash needed
- —
Loan-product check · same deal, 3 products live
Conventional
25% down · 7.5% · 30yr
- Down + closing
- —
- Monthly P&I
- —
- Monthly cashflow
- —
- DSCR
- —
- Eligible?
- —
Personal DTI + credit; lowest rate.
DSCR
20% down · 8.5% · 30yr
- Down + closing
- —
- Monthly P&I
- —
- Monthly cashflow
- —
- DSCR
- —
- Eligible?
- —
No personal income docs; deal must DSCR.
Hard money
10% down · 12.0% · 12mo
- Down + closing
- —
- Monthly P&I
- —
- Monthly cashflow
- —
- DSCR
- —
- Eligible?
- —
Short-term bridge; refi at stabilization.
Rent comps 1 comps
| Address | Beds | Baths | Sqft | Rent | $/sqft | DOM | Units | Dist |
|---|---|---|---|---|---|---|---|---|
| 3108 Buckley Dr Fayetteville, NC | 4.0 | 2.5 | 2300 | $2,100 | $0.91 | 23d | 1 | 1.19mi |
Listing history 7 events
-
2026-06-08status $325,000 Pending 8 DOM
-
2026-06-07days on market $325,000 Active 8 DOM
-
2026-06-03days on market $325,000 Active 4 DOM
-
2026-06-02days on market $325,000 Active 3 DOM
-
2026-06-01days on market $325,000 Active 2 DOM
-
2026-05-31remarks 699-char remark
-
2026-05-31$325,000 Active 1 DOM
ⓘ Source: listings_history table (triggers on properties + properties_extension) + one-shot
backfill from property_details.listing_events for pre-trigger history.
Tax reassessment forecast NC · Resets to sale price
- Current annual tax
- $2,156 · $180/mo
- Projected year-2 tax
- $2,665 · $222/mo
- Expected delta
- +$509/yr (+$42/mo · 23.6%)
ⓘ Screening estimate from a state-policy table — verify with the county assessor before closing.
Climate risk First Street
- Flood 1/10 Low FEMA zone X (unshaded) · 0% chance over 30 yrs
- Wildfire 6/10 Major
- Heat 8/10 Severe 7 d/yr ≥106°F today · 17 d/yr by 30 yrs out
- Wind 6/10 Major 73% chance of damaging wind over 30 yrs
- Air quality 1/10 Low 0 unhealthy d/yr today · 0 by 30 yrs out
Nearby sold comps map
Loading sold comps map…
Walkable amenities ~0.75 mi
Loading nearby amenities…
Taxation est. · year 1
- Rental income
- $25,200
- − Mortgage interest
- −$18,205
- − Property taxes
- −$2,156
- − Insurance
- −$1,625
- − Repairs & maintenance
- −$2,016
- − Management
- −$2,016
- − Depreciation
- −$9,455
- Taxable loss
- −$10,272
- Est. tax savings @ 24.0%
- +$2,465
- After-tax cash flow
- $-1,860/yr
For passive investors: Depreciation is non-cash, so a rental often shows a tax loss while cash-flowing — sheltering income. Rental losses are passive: they offset passive income freely, and up to $25,000/yr can offset ordinary (W-2) income if you actively participate and your MAGI is under $100k (phasing out to $0 by $150k); unused losses carry forward. On sale, claimed depreciation is recaptured at up to 25%, and gains may owe capital-gains tax (a 1031 exchange can defer both). Figures are a year-1 estimate at your 24.0% rate — not tax advice; consult a CPA.
Schools (NCES district)
- District
- Cumberland County Schools
- NCES district ID
- 3700011
- Math proficiency
- 32% ▼ -2.00%
- Reading proficiency
- 41% ▼ -1.00%
- Median HH income
- $44,168
- Composite
- 31.0/100
- National rank
- #6096
- State rank
- #126 of 178 in NC
Livability — Eastover
- Score
- 67/100
- State rank
- #228
- US rank
- #10689
Category grades
Schools grade is shown separately in the Schools card above.
Census & demographics
- Census place
- Eastover, NC
- Population (ZIP)
- 19,889
Population outlook (Cumberland County) Hauer SSP2
- Today (2025)
- 330,855 people
- By 2030
- 333,523 · +0.8%
- By 2040
- 335,583 · +1.4%
- By 2050
- 335,325 · +1.4%
- By 2075
- 342,853 · +3.6%
- By 2100
- 340,698 · +3.0%
Race, ethnicity, and origin ACS 2023
- Neighborhood character
- Diverse neighborhood (Simpson 0.61)
- Race & ethnicity
- White 55% Black 29% Two or more races 8% Hispanic / Latino 8% Native American 2%
- Hispanic origin (detail)
- Mexican 4% Puerto Rican 2%
- Common ancestry
- Slovak 3% Serbian 2% Italian 2%
- Foreign-born
- 4% · Canada
- Languages at home
- 93% English-only · Spanish 5% French/Haitian/Cajun 1%
Political lean MEDSL · Cumberland
- 2024 margin
- D (+13.4) · D 56.1% · R 42.7% · Other 1.2%
- 2008→2024 swing
- -4.3pp toward R · 2008: 17.7pp · 2024: 13.4pp
- All cycles
- 2024: D+13.4 2020: D+16.6 2016: D+16.0 2012: D+19.7 2008: D+17.7
Not yet ingested
- Civics
- —
Market trends
- HPI YoY
- ▲ 19.75%
- Current HPI
- 306.7749
- Rent YoY
- —
- Metro
- —
- State GDP YoY
- ▲ 3.28%
- F500 in state
- 26
Industry mix (Fortune 500 HQ in NC)
| Industry | F500 HQs | Revenue |
|---|---|---|
| Financial Services | 2 | $213B |
|
||
| Retail | 2 | $95B |
|
||
| Industrial Conglomerate | 1 | $38B |
|
||
| Metals / Steel | 1 | $35B |
|
||
| Utilities | 1 | $30B |
|
||
| Industrial Machinery | 1 | $19B |
|
||
Price history
+400.0% since first listed4 events — show timeline
- 2026-05-30 Listed $325,000 LPRMLS
- 2010-04-30 Sold (MLS) $184,900 TMLS
- 2009-12-01 Listed $186,900 TMLS
- 2009-11-06 Sold (Public Records) $65,000 Public Records
Property tax history
+0.9%/yrLatest (2025): $2,156 · +31.1% YoY. Source: county tax records.
Cash-flow waterfall
monthlySold comps — $/sqft
last 12 mo · ≤1 miLoading sold comps…