 Multi-family
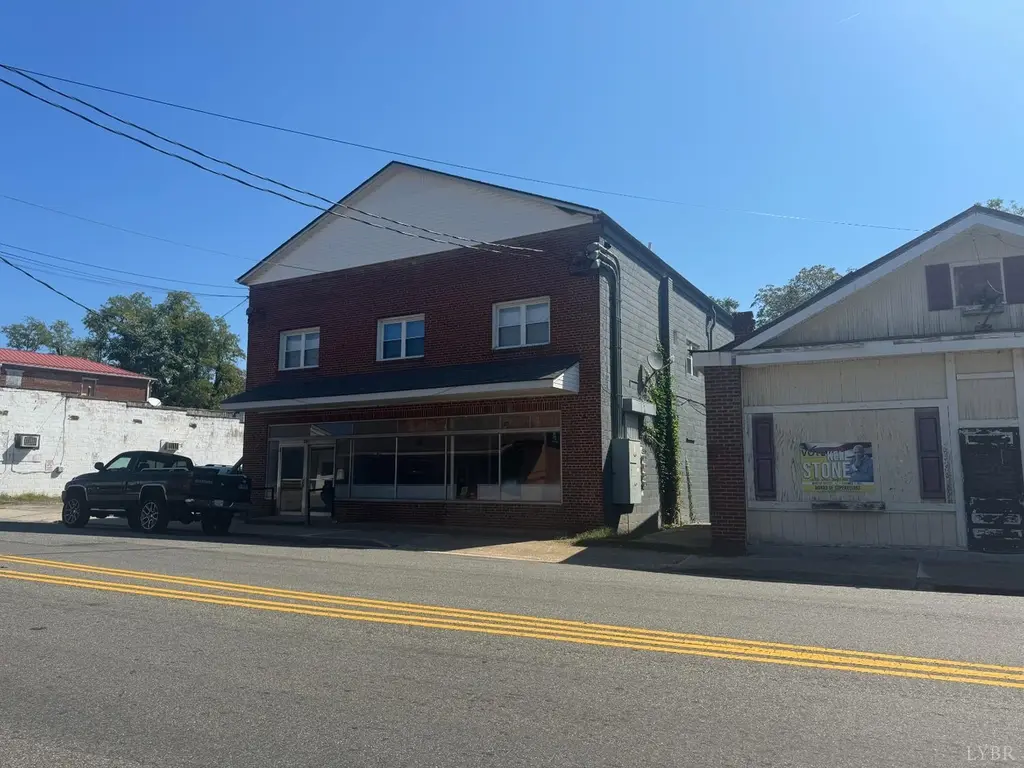
201 S Main St · Gretna, VA
Flood risk No data
- FEMA flood zone
- —
- Chance of flooding over 30 yrs
- —
- Est. flood insurance / yr
- —
Fire risk No data
- Est. fire insurance / yr
- —
Heat risk No data
- Hot days now (above threshold)
- —
- Hot days in 30 yrs
- —
Wind risk No data
- Chance of severe wind over 30 yrs
- —
Air-quality risk No data
- Unhealthy air days now
- —
- Unhealthy air days in 30 yrs
- —
Risk factors via First Street. Map © Google.
Why this score? — see what drove the B+ grade
The composite is a weighted blend of 9 inputs, each scored 0–100. Each bar is that input's sub-score; the figure is the points it added to the 100-point composite (weight × sub-score).
- Cash flow +30.0/30.0
- 1% rule +10.0/10.0
- DSCR +10.0/10.0
- ARV discount +7.5/15.0
- Appreciation +6.0/10.0
- Schools +6.0/10.0
- Condition / age +3.8/5.0
- Livability +3.7/5.0
- Rent growth +2.5/5.0
$399,900
🖨 Deal sheet (PDF) 📄 Offer letter ✓ Due diligence
Multi-family units
County records classify this as Multi-Family (5+ Unit). Listing-text estimate: 1 unit. estimate disagrees with records
5+ unit building — per-unit beds/baths from public records are typically unavailable; the breakdown below (if shown) is an estimate from the listing text.
Listing remarks MLS
Investment opportunity! This two-story property features a retail space on the ground level and seven residential units on the second floor. The residential units consist of six efficiency apartments and one 1-bedroom unit. Each unit is equipped with ranges, refrigerators, and insulated windows. Tenants enjoy the comfort of central air and heat, provided by separate heat pump. The main-level retail space, while currently vacant, offers a lease potential of $1,500.00 to $2,500.00 per month. It has oil heat and central air. Owner covers insurance, electricity for common areas, exterior maintenance, water/sewer, and property taxes. Showings for one apartment unit and the street-level retail space can be scheduled prior to contract signing. The remaining six residential units will be shown post-contract, with buyer approval required at the time of any inspections. Don't miss this unique opportunity to own a mixed-use property with great rental income potential!
Key facts
- Mixed use property
- Heat pump
- Two story property
Tags
Neighborhood map
What this means for you Summary
Snapshot
- This is a multifamily listed at $400k. Condition is rated good.
Deal economics
- At list price, monthly cash flow is $3k ($30k/yr) — positive.
- The deal already cash-flows at list — no discount required.
- Meets the 1% rule at list price ($7k rent vs $400k).
- Recommended offer: $352k (12.0% below list) — sets the bar for market timing.
- Cap rate 13.8% vs local median 5.5% in Gretna — top-decile yield for the area; either an underpriced asset or a hidden risk that comps aren't pricing in. Stress-test before assuming the spread holds.
Location & tenants
- Location reads 74/100 on livability (#157 in VA, #4,927 nationally) — a middle-class / working-renter tenant base. Strengths: crime A+, cost of living A+, health & safety A+; Watch: amenities F, commute F, employment F.
- Pittsylvania County Public School District (rural): math 65% / reading 78% proficiency, ranked #22 of 131 in VA (top 17%) — strong family-tenant draw, lease renewals of 3-5y typical.
- Market conditions: 81 active listings in the ZIP; 72 units permitted in Pittsylvania County in 2024 (0 in 5+ unit buildings).
Forward outlook
- In year one you build about $10k of equity ($3k loan paydown + $8k appreciation (1.9% local appreciation)).
- Pittsylvania County population projected at -22% by 2050 — secular population decline; favor cash flow + early exit over multi-decade hold.
- At projected returns (1.9% appreciation + 3.0% rent growth), your $112k cash investment doubles in ~3 years — after that, you're playing with house money.
- By year 4, paydown + projected appreciation supports a ~$36k cash-out refi (75% LTV) — recoverable capital for the next deal without selling this one.
Negotiation context
- It's been on market 227 days — a 12% lower offer ($352k) is reasonable based on typical stale-listing flexibility.
Questions for the listing agent
- It's been on market 227 days. Have you received any prior offers? Is the seller open to a 12% concession, seller financing, or rate buy-down credit?
- Why hasn't it sold? Are there any deal-killer items the seller is aware of (foundation, flood, title, zoning, code violations)?
- Is there a deadline driving the sale (1031 exchange, divorce, estate, relocation)? That informs how much negotiation room exists.
- Schools are B-rated — typically a magnet for longer-tenancy family renters. What's the average tenant stay here, and is there a school-zone premium baked into asking?
- What's the average days-on-market for RENTAL listings here right now (not sales)? A rising rental-DOM trend means longer vacancies and softer asking-rent achievability than the comps imply.
- What's the recent tenant-quality profile in this submarket — average credit score on applications, eviction rate, late-payment / NSF rate, and stable-employment percentage? A property-management company in the area should have these aggregated.
- How much new apartment / multifamily construction is in the pipeline within 1–3 miles? Heavy new supply (>2% of stock underway) typically softens rents 12–24 months out; light construction supports rent growth.
Investment metrics
- 1% rule
- 1.67% ✓
- Cap rate
- 13.81%
- Cash-on-cash
- 26.85%
- DSCR
- 2.19
- GRM
- 5.0
CMA / ARV
No comps found within radius.
Projected returns pro-forma
1.91% appreciation · 3.0% rent growth · sell at horizon
- IRR
- 30.9%
- Equity multiple
- 2.66×
- Total profit
- $185,387
- Equity at exit
- $155,902
- IRR
- 32.3%
- Equity multiple
- 5.16×
- Total profit
- $465,747
- Equity at exit
- $223,104
Cash invested: $111,972 (down + closing). Projections, not guarantees.
Landlord ↔ Tenant lean methodology
- Overall (STATE)
- 55 Moderately Landlord-Leaning
- State Virginia
- 55 Moderately Landlord-Leaning · D+2
- County
- — inherits STATE
- City
- — inherits STATE
ZIP-level market 24557
- Home prices YoY
- 1.2%
- Active inventory
- 81
- Price-to-rent
- 35.0×
Monthly cashflow live
- Estimated rent
- $6,670 medium interval (Pro) →
- Mortgage (P&I)
- −$2,097
- Tax est. 1.5%
- −$500 /mo · $5,998/yr
- Insurance
- −$167
- HOA
- −$0
- Vacancy / Maint / Mgmt
- −$1,401
- Net cashflow
- $2,506
Break-even live
Sensitivity live
| Price | -10% $2,782 | -5% $2,644 | +0% $2,506 | +5% $2,367 | +10% $2,229 |
|---|---|---|---|---|---|
| Rent | -10% $1,979 | -5% $2,242 | +0% $2,506 | +5% $2,769 | +10% $3,033 |
| Rate | -1.0pp $2,707 | -0.5pp $2,607 | base $2,506 | +0.5pp $2,402 | +1.0pp $2,297 |
7-unit breakdown (identical units grouped — click to expand)
| Units | Beds | Baths | Est. rent |
|---|---|---|---|
| 7× units | 1 | 1 | $6,671 |
| #1 | 1 | 1 | $953 |
| #2 | 1 | 1 | $953 |
| #3 | 1 | 1 | $953 |
| #4 | 1 | 1 | $953 |
| #5 | 1 | 1 | $953 |
| #6 | 1 | 1 | $953 |
| #7 | 1 | 1 | $953 |
| Total (7 units) | $6,670 | ||
UW: 25.0% down · 7.5% · 30yr · 1.5% tax · 5.0% vac · 8.0% maint · 8.0% mgmt
Financing live
Cash to close
- Down payment
- $99,975
- Closing costs
- $11,997
- Reserves months
- —
- Total cash needed
- —
Loan-product check · same deal, 3 products live
Conventional
25% down · 7.5% · 30yr
- Down + closing
- —
- Monthly P&I
- —
- Monthly cashflow
- —
- DSCR
- —
- Eligible?
- —
Personal DTI + credit; lowest rate.
DSCR
20% down · 8.5% · 30yr
- Down + closing
- —
- Monthly P&I
- —
- Monthly cashflow
- —
- DSCR
- —
- Eligible?
- —
No personal income docs; deal must DSCR.
Hard money
10% down · 12.0% · 12mo
- Down + closing
- —
- Monthly P&I
- —
- Monthly cashflow
- —
- DSCR
- —
- Eligible?
- —
Short-term bridge; refi at stabilization.
Listing history 17 events
-
2026-06-19days on market $399,900 Active 227 DOM
-
2026-06-18days on market $399,900 Active 226 DOM
-
2026-06-17days on market $399,900 Active 225 DOM
-
2026-06-16days on market $399,900 Active 224 DOM
-
2026-06-15days on market $399,900 Active 223 DOM
-
2026-06-14days on market $399,900 Active 221 DOM
-
2026-06-13days on market $399,900 Active 220 DOM
-
2026-06-10days on market $399,900 Active 218 DOM
-
2026-06-09days on market $399,900 Active 217 DOM
-
2026-06-08days on market $399,900 Active 216 DOM
-
2026-06-07pricedays on market $399,900 Active 215 DOM
-
2026-06-03days on market $425,000 Active 211 DOM
-
2026-06-02days on market $425,000 Active 210 DOM
-
2026-06-01days on market $425,000 Active 209 DOM
-
2026-05-31days on market $425,000 Active 208 DOM
-
2026-05-30days on market $425,000 Active 207 DOM
-
2025-11-04$425,000 Active 971-char remark
Show marketing remark (971 chars)
Investment opportunity! This two-story property features a retail space on the ground level and seven residential units on the second floor. The residential units consist of six efficiency apartments and one 1-bedroom unit. Each unit is equipped with ranges, refrigerators, and insulated windows. Tenants enjoy the comfort of central air and heat, provided by separate heat pump. The main-level retail space, while currently vacant, offers a lease potential of $1,500.00 to $2,500.00 per month. It has oil heat and central air. Owner covers insurance, electricity for common areas, exterior maintenance, water/sewer, and property taxes. Showings for one apartment unit and the street-level retail space can be scheduled prior to contract signing. The remaining six residential units will be shown post-contract, with buyer approval required at the time of any inspections. Don't miss this unique opportunity to own a mixed-use property with great rental income potential!
ⓘ Source: listings_history table (triggers on properties + properties_extension) + one-shot
backfill from property_details.listing_events for pre-trigger history.
Nearby sold comps map
Loading sold comps map…
Walkable amenities ~0.75 mi
Loading nearby amenities…
Taxation est. · year 1
- Rental income
- $80,040
- − Mortgage interest
- −$22,401
- − Property taxes
- −$5,998
- − Insurance
- −$2,000
- − Repairs & maintenance
- −$6,403
- − Management
- −$6,403
- − Depreciation
- −$11,633
- Taxable income
- $25,202
- Est. tax owed @ 24.0%
- −$6,048
- After-tax cash flow
- $24,020/yr
For passive investors: Depreciation is non-cash, so a rental often shows a tax loss while cash-flowing — sheltering income. Rental losses are passive: they offset passive income freely, and up to $25,000/yr can offset ordinary (W-2) income if you actively participate and your MAGI is under $100k (phasing out to $0 by $150k); unused losses carry forward. On sale, claimed depreciation is recaptured at up to 25%, and gains may owe capital-gains tax (a 1031 exchange can defer both). Figures are a year-1 estimate at your 24.0% rate — not tax advice; consult a CPA.
Condition & rehab AI · 13 photos
This multi-family property offers a good investment opportunity with cosmetic updates needed, primarily focusing on painting and bathroom fixtures to enhance its resale and rental value.
Repairs flagged
- Minor Bathroom walls — Some discoloration and minor damage observed.
Value-add opportunities
- Both Paint interior walls — Fresh paint enhances curb appeal and interior aesthetics, benefiting both resale and rental.
- Both Replace bathroom fixtures — Upgrading dated fixtures improves functionality and appeal, benefiting both resale and rental.
Renovation cost estimate screening
| Repair item | Severity | Est. cost |
|---|---|---|
| Bathroom walls · Some discoloration and minor damage observed. | Minor | $500–3,000 |
| Total estimated repair cost · 1 items | $500–3,000 |
Value-add ROI direction
- Both Paint interior walls — Fresh paint enhances curb appeal and interior aesthetics, benefiting both resale and rental. ↑
- Both Replace bathroom fixtures — Upgrading dated fixtures improves functionality and appeal, benefiting both resale and rental. ↑
ⓘ Cost ranges are severity-bucket heuristics (US national rule-of-thumb). Get contractor quotes + a written scope before underwriting a rehab budget.
Schools (NCES district)
- District
- Pittsylvania County Public School District
- NCES district ID
- 5102940
- Math proficiency
- 65% ▼ -22.00%
- Reading proficiency
- 78% ▼ -4.00%
- Median HH income
- $41,672
- Composite
- 59.77/100
- National rank
- #900
- State rank
- #22 of 131 in VA
Livability — Gretna
- Score
- 74/100
- State rank
- #157
- US rank
- #4927
Category grades
Schools grade is shown separately in the Schools card above.
Census & demographics
- Census place
- Gretna, VA
- Population (ZIP)
- 7,832
Population outlook (Pittsylvania County) Hauer SSP2
- Today (2025)
- 58,725 people
- By 2030
- 56,388 · -4.0%
- By 2040
- 51,088 · -13.0%
- By 2050
- 45,875 · -21.9%
- By 2075
- 36,555 · -37.8%
- By 2100
- 28,288 · -51.8%
Race, ethnicity, and origin ACS 2023
- Neighborhood character
- Predominantly White (76%)
- Race & ethnicity
- White 76% Black 20% Two or more races 2% Hispanic / Latino 2%
- Common ancestry
- Slovak 2% Serbian 1% Lithuanian 1%
- Foreign-born
- 1% · Canada
- Languages at home
- 99% English-only · Spanish 1%
Political lean MEDSL · Pittsylvania
- 2024 margin
- Solid R (+43.1) · D 28.1% · R 71.3%
- 2008→2024 swing
- -19.1pp toward R · 2008: -24.0pp · 2024: -43.1pp
- All cycles
- 2024: R+43.1 2020: R+39.8 2016: R+39.6 2012: R+27.5 2008: R+24.0
Not yet ingested
- Civics
- —
Market trends
- HPI YoY
- ▲ 1.91%
- Current HPI
- 160.7742
- Rent YoY
- —
- Metro
- —
- State GDP YoY
- ▲ 2.40%
- F500 in state
- 50
Industry mix (Fortune 500 HQ in VA)
| Industry | F500 HQs | Revenue |
|---|---|---|
| Aerospace / Defense | 4 | $236B |
|
||
| Technology / Defense | 3 | $32B |
|
||
| Financial Services | 2 | $176B |
|
||
| Utilities | 2 | $27B |
|
||
| Insurance | 2 | $25B |
|
||
| Technology | 2 | $15B |
|
||
Price history
1 event — show timeline
- 2025-11-04 Listed $425,000 LMLS
Cash-flow waterfall
monthlySold comps — $/sqft
last 12 mo · ≤1 miLoading sold comps…