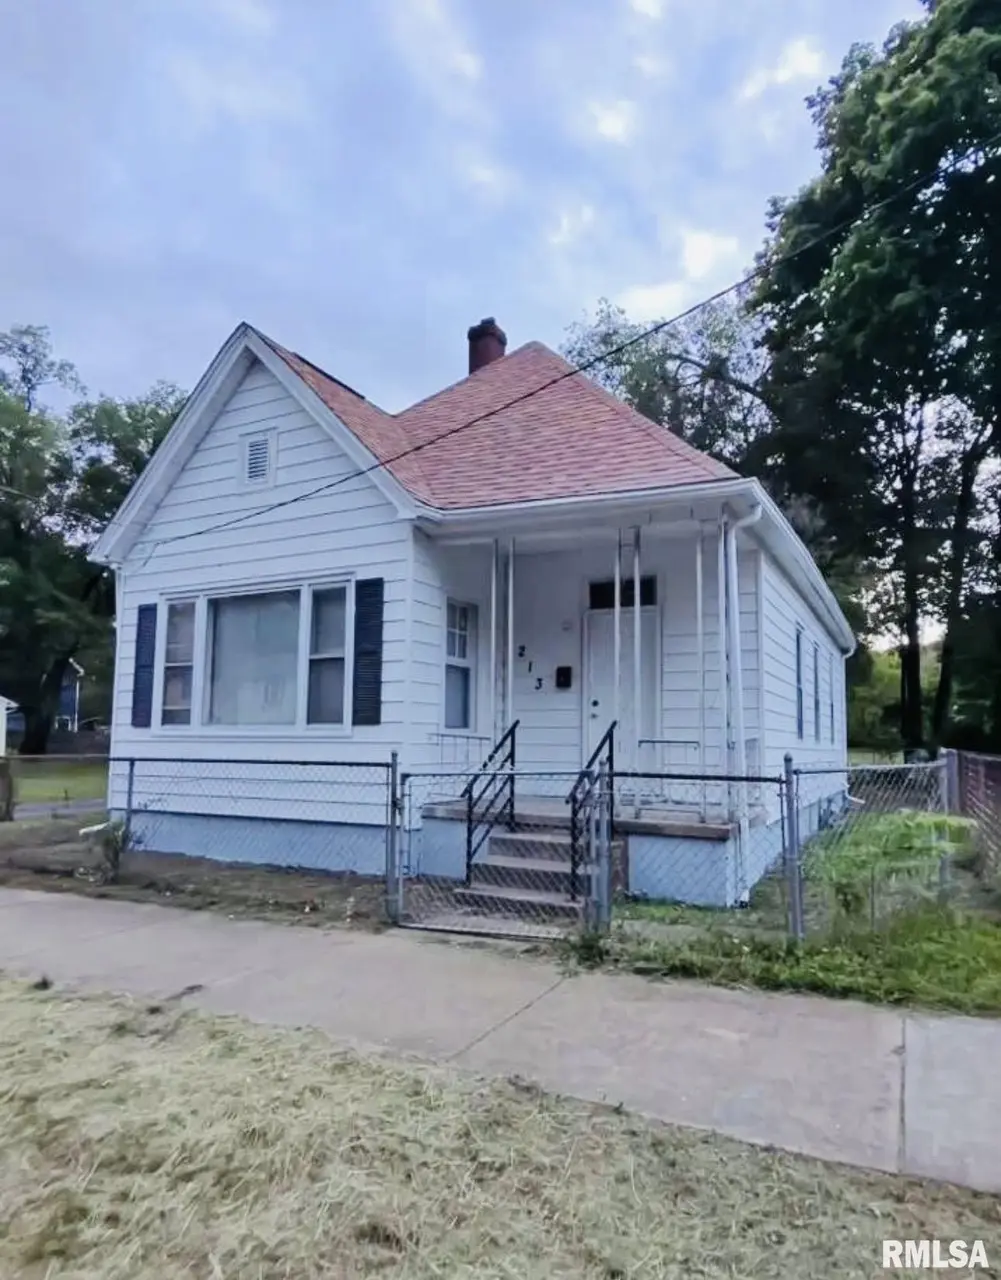
213 N Webster St · Peoria, IL
Flood risk 7/10 · Major
- FEMA flood zone
- X
- Chance of flooding over 30 yrs
- 0.77%
- Est. flood insurance / yr
- $473 – $860
Fire risk 1/10 · Minimal
- Est. fire insurance / yr
- $804 – $1,492
Heat risk 3/10 · Minor
- Hot days now (above 105°F)
- 7 days/yr
- Hot days in 30 yrs
- 18 days/yr
Wind risk 2/10 · Minimal
- Chance of severe wind over 30 yrs
- 1.0%
Air-quality risk 3/10 · Minor
- Unhealthy air days now
- 1 days/yr
- Unhealthy air days in 30 yrs
- 3 days/yr
Risk factors via First Street. Map © Google.
Why this score? — see what drove the B- grade
The composite is a weighted blend of 9 inputs, each scored 0–100. Each bar is that input's sub-score; the figure is the points it added to the 100-point composite (weight × sub-score).
- Cash flow +30.0/30.0
- 1% rule +10.0/10.0
- DSCR +10.0/10.0
- Appreciation +5.3/10.0
- Livability +3.7/5.0
- Rent growth +2.5/5.0
- Condition / age +2.5/5.0
- Schools +1.1/10.0
- ARV discount +0.0/15.0
$39,000
🖨 Deal sheet 📄 Offer letter ✓ Due diligence
Listing remarks MLS
Great investment opportunity in Peoria. Was perviously rented for $900 a month.
Key facts
- Mechanicals updated
- New plumbing
- Good roof
Tags
Neighborhood map
What this means for you Summary
Snapshot
- This is a 2-bed/1.0-bath single-family listed at $39k.
Deal economics
- At list price, monthly cash flow is $457 ($5k/yr) — positive.
- The deal already cash-flows at list — no discount required.
- Meets the 1% rule at list price ($948 rent vs $39k).
- Cap rate 22.1% vs local median 5.6% in Peoria — top-decile yield for the area; either an underpriced asset or a hidden risk that comps aren't pricing in. Stress-test before assuming the spread holds.
Location & tenants
- Location reads 73/100 on livability (#270 in IL) — a middle-class / working-renter tenant base. Strengths: commute A+, cost of living A+, housing A+; Watch: employment D+, crime F.
- Peoria SD 150 (urban): math 11% / reading 14% proficiency, ranked #554 of 620 in IL (top 89%) — low school quality limits family demand, transient renter base, plan for 1-2y turnover; 70% free/reduced lunch — lower-income household profile, screen leases tightly.
- Zoned schools: Manual High School (math 2% / reading 2%, grade F, #659 of 693 statewide, top 100%, 656 students, 0% FRL) — zoned schools average 0% FRL vs 70% district-wide (70 pts lower); this property's tenant base skews higher-income than the district average.
- Market conditions: 42 active listings in the ZIP; 25 comparable units currently listed for rent nearby; rentals leasing fast (median 13d on market — plan ~1-2 weeks tenant-placement turnaround); lower-income renter base — watch delinquency; 73 units permitted in Peoria County in 2024 (0 in 5+ unit buildings).
- This rent runs 43% of the median local income ($26k/yr) — at the standard rent-burdened threshold; future hikes will face affordability resistance.
Forward outlook
- In year one you build about $517 of equity ($270 loan paydown + $247 appreciation (0.6% local appreciation)).
- Peoria County population projected at -11% by 2050 — secular population decline; favor cash flow + early exit over multi-decade hold.
- At projected returns (0.6% appreciation + 3.0% rent growth), your $11k cash investment doubles in ~2 years — after that, you're playing with house money.
Negotiation context
- Only 3 days on market — expect competitive offers; lowballing is unlikely to land.
- 3 sale attempts with the ask held roughly flat each time — persistent listings suggest the price (not the market) is what's stuck; bring a comps-based counter.
- Current owner paid $17k; list at $39k implies a 129% gain — meaningful room to come down on a strong offer.
Risks & watch-outs
- Watch-outs: flood insurance adds $56/mo; built in 1910 — expect roof / HVAC / electrical / plumbing capex.
- Climate carrying-cost: major flood risk — expect insurance premiums to compound above CPI over the hold.
Questions for the listing agent
- Built in 1910 — when were the roof, HVAC, electrical panel, plumbing, and water heater last replaced?
- What's the actual annual flood-insurance premium (NFIP or private), and is the property in a SFHA with mandatory coverage?
- Is there a deadline driving the sale (1031 exchange, divorce, estate, relocation)? That informs how much negotiation room exists.
- Schools are F-rated, which usually means shorter tenancies and higher turnover. Who's the typical renter profile here, and what's been the actual vacancy rate?
- Crime grade is F in this area — have there been break-ins, vandalism, or insurance claims at this property in the last 3 years? What carrier currently insures it and at what premium?
- What's the average days-on-market for RENTAL listings here right now (not sales)? A rising rental-DOM trend means longer vacancies and softer asking-rent achievability than the comps imply.
- What's the recent tenant-quality profile in this submarket — average credit score on applications, eviction rate, late-payment / NSF rate, and stable-employment percentage? A property-management company in the area should have these aggregated.
- How much new for-sale + rental construction is in the pipeline within 1–3 miles? Heavy new supply typically softens prices + rents 12–24 months out; constrained supply supports both.
Investment metrics
- 1% rule
- 2.43% ✓
- Cap rate
- 22.06%
- Cash-on-cash
- 56.32%
- DSCR
- 3.51
- GRM
- 3.4
CMA / ARV
- ARV (on-the-fly)
- $29,820
- Comps found
- 11
Show comp detail 11 sales within ~0.75 mi
| Address | Dist | Beds/Ba | Sqft | Sold | Price | $/sf | Match |
|---|---|---|---|---|---|---|---|
| 213 N Webster St | 0.00mi | 2/1.0 | 852 (0%) | 2mo | $17,000 | $20 | 98 |
| 1308 W 3rd Ave | 0.08mi | 3/1.0 (+1) | 816 (-4%) | 17mo | $52,000 | $64 | 70 |
| 1317 W John H Gwynn JR Ave | 0.10mi | 2/1.0 | 772 (-9%) | 15mo | $19,000 | $25 | 67 |
| 912 W 3rd Ave | 0.20mi | 2/1.0 | 934 (+10%) | 20mo | $18,650 | $20 | 58 |
| 2029 W Callender Ave | 0.74mi | 2/1.0 | 864 (+1%) | 11mo | $81,500 | $94 | 54 |
| 2103 W Sherman Ave | 0.73mi | 2/1.0 | 858 (+1%) | 14mo | $30,000 | $35 | 53 |
| 1614 W Smith St | 0.47mi | 2/1.0 | 772 (-9%) | 13mo | $12,500 | $16 | 52 |
| 1704 W Martin St | 0.53mi | 2/1.0 | 730 (-14%) | 8mo | $21,000 | $29 | 45 |
| 1512 W Millman St | 0.59mi | 2/1.0 | 928 (+9%) | 16mo | $32,500 | $35 | 44 |
| 2003 W Callender Ave | 0.67mi | 2/1.5 | 780 (-8%) | 14mo | $112,500 | $144 | 41 |
| 109 N Cedar Ave | 0.71mi | 2/1.0 | 888 (+4%) | 24mo | $63,500 | $72 | 40 |
Match score weights: distance 35% · size 25% · config 20% · recency 20%. Top-matched comps best support the ARV.
Projected returns pro-forma
0.63% appreciation · 3.0% rent growth · sell at horizon
- IRR
- 52.5%
- Equity multiple
- 3.67×
- Total profit
- $29,165
- Equity at exit
- $12,574
- IRR
- 54.4%
- Equity multiple
- 7.36×
- Total profit
- $69,467
- Equity at exit
- $16,151
Cash invested: $10,920 (down + closing). Projections, not guarantees.
Landlord ↔ Tenant lean methodology
- Overall (STATE)
- 43 Moderately Tenant-Leaning
- State Illinois
- 43 Moderately Tenant-Leaning · D+7
- County
- — inherits STATE
- City
- — inherits STATE
ZIP-level market 61605
- Home prices YoY
- 0.4%
- Active inventory
- 42
- Price-to-rent
- 3.4×
Monthly cashflow live
- Estimated rent
- $948 high interval (Pro) →
- Mortgage (P&I)
- −$205
- Tax from tax record
- −$16 /mo · $193/yr
- Insurance
- −$16
- Flood insurance flood zone
- −$56 /mo · $666/yr
- HOA
- −$0
- Vacancy / Maint / Mgmt
- −$199
- Net cashflow
- $457
Break-even live
UW: 25.0% down · 7.5% · 30yr · 1.5% tax · 5.0% vac · 8.0% maint · 8.0% mgmt
Financing live
Cash to close
- Down payment
- $9,750
- Closing costs
- $1,170
- Reserves months
- —
- Total cash needed
- —
Loan-product check · same deal, 3 products live
Conventional
25% down · 7.5% · 30yr
- Down + closing
- —
- Monthly P&I
- —
- Monthly cashflow
- —
- DSCR
- —
- Eligible?
- —
Personal DTI + credit; lowest rate.
DSCR
20% down · 8.5% · 30yr
- Down + closing
- —
- Monthly P&I
- —
- Monthly cashflow
- —
- DSCR
- —
- Eligible?
- —
No personal income docs; deal must DSCR.
Hard money
10% down · 12.0% · 12mo
- Down + closing
- —
- Monthly P&I
- —
- Monthly cashflow
- —
- DSCR
- —
- Eligible?
- —
Short-term bridge; refi at stabilization.
Rent comps 25 comps
| Address | Beds | Baths | Sqft | Rent | $/sqft | DOM | Units | Dist |
|---|---|---|---|---|---|---|---|---|
| 1220 W John H Gwynn Jr Ave Peoria, IL | 2.0 | 1.0 | 853 | $745 | $0.87 | 20d | 1 | 0.10mi |
| 1401 W Adrian G Hinton Ave Peoria, IL | 2.0 | 1.0 | 1100 | $775 | $0.70 | 43d | 1 | 0.18mi |
| 1540 W Kettelle St Peoria, IL | 3.0 | 1.0 | 1001 | $748 | $0.75 | 13d | 1 | 0.54mi |
| 905 N Sheridan Rd Unit F Peoria, IL | 1.0 | 1.0 | 650 | $900 | $1.38 | 43d | 1 | 0.65mi |
| 911 N Sheridan Rd Unit a1 Peoria, IL | 2.0 | 1.0 | 825 | $850 | $1.03 | 13d | 1 | 0.66mi |
| 911 N Sheridan Rd Unit A4 Peoria, IL | 2.0 | 1.0 | 825 | $850 | $1.03 | 43d | 1 | 0.66mi |
| 214 Pecan St Peoria, IL | 2.0 | 1.0 | 1050 | $1,595 | $1.52 | 13d | 1 | 0.74mi |
| 416 W Main St Unit A Peoria, IL | 2.0 | 1.0 | 1050 | $950 | $0.90 | 43d | 1 | 0.86mi |
| 812 SW Washington St Peoria, IL | 2.0 | 1.0 | 640 | $1,200 | $1.88 | 13d | 1 | 0.87mi |
| 812 SW Washington St Unit 2 Peoria, IL | 2.0 | 1.0 | 700 | $1,275 | $1.82 | 13d | 1 | 0.87mi |
| 945 S Shelley St Peoria, IL | 1.0–3.0 | 1.0–2.0 | 929 | $910 | $0.98 | 13d | 1 | 0.91mi |
| 511 W Elizabeth St Unit A Peoria, IL | 1.0 | 1.0 | 850 | $800 | $0.94 | 43d | 1 | 0.95mi |
| 928 S Matthew St Peoria, IL | 2.0 | 1.0 | 1080 | $748 | $0.69 | 13d | 1 | 0.96mi |
| 100 Walnut St Peoria, IL | 2.0 | 2.0 | 1102 | $2,000 | $1.81 | 13d | 1 | 1.01mi |
| 2317 W Martin Luther King Junior Dr Unit 1-106 Peoria, IL | 1.0 | 1.0 | 588 | $775 | $1.32 | 43d | 1 | 1.04mi |
| 2317 W Martin Luther King Junior Dr Peoria, IL | 1.0–2.0 | 1.0 | 697 | $800 | $1.15 | 13d | 3 | 1.04mi |
| 2317 W Martin Luther King Junior Dr Unit 2-214 Peoria, IL | 2.0 | 1.0 | 807 | $800 | $0.99 | 43d | 1 | 1.04mi |
| 123 SW Jefferson Ave Unit E15SW Peoria, IL | 2.0 | 2.0 | 1100 | $1,750 | $1.59 | 13d | 1 | 1.05mi |
| 123 SW Jefferson Ave Unit E6W Peoria, IL | 2.0 | 1.0 | 868 | $1,495 | $1.72 | 20d | 1 | 1.05mi |
| 311 SW Water St Unit 301 Peoria, IL | 1.0 | 1.0 | 635 | $1,300 | $2.05 | 43d | 1 | 1.12mi |
| 2116 W Proctor St Peoria, IL | 2.0 | 1.0 | 912 | $879 | $0.96 | 13d | 1 | 1.17mi |
| 1703 N Valley Ave Peoria, IL | 2.0 | 1.0 | 676 | $1,200 | $1.78 | 13d | 1 | 1.19mi |
| 2320 W Garden St Peoria, IL | 2.0 | 1.0 | 1096 | $1,000 | $0.91 | 43d | 1 | 1.42mi |
| 1505 N Peoria Ave Peoria, IL | 1.0 | 1.0 | 525 | $1,006 | $1.92 | 13d | 4 | 1.43mi |
| 2023 N Underhill St Peoria, IL | 3.0 | 1.0 | 1050 | $1,200 | $1.14 | 13d | 1 | 1.49mi |
Listing history 11 events
-
2026-05-30status $39,000 Pending 3 DOM
-
2026-05-26$39,000 Active
-
2026-04-09soldstatus $17,000 Closed 79-char remark
Show marketing remark (79 chars)
Great investment opportunity in Peoria. Was perviously rented for $900 a month.
-
2026-03-19status Pending 79-char remark
Show marketing remark (79 chars)
Great investment opportunity in Peoria. Was perviously rented for $900 a month.
-
2026-03-19status Active 79-char remark
Show marketing remark (79 chars)
Great investment opportunity in Peoria. Was perviously rented for $900 a month.
-
2026-03-09status Pending 79-char remark
Show marketing remark (79 chars)
Great investment opportunity in Peoria. Was perviously rented for $900 a month.
-
2026-01-22price $24,999 79-char remark
Show marketing remark (79 chars)
Great investment opportunity in Peoria. Was perviously rented for $900 a month.
-
2026-01-08price $29,999 79-char remark
Show marketing remark (79 chars)
Great investment opportunity in Peoria. Was perviously rented for $900 a month.
-
2026-01-07$24,999 Active 79-char remark
Show marketing remark (79 chars)
Great investment opportunity in Peoria. Was perviously rented for $900 a month.
-
2021-08-06historical
-
2021-03-09soldstatus $40,528
ⓘ Source: listings_history table (triggers on properties + properties_extension) + one-shot
backfill from property_details.listing_events for pre-trigger history.
Tax reassessment forecast IL · Partial reset (capped growth)
- Current annual tax
- $193 · $16/mo
- Projected year-2 tax
- $539 · $45/mo
- Expected delta
- +$346/yr (+$29/mo · 179.8%)
ⓘ Screening estimate from a state-policy table — verify with the county assessor before closing.
Climate risk First Street
- Flood 7/10 Severe FEMA zone X · 77% chance over 30 yrs
- Wildfire 1/10 Low
- Heat 3/10 Moderate 7 d/yr ≥105°F today · 18 d/yr by 30 yrs out
- Wind 2/10 Low 100% chance of damaging wind over 30 yrs
- Air quality 3/10 Moderate 1 unhealthy d/yr today · 3 by 30 yrs out
Nearby sold comps map
Loading sold comps map…
Walkable amenities ~0.75 mi
Loading nearby amenities…
Taxation est. · year 1
- Rental income
- $11,382
- − Mortgage interest
- −$2,185
- − Property taxes
- −$193
- − Insurance
- −$861
- − Repairs & maintenance
- −$911
- − Management
- −$911
- − Depreciation
- −$1,135
- Taxable income
- $5,188
- Est. tax owed @ 24.0%
- −$1,245
- After-tax cash flow
- $4,238/yr
For passive investors: Depreciation is non-cash, so a rental often shows a tax loss while cash-flowing — sheltering income. Rental losses are passive: they offset passive income freely, and up to $25,000/yr can offset ordinary (W-2) income if you actively participate and your MAGI is under $100k (phasing out to $0 by $150k); unused losses carry forward. On sale, claimed depreciation is recaptured at up to 25%, and gains may owe capital-gains tax (a 1031 exchange can defer both). Figures are a year-1 estimate at your 24.0% rate — not tax advice; consult a CPA.
Schools (NCES district)
- District
- Peoria SD 150
- NCES district ID
- 1731230
- Math proficiency
- 11% ▼ -5.00%
- Reading proficiency
- 14% ▼ -4.00%
- Median HH income
- $41,951
- Composite
- 10.92/100
- National rank
- #9751
- State rank
- #554 of 620 in IL
Livability — Peoria
- Score
- 73/100
- State rank
- #270
- US rank
- #5096
Category grades
Schools grade is shown separately in the Schools card above.
Census & demographics
- Census place
- Peoria, IL
- County
- Peoria County · 120,495 people
- City population
- 114,670
- Metro
- Peoria, IL
- Population (ZIP)
- 13,424
- Household income
- $26,392
- Rent vs Own
- Severe rent burden
- 1385.0
Population outlook (Peoria County) Hauer SSP2
- Today (2025)
- 183,007 people
- By 2030
- 179,643 · -1.8%
- By 2040
- 171,782 · -6.1%
- By 2050
- 163,508 · -10.7%
- By 2075
- 140,178 · -23.4%
- By 2100
- 114,493 · -37.4%
Race, ethnicity, and origin ACS 2023
- Neighborhood character
- Diverse neighborhood (Simpson 0.61)
- Race & ethnicity
- Black 56% White 27% Hispanic / Latino 12% Two or more races 7% Native American 1%
- Hispanic origin (detail)
- Mexican 8%
- Common ancestry
- Lithuanian 1% Iranian 1% Portuguese 1%
- Foreign-born
- 4% · Canada, Vietnam
- Languages at home
- 92% English-only · Spanish 7%
Political lean MEDSL · Peoria
- 2024 margin
- Toss-up / Even · D 51.5% · R 46.9% · Other 1.6%
- 2008→2024 swing
- -9.2pp toward R · 2008: 13.9pp · 2024: 4.7pp
- All cycles
- 2024: D+4.7 2020: D+6.3 2016: D+2.8 2012: D+4.4 2008: D+13.9
Not yet ingested
- Civics
- —
Market trends
- HPI YoY
- ▲ 0.63%
- Current HPI
- 170.5814
- Rent YoY
- —
- Metro
- Peoria, IL
- State GDP YoY
- ▲ 1.59%
- F500 in state
- 60
Industry mix (Fortune 500 HQ in IL)
| Industry | F500 HQs | Revenue |
|---|---|---|
| Insurance | 4 | $201B |
|
||
| Consumer Goods | 4 | $87B |
|
||
| Industrial Machinery | 3 | $64B |
|
||
| Healthcare | 2 | $55B |
|
||
| Retail / Pharmacy | 1 | $148B |
|
||
| Agriculture / Food | 1 | $86B |
|
||
Price history
-3.8% since first listed10 events — show timeline
- 2026-05-26 Listed $39,000 RMLSA as Distributed by MLS Grid
- 2026-04-09 Sold (MLS) $17,000 RMLSA as Distributed by MLS Grid
- 2026-03-19 Pending — RMLSA as Distributed by MLS Grid
- 2026-03-19 Relisted — RMLSA as Distributed by MLS Grid
- 2026-03-09 Pending — RMLSA as Distributed by MLS Grid
- 2026-01-22 Price Changed $24,999 RMLSA as Distributed by MLS Grid
- 2026-01-08 Price Changed $29,999 RMLSA as Distributed by MLS Grid
- 2026-01-07 Listed $24,999 RMLSA as Distributed by MLS Grid
- 2021-08-06 Listing Removed — RMLSA as Distributed by MLS Grid
- 2021-03-09 Sold (Public Records) $40,528 Public Records
Property tax history
-7.2%/yrLatest (2024): $193 · +5.0% YoY. Source: county tax records.
Cash-flow waterfall
monthlySold comps — $/sqft
last 12 mo · ≤1 miLoading sold comps…