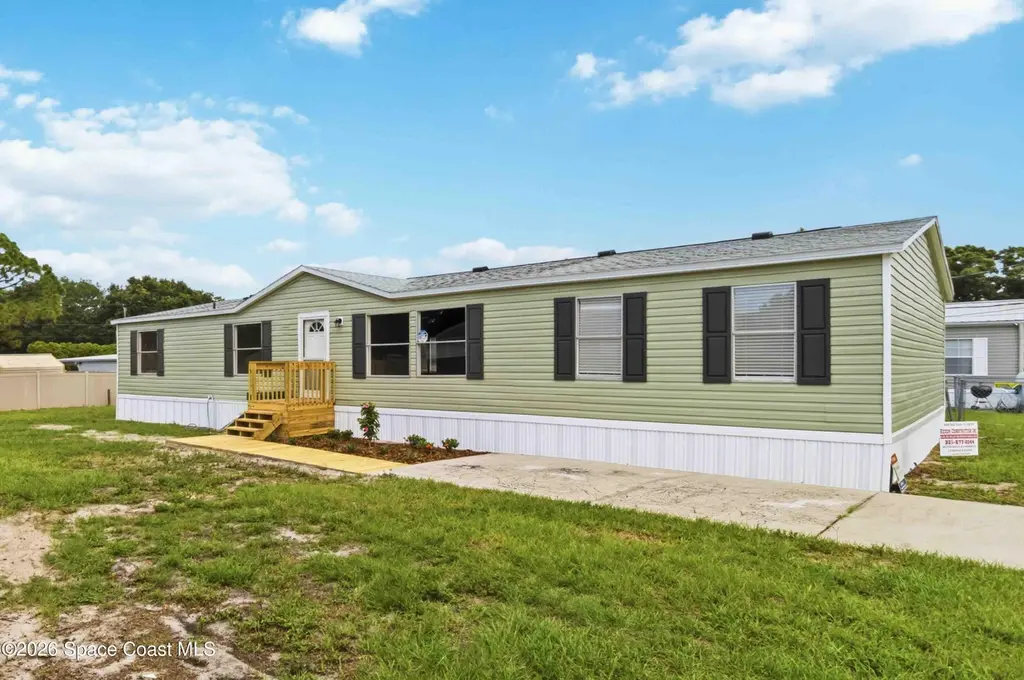
5364 Beck Dr · Sharpes, FL
Flood risk 1/10 · Minimal
- FEMA flood zone
- X (unshaded)
- Chance of flooding over 30 yrs
- 0.0%
- Est. flood insurance / yr
- $507 – $1,088
Fire risk 6/10 · Moderate
- Est. fire insurance / yr
- $947 – $1,759
Heat risk 10/10 · Severe
- Hot days now (above 106°F)
- 7 days/yr
- Hot days in 30 yrs
- 23 days/yr
Wind risk 10/10 · Severe
- Chance of severe wind over 30 yrs
- 99.0%
Air-quality risk 1/10 · Minimal
- Unhealthy air days now
- 0 days/yr
- Unhealthy air days in 30 yrs
- 0 days/yr
Risk factors via First Street. Map © Google.
Why this score? — see what drove the C grade
The composite is a weighted blend of 9 inputs, each scored 0–100. Each bar is that input's sub-score; the figure is the points it added to the 100-point composite (weight × sub-score).
- Cash flow +23.0/30.0
- ARV discount +7.5/15.0
- DSCR +7.4/10.0
- 1% rule +4.9/10.0
- Schools +4.7/10.0
- Livability +3.7/5.0
- Rent growth +3.1/5.0
- Condition / age +2.5/5.0
- Appreciation +0.0/10.0
$259,900
🖨 Deal sheet (PDF) 📄 Offer letter ✓ Due diligence
Listing remarks MLS
Starter Home or Investment Opportunity - NO HOA & Land Included! Welcome to this spacious 3-bedroom, 2-bathroom manufactured home, offering 1,920 SqFt of comfortable living space on an approximately 1/5 acre lot - and yes, the land is owned! Built in 2002, this home boasts attractive curb appeal and a versatile layout perfect for families, first-time buyers, or savvy investors. With NO HOA, you're free to enjoy your property without added restrictions or fees. Looking for instant value? This is an AS-IS SALE, providing a fantastic instant equity opportunity. Whether you're ready to personalize your first home or generate strong rental income, this property is packed with potential. Don't miss out on this rare find—schedule your tour today!
Key facts
- Quartz countertops
- Brand new kitchen
- Ss appliances
Tags
Property features AI
Exterior
- Parking: Other parking
- Utilities: Public sewer; Cable available; Electricity connected; Sewer connected; Water connected
- Home design: Manufactured home; One level; South-facing
- Construction: Vinyl siding
- Exterior features: Shingle roof; Asphalt road access; Lot includes other features
Interior
- Kitchen: Dishwasher; Electric range; Microwave; Refrigerator
- Bedrooms: 4 bedrooms
- Bathrooms: 2 full bathrooms
- Heating & cooling: Central heating; Central air conditioning
- Interior features: Breakfast bar; Eat-in kitchen; Open floorplan; Pantry; Primary bathroom with tub and separate shower; Walk-in closets
- Laundry & utility: In-unit laundry with washer hookup and electric dryer hookup
Neighborhood map
What this means for you Summary
Snapshot
- This is a 3-bed/2.0-bath manufactured listed at $260k.
Deal economics
- At list price, monthly cash flow is $460 ($6k/yr) — positive.
- The deal already cash-flows at list — no discount required.
- To meet the 1% rule (rent ≥ 1% of price), the offer needs to be $257k (1.1% below list).
- Recommended offer: $257k (1.1% below list) — sets the bar for 1% rule.
Location & tenants
- Location reads 73/100 on livability (#302 in FL) — a middle-class / working-renter tenant base. Strengths: crime A+, commute A+, cost of living A+; Watch: employment C-, amenities F, health & safety D-.
- Brevard (suburban): math 53% / reading 57% proficiency, ranked #19 of 73 in FL (top 26%) — acceptable for families but not a draw, mixed tenant base, ~2y average lease.
- Zoned schools: Fairglen Elementary School (math 34% / reading 38%, grade F, #1,670 of 2,144 statewide, top 78%, 617 students, 71% FRL); Cocoa High School (math 21% / reading 27%, grade F, #529 of 667 statewide, top 80%, 1,551 students, 73% FRL) — zoned schools average 72% FRL vs 43% district-wide (29 pts higher); higher-poverty schools than district average — tighter screening recommended.
- Zoned-school proficiency averages 30% at this address vs 55% district-wide (-25 pts) — the specific schools serving this property underperform the Brevard average; the district grade overstates school quality for this exact location.
- Market conditions: Rents rising (+2.5%/yr); 224 active listings in the ZIP; 5 comparable units currently listed for rent nearby; rentals at typical pace (median 24d on market — plan ~3-4 weeks tenant-placement turnaround); solid renter incomes; 4,602 units permitted in Brevard County in 2024 (702 in 5+ unit buildings).
- This rent runs 36% of the median local income ($86k/yr) — at the standard rent-burdened threshold; future hikes will face affordability resistance.
Forward outlook
- Local home prices are declining (-3.0%/yr); year-one equity from $2k of loan paydown is wiped out by about $8k of value loss. Plan a longer hold.
- Brevard County population projected at +15% by 2050 — modest demand growth; plan on rents tracking national, not racing it.
Negotiation context
- Only 12 days on market — expect competitive offers; lowballing is unlikely to land.
- 5 sale attempts since 20y ago with the ask held roughly flat each time — persistent listings suggest the price (not the market) is what's stuck; bring a comps-based counter.
- Current owner paid $75k; list at $260k implies a 247% gain — meaningful room to come down on a strong offer.
Risks & watch-outs
- Climate carrying-cost: severe wind risk, 99% chance of damaging wind over 30y; major wildfire risk; extreme-heat days projected 7→23/yr by 2055 (HVAC capex compounding) — expect insurance premiums to compound above CPI over the hold.
Questions for the listing agent
- Is there a deadline driving the sale (1031 exchange, divorce, estate, relocation)? That informs how much negotiation room exists.
- Schools are F-rated, which usually means shorter tenancies and higher turnover. Who's the typical renter profile here, and what's been the actual vacancy rate?
- What's the average days-on-market for RENTAL listings here right now (not sales)? A rising rental-DOM trend means longer vacancies and softer asking-rent achievability than the comps imply.
- What's the recent tenant-quality profile in this submarket — average credit score on applications, eviction rate, late-payment / NSF rate, and stable-employment percentage? A property-management company in the area should have these aggregated.
- How much new for-sale + rental construction is in the pipeline within 1–3 miles? Heavy new supply typically softens prices + rents 12–24 months out; constrained supply supports both.
Investment metrics
- 1% rule
- 0.99% ✗
- Cap rate
- 8.42%
- Cash-on-cash
- 7.58%
- DSCR
- 1.34
- GRM
- 8.4
CMA / ARV
No comps found within radius.
Projected returns pro-forma
-3.0% appreciation · 2.48% rent growth · sell at horizon
- IRR
- -5.3%
- Equity multiple
- 0.80×
- Total profit
- $-14,271
- Equity at exit
- $38,752
- IRR
- 3.8%
- Equity multiple
- 1.27×
- Total profit
- $19,440
- Equity at exit
- $22,471
Cash invested: $72,772 (down + closing). Projections, not guarantees.
Landlord ↔ Tenant lean methodology
- Overall (STATE)
- 87 Strongly Landlord-Friendly
- State Florida
- 87 Strongly Landlord-Friendly · R+3
- County
- — inherits STATE
- City
- — inherits STATE
ZIP-level market 32927
- Home prices YoY
- -19.4%
- Rents YoY
- 2.5%
- Active inventory
- 224
- Price-to-rent
- 8.4×
Monthly cashflow live
- Estimated rent
- $2,570 high interval (Pro) →
- Mortgage (P&I)
- −$1,363
- Tax from tax record
- −$99 /mo · $1,192/yr
- Insurance
- −$108
- HOA
- −$0
- Vacancy / Maint / Mgmt
- −$540
- Net cashflow
- $460
Break-even live
Sensitivity live
| Price | -10% $607 | -5% $533 | +0% $460 | +5% $386 | +10% $313 |
|---|---|---|---|---|---|
| Rent | -10% $257 | -5% $358 | +0% $460 | +5% $561 | +10% $663 |
| Rate | -1.0pp $591 | -0.5pp $526 | base $460 | +0.5pp $392 | +1.0pp $324 |
UW: 25.0% down · 7.5% · 30yr · 1.5% tax · 5.0% vac · 8.0% maint · 8.0% mgmt
Financing live
Cash to close
- Down payment
- $64,975
- Closing costs
- $7,797
- Reserves months
- —
- Total cash needed
- —
Loan-product check · same deal, 3 products live
Conventional
25% down · 7.5% · 30yr
- Down + closing
- —
- Monthly P&I
- —
- Monthly cashflow
- —
- DSCR
- —
- Eligible?
- —
Personal DTI + credit; lowest rate.
DSCR
20% down · 8.5% · 30yr
- Down + closing
- —
- Monthly P&I
- —
- Monthly cashflow
- —
- DSCR
- —
- Eligible?
- —
No personal income docs; deal must DSCR.
Hard money
10% down · 12.0% · 12mo
- Down + closing
- —
- Monthly P&I
- —
- Monthly cashflow
- —
- DSCR
- —
- Eligible?
- —
Short-term bridge; refi at stabilization.
Rent comps 5 comps
| Address | Beds | Baths | Sqft | Rent | $/sqft | DOM | Units | Dist |
|---|---|---|---|---|---|---|---|---|
| 456 Snook Pl Cocoa, FL | 4.0 | 2.5 | 2505 | $2,900 | $1.16 | 24d | 1 | 0.93mi |
| 100 Canebreakers Dr Cocoa, FL | 2.0–3.0 | 2.0–2.5 | 1362 | $2,400 | $1.76 | 24d | 2 | 1.13mi |
| 100 Canebreakers Dr #108 Cocoa, FL | 3.0 | 2.5 | 1612 | $2,400 | $1.49 | 24d | 1 | 1.15mi |
| 6385 Wien Ln Cocoa, FL | 3.0 | 2.0 | 1350 | $2,350 | $1.74 | 19d | 1 | 1.37mi |
| 4005 Fennec Ln Cocoa, FL | 3.0–5.0 | 2.0–3.0 | 2136 | $2,345 | $1.10 | 14d | 7 | 1.39mi |
Listing history 9 events
-
2026-06-18days on market $259,900 Active 12 DOM
-
2026-06-17days on market $259,900 Active 11 DOM
-
2026-06-16days on market $259,900 Active 10 DOM
-
2026-06-15days on market $259,900 Active 9 DOM
-
2026-06-14days on market $259,900 Active 7 DOM
-
2026-06-10days on market $259,900 Active 4 DOM
-
2026-06-08days on market $259,900 Active 2 DOM
-
2026-06-07remarks 683-char remark
-
2026-06-07$259,900 Active 1 DOM
ⓘ Source: listings_history table (triggers on properties + properties_extension) + one-shot
backfill from property_details.listing_events for pre-trigger history.
Tax reassessment forecast FL · Resets to sale price
- Current annual tax
- $1,192 · $99/mo
- Projected year-2 tax
- $2,157 · $180/mo
- Expected delta
- +$965/yr (+$80/mo · 81.0%)
ⓘ Screening estimate from a state-policy table — verify with the county assessor before closing.
Climate risk First Street
- Flood 1/10 Low FEMA zone X (unshaded) · 0% chance over 30 yrs
- Wildfire 6/10 Major
- Heat 10/10 Extreme 7 d/yr ≥106°F today · 23 d/yr by 30 yrs out
- Wind 10/10 Extreme 99% chance of damaging wind over 30 yrs
- Air quality 1/10 Low 0 unhealthy d/yr today · 0 by 30 yrs out
Nearby sold comps map
Loading sold comps map…
Walkable amenities ~0.75 mi
Loading nearby amenities…
Taxation est. · year 1
- Rental income
- $30,840
- − Mortgage interest
- −$14,558
- − Property taxes
- −$1,192
- − Insurance
- −$1,300
- − Repairs & maintenance
- −$2,467
- − Management
- −$2,467
- − Depreciation
- −$7,561
- Taxable income
- $1,295
- Est. tax owed @ 24.0%
- −$311
- After-tax cash flow
- $5,206/yr
For passive investors: Depreciation is non-cash, so a rental often shows a tax loss while cash-flowing — sheltering income. Rental losses are passive: they offset passive income freely, and up to $25,000/yr can offset ordinary (W-2) income if you actively participate and your MAGI is under $100k (phasing out to $0 by $150k); unused losses carry forward. On sale, claimed depreciation is recaptured at up to 25%, and gains may owe capital-gains tax (a 1031 exchange can defer both). Figures are a year-1 estimate at your 24.0% rate — not tax advice; consult a CPA.
Schools (NCES district)
- District
- Brevard
- NCES district ID
- 1200150
- Math proficiency
- 53% ▼ -9.00%
- Reading proficiency
- 57% ▼ -4.00%
- Median HH income
- $49,426
- Composite
- 46.86/100
- National rank
- #2370
- State rank
- #19 of 73 in FL
Livability — Sharpes
- Score
- 73/100
- State rank
- #302
- US rank
- #5144
Category grades
Schools grade is shown separately in the Schools card above.
Census & demographics
- County
- Brevard County · 602,871 people
- City population
- 11
- Metro
- Palm Bay-Melbourne-Titusville, FL
- Population (ZIP)
- 29,219
- Household income
- $86,075
- Rent vs Own
- Severe rent burden
- 192.0
Population outlook (Brevard County) Hauer SSP2
- Today (2025)
- 623,254 people
- By 2030
- 648,420 · +4.0%
- By 2040
- 690,009 · +10.7%
- By 2050
- 715,669 · +14.8%
- By 2075
- 775,744 · +24.5%
- By 2100
- 776,687 · +24.6%
Race, ethnicity, and origin ACS 2023
- Neighborhood character
- Predominantly White (82%)
- Race & ethnicity
- White 82% Two or more races 8% Hispanic / Latino 5% Black 5%
- Hispanic origin (detail)
- Puerto Rican 2%
- Common ancestry
- Lithuanian 3% Slovak 2% Iranian 2%
- Foreign-born
- 5% · Canada
- Languages at home
- 94% English-only · Spanish 3% French/Haitian/Cajun 1% German/W. Germanic 1%
Political lean MEDSL · Brevard
- 2024 margin
- Strong R (+20.8) · D 39.1% · R 59.9% · Other 1.0%
- 2008→2024 swing
- -10.4pp toward R · 2008: -10.4pp · 2024: -20.8pp
- All cycles
- 2024: R+20.8 2020: R+16.4 2016: R+19.8 2012: R+12.7 2008: R+10.4
Not yet ingested
- Civics
- —
Market trends
- HPI YoY
- ▼ -79.36%
- Current HPI
- 330.5099
- Rent YoY
- ▲ 2.48%
- Metro
- Palm Bay-Melbourne-Titusville, FL
- State GDP YoY
- ▲ 3.28%
- F500 in state
- 36
Industry mix (Fortune 500 HQ in FL)
| Industry | F500 HQs | Revenue |
|---|---|---|
| Industrial Technology | 2 | $29B |
|
||
| Insurance | 2 | $17B |
|
||
| Retail | 1 | $60B |
|
||
| Technology Distribution | 1 | $58B |
|
||
| Homebuilding | 1 | $35B |
|
||
| Technology Manufacturing | 1 | $35B |
|
||
Price history
+939.6% since first listed17 events — show timeline
- 2026-06-06 Listed $259,900 SCMLS
- 2025-07-18 Sold (Public Records) $75,000 Public Records
- 2025-07-16 Sold (MLS) $75,000 SCMLS
- 2025-06-24 Pending — SCMLS
- 2025-06-24 Relisted — SCMLS
- 2025-06-19 Listing Removed — SCMLS
- 2025-06-06 Price Changed $89,990 SCMLS
- 2025-05-29 Price Changed $99,990 SCMLS
- 2025-05-16 Listed $110,000 SCMLS
- 2016-07-11 Sold (Public Records) $78,500 Public Records
- 2016-07-07 Sold (MLS) $78,500 SCMLS
- 2016-02-23 Listed $79,900 SCMLS
- 2006-12-20 Sold (Public Records) $131,900 Public Records
- 2006-12-15 Sold (MLS) $131,900 SCMLS
- 2006-08-29 Listed $128,900 SCMLS
- 1988-03-01 Sold (Public Records) $32,500 Public Records
- 1988-03-01 Sold (Public Records) $25,000 Public Records
Property tax history
-1.9%/yrLatest (2025): $1,192 · +10.6% YoY. Source: county tax records.
Cash-flow waterfall
monthlySold comps — $/sqft
last 12 mo · ≤1 miLoading sold comps…