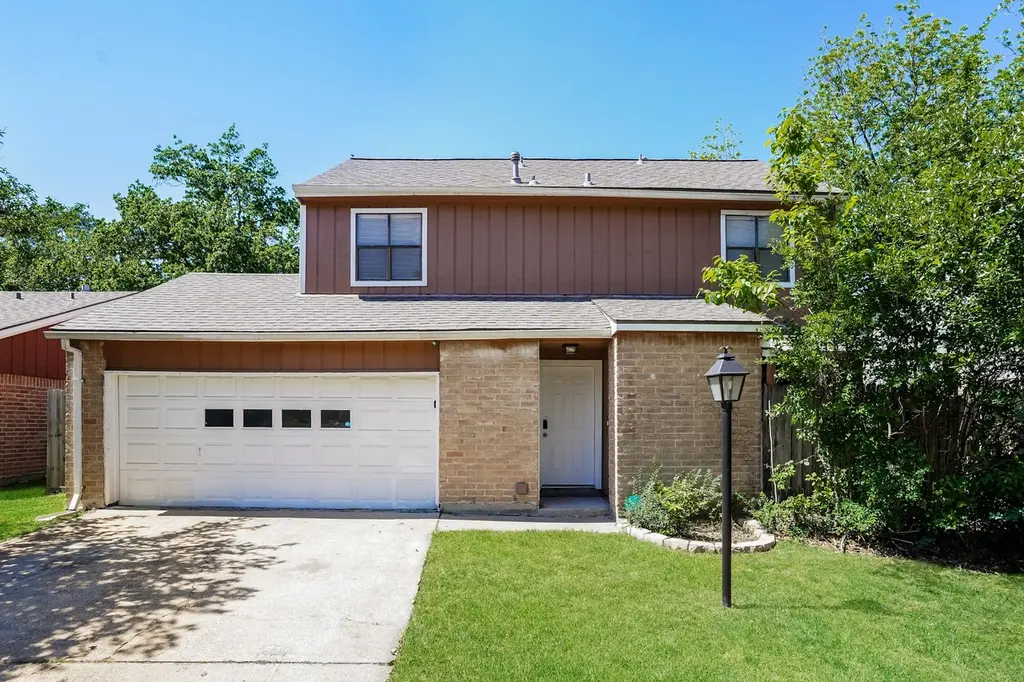
5114 Autumn Forest Dr · Houston, TX
Flood risk 4/10 · Minor
- FEMA flood zone
- X (shaded)
- Chance of flooding over 30 yrs
- 0.23%
- Est. flood insurance / yr
- $507 – $1,088
Fire risk 1/10 · Minimal
- Est. fire insurance / yr
- $1,222 – $2,270
Heat risk 9/10 · Severe
- Hot days now (above 109°F)
- 7 days/yr
- Hot days in 30 yrs
- 24 days/yr
Wind risk 9/10 · Severe
- Chance of severe wind over 30 yrs
- 99.0%
Air-quality risk 3/10 · Minor
- Unhealthy air days now
- 3 days/yr
- Unhealthy air days in 30 yrs
- 3 days/yr
Risk factors via First Street. Map © Google.
Why this score? — see what drove the D+ grade
The composite is a weighted blend of 9 inputs, each scored 0–100. Each bar is that input's sub-score; the figure is the points it added to the 100-point composite (weight × sub-score).
- ARV discount +15.0/15.0
- Cash flow +13.8/30.0
- 1% rule +4.3/10.0
- DSCR +4.2/10.0
- Livability +3.7/5.0
- Rent growth +3.0/5.0
- Schools +2.7/10.0
- Condition / age +2.5/5.0
- Appreciation +0.0/10.0
$231,500
🖨 Deal sheet 📄 Offer letter ✓ Due diligence
Listing remarks MLS
Won't Last Long! Don't sleep on this charming 1822 Square foot, 3 Bed, 2 and 1/2 bath home in the beautiful deed restricted Candlelight Village Oaks Subidivison. This home has it all. The primary bedroom is downstairs with a well appointed kitchen, and glass sliding doors that go out to your own private covered patio. The living room is a must see with laminate flooring, a beautiful fireplace and high ceilings. The neighborhood is quiet, peaceful and charming. All appliances stay. This home will not last long. Come and see for yourself.
Key facts
- Inviting foyer
- Fireplace
- Ample storage
Tags
Property features AI
Finance
- Other: Seller disclosure available
- HOA & community: Part of Candlelight Oaks Village association
Exterior
- Parking: Attached 2-car garage
- Utilities: Public water; Public sewer
- Home design: Residential property; Living area approximately 1,822
- Construction: Built in 1976; Composition roof
- Exterior features: Lot approximately 3,776 sq ft; Lot described as Other
Interior
- Kitchen: Kitchen on the first floor (8 x 10)
- Bedrooms: Primary bedroom on the first floor (15 x 11); Second-floor bedroom (12 x 12); Second-floor bedroom (9 x 14)
- Bathrooms: Two full bathrooms; One half bathroom
- Interior features: One fireplace; Six total rooms
Neighborhood map
What this means for you Summary
Snapshot
- This is a 3-bed/2.0-bath single-family listed at $232k.
Deal economics
- At list price, monthly cash flow is $21 ($249/yr) — positive.
- The deal already cash-flows at list — no discount required.
- To meet the 1% rule (rent ≥ 1% of price), the offer needs to be $214k (7.4% below list).
- Recommended offer: $214k (7.4% below list) — sets the bar for 1% rule.
- Cap rate 6.4% vs local median 3.2% in Houston — top-decile yield for the area; either an underpriced asset or a hidden risk that comps aren't pricing in. Stress-test before assuming the spread holds.
Location & tenants
- Location reads 74/100 on livability (#184 in TX, #4,771 nationally) — a middle-class / working-renter tenant base. Strengths: amenities A+, cost of living A+, housing A+; Watch: crime F.
- Houston ISD (urban): math 27% / reading 35% proficiency, ranked #593 of 826 in TX (top 72%) — families likely to look elsewhere, expect single-tenant / working-renter base with shorter leases; 71% free/reduced lunch — lower-income household profile, screen leases tightly.
- Zoned schools: Clifton Middle (math 9% / reading 22%, grade F, #1,556 of 1,662 statewide, top 94%, 509 students, 98% FRL); Scarborough H S (math 19% / reading 16%, grade F, #1,451 of 1,632 statewide, top 89%, 750 students, 96% FRL) — zoned schools average 97% FRL vs 71% district-wide (26 pts higher); higher-poverty schools than district average — tighter screening recommended.
- Zoned-school proficiency averages 16% at this address vs 31% district-wide (-14 pts) — the specific schools serving this property underperform the Houston ISD average; the district grade overstates school quality for this exact location.
- Market conditions: Rents rising (+2.1%/yr); 675 active listings in the ZIP; 15 comparable units currently listed for rent nearby; rentals at typical pace (median 22d on market — plan ~3-4 weeks tenant-placement turnaround); lower-income renter base — watch delinquency; 29,883 units permitted in Harris County in 2024 (8,621 in 5+ unit buildings).
- At $2,143/mo this rent would consume 73% of the median local household income ($35k/yr) (locally 3210% of renters already pay >50% of income on rent) — very limited rent-growth headroom before tenants either downsize or default.
Forward outlook
- Local home prices are declining (-3.0%/yr); year-one equity from $2k of loan paydown is wiped out by about $7k of value loss. Plan a longer hold.
- Harris County population projected at +47% by 2050 — long-run rental-demand tailwind backs the buy-and-hold thesis.
Negotiation context
- It's been on market 16 days — a 2% lower offer ($228k) is reasonable based on typical stale-listing flexibility.
- 3 sale attempts since 5y ago with the ask held roughly flat each time — persistent listings suggest the price (not the market) is what's stuck; bring a comps-based counter.
- Current owner paid $77k; list at $232k implies a 201% gain — meaningful room to come down on a strong offer.
Risks & watch-outs
- Climate carrying-cost: severe wind risk, 99% chance of damaging wind over 30y; extreme-heat days projected 7→24/yr by 2055 (HVAC capex compounding) — expect insurance premiums to compound above CPI over the hold.
Questions for the listing agent
- Built in 1976 — when were the roof, HVAC, electrical panel, plumbing, and water heater last replaced?
- Is there a deadline driving the sale (1031 exchange, divorce, estate, relocation)? That informs how much negotiation room exists.
- Schools are D-rated, which usually means shorter tenancies and higher turnover. Who's the typical renter profile here, and what's been the actual vacancy rate?
- Crime grade is F in this area — have there been break-ins, vandalism, or insurance claims at this property in the last 3 years? What carrier currently insures it and at what premium?
- The area grade is low — what's the realistic commute time and amenity access for the typical tenant pool here? Any planned neighborhood developments (good or bad) we should know about?
- What's the average days-on-market for RENTAL listings here right now (not sales)? A rising rental-DOM trend means longer vacancies and softer asking-rent achievability than the comps imply.
- What's the recent tenant-quality profile in this submarket — average credit score on applications, eviction rate, late-payment / NSF rate, and stable-employment percentage? A property-management company in the area should have these aggregated.
- How much new for-sale + rental construction is in the pipeline within 1–3 miles? Heavy new supply typically softens prices + rents 12–24 months out; constrained supply supports both.
Investment metrics
- 1% rule
- 0.93% ✗
- Cap rate
- 6.40%
- Cash-on-cash
- 0.38%
- DSCR
- 1.02
- GRM
- 9.0
CMA / ARV
- ARV (on-the-fly)
- $348,002
- Comps found
- 12
Show comp detail 12 sales within ~0.75 mi
| Address | Dist | Beds/Ba | Sqft | Sold | Price | $/sf | Match |
|---|---|---|---|---|---|---|---|
| 5027 Golden Forest Dr Unit A | 0.20mi | 3/3.5 | 1,866 (+2%) | 3mo | $370,000 | $198 | 78 |
| 5016 Golden Forest Dr | 0.21mi | 3/2.5 | 1,922 (+6%) | 3mo | $374,990 | $195 | 77 |
| 5018 Golden Forest Dr | 0.21mi | 3/2.5 | 1,922 (+6%) | 3mo | $369,990 | $193 | 76 |
| 5013 Golden Forest Dr | 0.23mi | 3/2.5 | 1,950 (+7%) | 1mo | $359,995 | $185 | 75 |
| 4922 Hoover St Unit C | 0.48mi | 3/2.5 | 1,771 (-3%) | 0mo | $309,950 | $175 | 71 |
| 4922 Hoover St Unit B | 0.48mi | 3/2.5 | 1,771 (-3%) | 3mo | $309,950 | $175 | 69 |
| 5822 Birchmont Dr | 0.45mi | 3/2.5 | 1,706 (-6%) | 2mo | $434,900 | $255 | 65 |
| 4922 Hoover St Unit F | 0.48mi | 3/2.5 | 1,691 (-7%) | 1mo | $299,950 | $177 | 63 |
| 4922 Hoover St Unit A | 0.48mi | 3/2.5 | 1,704 (-6%) | 3mo | $309,500 | $182 | 62 |
| 4922 Hoover St Unit E | 0.48mi | 3/2.5 | 1,704 (-6%) | 4mo | $299,950 | $176 | 62 |
| 5630 Azores | 0.74mi | 3/2.5 | 1,731 (-5%) | 1mo | $329,900 | $191 | 54 |
| 5314 Verdome Ln | 0.65mi | 3/1.5 | 1,680 (-8%) | 3mo | $338,000 | $201 | 53 |
Match score weights: distance 35% · size 25% · config 20% · recency 20%. Top-matched comps best support the ARV.
Projected returns pro-forma
-3.0% appreciation · 2.1% rent growth · sell at horizon
- IRR
- -16.7%
- Equity multiple
- 0.41×
- Total profit
- $-38,039
- Equity at exit
- $34,517
- IRR
- -10.3%
- Equity multiple
- 0.40×
- Total profit
- $-38,861
- Equity at exit
- $20,016
Cash invested: $64,820 (down + closing). Projections, not guarantees.
Landlord ↔ Tenant lean methodology
- Overall (STATE)
- 87 Strongly Landlord-Friendly
- State Texas
- 87 Strongly Landlord-Friendly · R+5
- County
- — inherits STATE
- City
- — inherits STATE
ZIP-level market 77091
- Home prices YoY
- -24.9%
- Rents YoY
- 2.1%
- Active inventory
- 675
- Price-to-rent
- 9.0×
Monthly cashflow live
- Estimated rent
- $2,143 high interval (Pro) →
- Mortgage (P&I)
- −$1,214
- Tax from tax record
- −$361 /mo · $4,338/yr
- Insurance
- −$96
- HOA
- −$0
- Vacancy / Maint / Mgmt
- −$450
- Net cashflow
- $21
Break-even live
UW: 25.0% down · 7.5% · 30yr · 1.5% tax · 5.0% vac · 8.0% maint · 8.0% mgmt
Financing live
Cash to close
- Down payment
- $57,875
- Closing costs
- $6,945
- Reserves months
- —
- Total cash needed
- —
Loan-product check · same deal, 3 products live
Conventional
25% down · 7.5% · 30yr
- Down + closing
- —
- Monthly P&I
- —
- Monthly cashflow
- —
- DSCR
- —
- Eligible?
- —
Personal DTI + credit; lowest rate.
DSCR
20% down · 8.5% · 30yr
- Down + closing
- —
- Monthly P&I
- —
- Monthly cashflow
- —
- DSCR
- —
- Eligible?
- —
No personal income docs; deal must DSCR.
Hard money
10% down · 12.0% · 12mo
- Down + closing
- —
- Monthly P&I
- —
- Monthly cashflow
- —
- DSCR
- —
- Eligible?
- —
Short-term bridge; refi at stabilization.
Rent comps 15 comps
| Address | Beds | Baths | Sqft | Rent | $/sqft | DOM | Units | Dist |
|---|---|---|---|---|---|---|---|---|
| 5131 Spring Forest Dr Houston, TX | 3.0 | 2.5 | 1810 | $2,295 | $1.27 | 24d | 1 | 0.01mi |
| 5359 Deep Forest Dr Houston, TX | 3.0 | 2.0 | 1227 | $1,409 | $1.15 | 24d | 1 | 0.41mi |
| 6123 Birchmont Dr Houston, TX | 3.0 | 2.0 | 1879 | $2,700 | $1.44 | 43d | 1 | 0.73mi |
| 6240 Antoine Dr Unit 6273 Houston, TX | 3.0 | 2.0 | 1484 | $1,432 | $0.96 | 2d | 1 | 0.85mi |
| 6230 Rena St Unit 1316407P Houston, TX | 4.0 | 2.0 | 1765 | $6,957 | $3.94 | 3d | 1 | 0.90mi |
| 6200 W Tidwell Rd Houston, TX | 2.0–3.0 | 1.0–2.0 | 1101 | $1,300 | $1.18 | 2d | 11 | 0.90mi |
| 6318 Leaf Arbor Dr Houston, TX | 3.0 | 2.0 | 1478 | $2,250 | $1.52 | 43d | 1 | 0.97mi |
| 5503 Bertellis Ln Houston, TX | 4.0 | 2.0 | 2200 | $2,500 | $1.14 | 24d | 1 | 0.97mi |
| 4701 W 43rd St Houston, TX | 4.0 | 2.0 | 1508 | $2,400 | $1.59 | 4d | 1 | 1.03mi |
| 4601 W 43rd St Houston, TX | 4.0 | 2.0 | 1531 | $2,395 | $1.56 | 24d | 1 | 1.06mi |
| 6506 W 43rd St Unit 1115 Houston, TX | 3.0 | 2.0 | 1373 | $1,550 | $1.13 | 22d | 1 | 1.33mi |
| 6506 W 43rd St Unit 1115 Houston, TX | 3.0 | 2.0 | 1373 | $1,550 | $1.13 | 43d | 1 | 1.33mi |
| 4800 Lamonte Ln Unit 3613 Houston, TX | 2.0 | 2.5 | 1285 | $1,970 | $1.53 | 22d | 1 | 1.41mi |
| 4800 Lamonte Ln Unit 3615B Houston, TX | 2.0 | 2.5 | 1285 | $1,845 | $1.44 | 15d | 1 | 1.41mi |
| 4800 Lamonte Ln Unit 4833 Houston, TX | 3.0 | 2.0 | 1571 | $1,617 | $1.03 | 3d | 1 | 1.41mi |
Listing history 12 events
-
2026-06-18days on market $231,500 Active 16 DOM
-
2026-06-17price $231,500 Active 15 DOM
-
2026-06-17days on market $235,000 Active 15 DOM
-
2026-06-16days on market $235,000 Active 14 DOM
-
2026-06-15days on market $235,000 Active 13 DOM
-
2026-06-13days on market $235,000 Active 11 DOM
-
2026-06-09days on market $235,000 Active 7 DOM
-
2026-06-08days on market $235,000 Active 6 DOM
-
2026-06-07days on market $235,000 Active 5 DOM
-
2026-06-04days on market $235,000 Active 2 DOM
-
2026-06-03remarks 578-char remark
-
2026-06-03$235,000 Active 1 DOM
ⓘ Source: listings_history table (triggers on properties + properties_extension) + one-shot
backfill from property_details.listing_events for pre-trigger history.
Tax reassessment forecast TX · Resets to sale price
- Current annual tax
- $4,338 · $361/mo
- Projected year-2 tax
- $4,338 · $361/mo
- Expected delta
- $0/yr ($0/mo · 0.0%)
ⓘ Screening estimate from a state-policy table — verify with the county assessor before closing.
Climate risk First Street
- Flood 4/10 Moderate FEMA zone X (shaded) · 23% chance over 30 yrs
- Wildfire 1/10 Low
- Heat 9/10 Extreme 7 d/yr ≥109°F today · 24 d/yr by 30 yrs out
- Wind 9/10 Extreme 99% chance of damaging wind over 30 yrs
- Air quality 3/10 Moderate 3 unhealthy d/yr today · 3 by 30 yrs out
Nearby sold comps map
Loading sold comps map…
Walkable amenities ~0.75 mi
Loading nearby amenities…
Taxation est. · year 1
- Rental income
- $25,712
- − Mortgage interest
- −$12,968
- − Property taxes
- −$4,338
- − Insurance
- −$1,158
- − Repairs & maintenance
- −$2,057
- − Management
- −$2,057
- − Depreciation
- −$6,735
- Taxable loss
- −$3,600
- Est. tax savings @ 24.0%
- +$864
- After-tax cash flow
- $1,113/yr
For passive investors: Depreciation is non-cash, so a rental often shows a tax loss while cash-flowing — sheltering income. Rental losses are passive: they offset passive income freely, and up to $25,000/yr can offset ordinary (W-2) income if you actively participate and your MAGI is under $100k (phasing out to $0 by $150k); unused losses carry forward. On sale, claimed depreciation is recaptured at up to 25%, and gains may owe capital-gains tax (a 1031 exchange can defer both). Figures are a year-1 estimate at your 24.0% rate — not tax advice; consult a CPA.
Schools (NCES district)
- District
- Houston ISD
- NCES district ID
- 4823640
- Math proficiency
- 27% ▼ -18.00%
- Reading proficiency
- 35% ▼ -6.00%
- Median HH income
- $46,054
- Composite
- 26.63/100
- National rank
- #7173
- State rank
- #593 of 826 in TX
Livability — Houston
- Score
- 74/100
- State rank
- #184
- US rank
- #4771
Category grades
Schools grade is shown separately in the Schools card above.
Census & demographics
- Census place
- Houston, TX
- County
- Harris County · 4,702,590 people
- City population
- 3,226,434
- Metro
- Houston-The Woodlands-Sugar Land, TX
- Population (ZIP)
- 28,728
- Household income
- $35,432
- Rent vs Own
- Severe rent burden
- 3210.0
Population outlook (Harris County) Hauer SSP2
- Today (2025)
- 5,571,493 people
- By 2030
- 6,089,821 · +9.3%
- By 2040
- 7,142,806 · +28.2%
- By 2050
- 8,185,864 · +46.9%
- By 2075
- 10,574,329 · +89.8%
- By 2100
- 12,109,958 · +117.4%
Race, ethnicity, and origin ACS 2023
- Neighborhood character
- Diverse neighborhood (Simpson 0.58)
- Race & ethnicity
- Hispanic / Latino 46% Black 45% Two or more races 15% White 7%
- Hispanic origin (detail)
- Mexican 29%
- Common ancestry
- Italian 1%
- Foreign-born
- 24% · Canada, Jamaica
- Languages at home
- 55% English-only · Spanish 41% French/Haitian/Cajun 2%
Political lean MEDSL · Harris
- 2024 margin
- Lean D (+5.5) · D 52.0% · R 46.4% · Other 1.6%
- 2008→2024 swing
- +3.9pp toward D · 2008: 1.6pp · 2024: 5.5pp
- All cycles
- 2024: D+5.5 2020: D+13.3 2016: D+12.4 2012: D+0.1 2008: D+1.6
Not yet ingested
- Civics
- —
Market trends
- HPI YoY
- ▼ -94.19%
- Current HPI
- 283.7523
- Rent YoY
- ▲ 2.10%
- Metro
- Houston-The Woodlands-Sugar Land, TX
- State GDP YoY
- ▲ 3.95%
- F500 in state
- 110
Industry mix (Fortune 500 HQ in TX)
| Industry | F500 HQs | Revenue |
|---|---|---|
| Energy | 16 | $1,198B |
|
||
| Technology | 5 | $198B |
|
||
| Engineering / Construction | 4 | $72B |
|
||
| Energy Services | 3 | $60B |
|
||
| Utilities | 3 | $41B |
|
||
| Healthcare | 2 | $330B |
|
||
Price history
+205.2% since first listed11 events — show timeline
- 2026-06-02 Listed $235,000 HARMLS
- 2022-02-03 Price Changed $1,565 RENT.
- 2021-07-23 Sold (Public Records) — Public Records
- 2021-07-01 Sold (MLS) — HARMLS
- 2021-06-19 Pending — HARMLS
- 2021-06-07 Pending — HARMLS
- 2021-06-01 Relisted — HARMLS
- 2021-05-25 Pending — HARMLS
- 2021-05-07 Listed $214,900 HARMLS
- 1999-06-30 Sold (Public Records) — Public Records
- 1999-06-01 Sold (Public Records) $77,000 Public Records
Property tax history
+6.0%/yrLatest (2025): $4,338 · +8.7% YoY. Source: county tax records.
Cash-flow waterfall
monthlySold comps — $/sqft
last 12 mo · ≤1 miLoading sold comps…