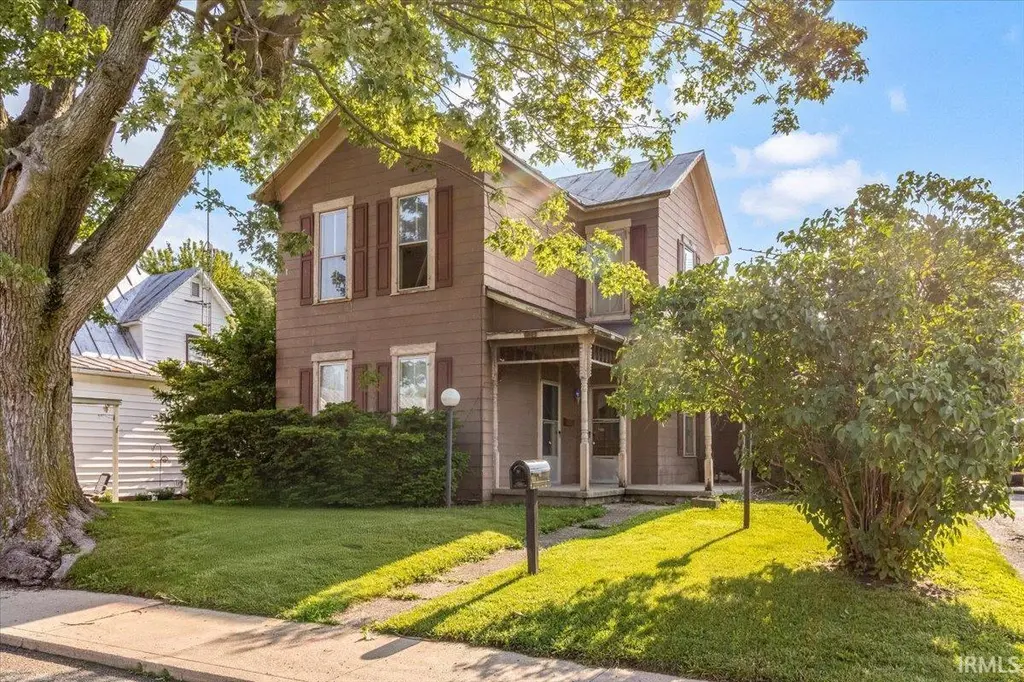
218 N Jackson St · Winchester, IN
Flood risk 1/10 · Minimal
- FEMA flood zone
- X (unshaded)
- Chance of flooding over 30 yrs
- 0.0%
- Est. flood insurance / yr
- $473 – $860
Fire risk 1/10 · Minimal
- Est. fire insurance / yr
- $717 – $1,331
Heat risk 3/10 · Minor
- Hot days now (above 100°F)
- 7 days/yr
- Hot days in 30 yrs
- 18 days/yr
Wind risk 2/10 · Minimal
- Chance of severe wind over 30 yrs
- 1.0%
Air-quality risk 3/10 · Minor
- Unhealthy air days now
- 2 days/yr
- Unhealthy air days in 30 yrs
- 4 days/yr
Risk factors via First Street. Map © Google.
Why this score? — see what drove the A grade
The composite is a weighted blend of 9 inputs, each scored 0–100. Each bar is that input's sub-score; the figure is the points it added to the 100-point composite (weight × sub-score).
- Cash flow +30.0/30.0
- ARV discount +15.0/15.0
- DSCR +10.0/10.0
- Appreciation +10.0/10.0
- 1% rule +9.3/10.0
- Livability +3.4/5.0
- Schools +2.9/10.0
- Rent growth +2.5/5.0
- Condition / age +2.5/5.0
$89,900
🖨 Deal sheet (PDF) 📄 Offer letter ✓ Due diligence
Listing remarks MLS
Spacious 3-4 bedroom, 1 bathroom home in Winchester! This property features large living spaces, main floor laundry, a generously sized bathroom, and a flexible layout with multiple bedroom options. Upstairs includes a bright loft area and two additional bedrooms filled with natural light. A great opportunity with plenty of space for a growing family or future updates.
Key facts
- Flexible layout
- Main floor laundry
- Bright loft area
Tags
Property features AI
Exterior
- Utilities: Public water; Public sewer
- Home design: Single-family residence (site-built); Two stories
- Construction: Vinyl siding; Asphalt, metal, and shingle roof
- Exterior features: No fencing; Shed(s) on the property
Interior
- Bathrooms: One full bathroom (main level)
- Heating & cooling: Natural gas heating; Baseboard heating; Window cooling units
- Interior features: Two fireplaces (living room; free standing); Basement is partial, unfinished with crawl space
- Laundry & utility: Laundry on the main level
Neighborhood map
What this means for you Summary
Snapshot
- This is a 4-bed/1.0-bath single-family listed at $90k.
Deal economics
- At list price, monthly cash flow is $348 ($4k/yr) — positive.
- The deal already cash-flows at list — no discount required.
- Meets the 1% rule at list price ($1k rent vs $90k).
- Recommended offer: $87k (3.0% below list) — sets the bar for market timing.
- Cap rate 10.9% vs local median 5.1% in Winchester — top-decile yield for the area; either an underpriced asset or a hidden risk that comps aren't pricing in. Stress-test before assuming the spread holds.
Location & tenants
- Location reads 67/100 on livability (#240 in IN) — a middle-class / working-renter tenant base. Strengths: cost of living A+, housing A+, crime B; Watch: health & safety D, amenities F, commute F.
- Randolph Central School Corporation (town): math 32% / reading 37% proficiency, ranked #201 of 301 in IN (top 67%) — families likely to look elsewhere, expect single-tenant / working-renter base with shorter leases.
- Zoned schools: Lee L Driver Middle School (math 27% / reading 33%, grade F, #208 of 330 statewide, top 64%, 291 students, 56% FRL); Winchester Community High School (math 17% / reading 47%, grade F, #295 of 369 statewide, top 82%, 414 students, 47% FRL).
- Market conditions: 52 active listings in the ZIP; 19 units permitted in Randolph County in 2024 (0 in 5+ unit buildings).
Forward outlook
- In year one you build about $10k of equity ($622 loan paydown + $9k appreciation (10.0% local appreciation)).
- Randolph County population projected at -26% by 2050 — secular population decline; favor cash flow + early exit over multi-decade hold.
- At projected returns (10.0% appreciation + 3.0% rent growth), your $25k cash investment doubles in ~2 years — after that, you're playing with house money.
- By year 4, paydown + projected appreciation supports a ~$34k cash-out refi (75% LTV) — recoverable capital for the next deal without selling this one.
Negotiation context
- It's been on market 31 days — a 3% lower offer ($87k) is reasonable based on typical stale-listing flexibility.
- 2 sale attempts; this cycle's ask has dropped $20k (18%) from the opening price — seller is motivated, your offer sets the floor, not the list.
Risks & watch-outs
- Watch-outs: built in 1900 — expect roof / HVAC / electrical / plumbing capex.
Questions for the listing agent
- It's been on market 31 days. Have you received any prior offers? Is the seller open to a 3% concession, seller financing, or rate buy-down credit?
- Built in 1900 — when were the roof, HVAC, electrical panel, plumbing, and water heater last replaced?
- Is there a deadline driving the sale (1031 exchange, divorce, estate, relocation)? That informs how much negotiation room exists.
- Schools are D-rated, which usually means shorter tenancies and higher turnover. Who's the typical renter profile here, and what's been the actual vacancy rate?
- What's the average days-on-market for RENTAL listings here right now (not sales)? A rising rental-DOM trend means longer vacancies and softer asking-rent achievability than the comps imply.
- What's the recent tenant-quality profile in this submarket — average credit score on applications, eviction rate, late-payment / NSF rate, and stable-employment percentage? A property-management company in the area should have these aggregated.
- How much new for-sale + rental construction is in the pipeline within 1–3 miles? Heavy new supply typically softens prices + rents 12–24 months out; constrained supply supports both.
Investment metrics
- 1% rule
- 1.43% ✓
- Cap rate
- 10.94%
- Cash-on-cash
- 16.61%
- DSCR
- 1.74
- GRM
- 5.8
CMA / ARV
- ARV (on-the-fly)
- $152,910
- Comps found
- 12
Show comp detail 12 sales within ~0.75 mi
| Address | Dist | Beds/Ba | Sqft | Sold | Price | $/sf | Match |
|---|---|---|---|---|---|---|---|
| 625 N West St | 0.38mi | 4/1.0 | 1,588 (-6%) | 2mo | $135,000 | $85 | 70 |
| 549 W Franklin St | 0.20mi | 4/2.0 | 1,860 (+10%) | 13mo | $197,000 | $106 | 60 |
| 603 Stone St | 0.64mi | 3/2.0 (-1) | 1,648 (-3%) | 3mo | $148,500 | $90 | 54 |
| 2 Crestwood Dr | 0.60mi | 3/2.0 (-1) | 1,650 (-3%) | 6mo | $259,900 | $158 | 53 |
| 701 N Main St | 0.50mi | 4/2.0 | 1,599 (-6%) | 14mo | $167,900 | $105 | 51 |
| 317 E North St | 0.55mi | 4/3.0 | 1,810 (+6%) | 6mo | $199,900 | $110 | 50 |
| 418 N Main St | 0.36mi | 3/1.0 (-1) | 1,472 (-13%) | 7mo | $99,900 | $68 | 50 |
| 619 Residence St | 0.57mi | 3/1.0 (-1) | 1,840 (+8%) | 8mo | $50,000 | $27 | 48 |
| 410 Thompson St | 0.72mi | 4/1.0 | 1,864 (+10%) | 6mo | $140,000 | $75 | 46 |
| 404 E Thompson St | 0.71mi | 3/2.0 (-1) | 1,574 (-7%) | 0mo | $175,000 | $111 | 45 |
| 619 Richmond St | 0.70mi | 4/1.5 | 1,520 (-10%) | 9mo | $125,000 | $82 | 40 |
| 426 E South St | 0.72mi | 3/1.5 (-1) | 1,922 (+13%) | 9mo | $99,000 | $52 | 30 |
Match score weights: distance 35% · size 25% · config 20% · recency 20%. Top-matched comps best support the ARV.
Projected returns pro-forma
10.0% appreciation · 3.0% rent growth · sell at horizon
- IRR
- 36.6%
- Equity multiple
- 3.83×
- Total profit
- $71,199
- Equity at exit
- $80,989
- IRR
- 31.5%
- Equity multiple
- 8.64×
- Total profit
- $192,309
- Equity at exit
- $174,656
Cash invested: $25,172 (down + closing). Projections, not guarantees.
Landlord ↔ Tenant lean methodology
- Overall (STATE)
- 90 Strongly Landlord-Friendly
- State Indiana
- 90 Strongly Landlord-Friendly · R+11
- County
- — inherits STATE
- City
- — inherits STATE
ZIP-level market 47394
- Home prices YoY
- 6.8%
- Active inventory
- 52
- Price-to-rent
- 5.8×
Monthly cashflow live
- Estimated rent
- $1,282 medium interval (Pro) →
- Mortgage (P&I)
- −$471
- Tax from tax record
- −$155 /mo · $1,862/yr
- Insurance
- −$37
- HOA
- −$0
- Vacancy / Maint / Mgmt
- −$269
- Net cashflow
- $348
Break-even live
Sensitivity live
| Price | -10% $399 | -5% $374 | +0% $348 | +5% $323 | +10% $298 |
|---|---|---|---|---|---|
| Rent | -10% $247 | -5% $298 | +0% $348 | +5% $399 | +10% $450 |
| Rate | -1.0pp $394 | -0.5pp $371 | base $348 | +0.5pp $325 | +1.0pp $301 |
UW: 25.0% down · 7.5% · 30yr · 1.5% tax · 5.0% vac · 8.0% maint · 8.0% mgmt
Financing live
Cash to close
- Down payment
- $22,475
- Closing costs
- $2,697
- Reserves months
- —
- Total cash needed
- —
Loan-product check · same deal, 3 products live
Conventional
25% down · 7.5% · 30yr
- Down + closing
- —
- Monthly P&I
- —
- Monthly cashflow
- —
- DSCR
- —
- Eligible?
- —
Personal DTI + credit; lowest rate.
DSCR
20% down · 8.5% · 30yr
- Down + closing
- —
- Monthly P&I
- —
- Monthly cashflow
- —
- DSCR
- —
- Eligible?
- —
No personal income docs; deal must DSCR.
Hard money
10% down · 12.0% · 12mo
- Down + closing
- —
- Monthly P&I
- —
- Monthly cashflow
- —
- DSCR
- —
- Eligible?
- —
Short-term bridge; refi at stabilization.
Listing history 18 events
-
2026-06-21days on market $89,900 Active 31 DOM
-
2026-06-18days on market $89,900 Active 29 DOM
-
2026-06-17price $89,900 Active 28 DOM
-
2026-06-17days on market $109,900 Active 28 DOM
-
2026-06-16days on market $109,900 Active 27 DOM
-
2026-06-15days on market $109,900 Active 26 DOM
-
2026-06-13days on market $109,900 Active 24 DOM
-
2026-06-12days on market $109,900 Active 23 DOM
-
2026-06-09days on market $109,900 Active 20 DOM
-
2026-06-08days on market $109,900 Active 19 DOM
-
2026-06-07days on market $109,900 Active 18 DOM
-
2026-06-04days on market $109,900 Active 14 DOM
-
2026-06-02days on market $109,900 Active 13 DOM
-
2026-06-01days on market $109,900 Active 12 DOM
-
2026-05-31days on market $109,900 Active 11 DOM
-
2026-05-31days on market $109,900 Active 10 DOM
-
2026-05-20$109,900 Active
Show marketing remark (371 chars)
Spacious 3-4 bedroom, 1 bathroom home in Winchester! This property features large living spaces, main floor laundry, a generously sized bathroom, and a flexible layout with multiple bedroom options. Upstairs includes a bright loft area and two additional bedrooms filled with natural light. A great opportunity with plenty of space for a growing family or future updates.
-
2026-05-20$109,900 Active 371-char remark
Show marketing remark (371 chars)
Spacious 3-4 bedroom, 1 bathroom home in Winchester! This property features large living spaces, main floor laundry, a generously sized bathroom, and a flexible layout with multiple bedroom options. Upstairs includes a bright loft area and two additional bedrooms filled with natural light. A great opportunity with plenty of space for a growing family or future updates.
ⓘ Source: listings_history table (triggers on properties + properties_extension) + one-shot
backfill from property_details.listing_events for pre-trigger history.
Tax reassessment forecast IN · Partial reset (capped growth)
- Current annual tax
- $1,862 · $155/mo
- Projected year-2 tax
- $1,862 · $155/mo
- Expected delta
- $0/yr ($0/mo · 0.0%)
ⓘ Screening estimate from a state-policy table — verify with the county assessor before closing.
Climate risk First Street
- Flood 1/10 Low FEMA zone X (unshaded) · 0% chance over 30 yrs
- Wildfire 1/10 Low
- Heat 3/10 Moderate 7 d/yr ≥100°F today · 18 d/yr by 30 yrs out
- Wind 2/10 Low 100% chance of damaging wind over 30 yrs
- Air quality 3/10 Moderate 2 unhealthy d/yr today · 4 by 30 yrs out
Nearby sold comps map
Loading sold comps map…
Walkable amenities ~0.75 mi
Loading nearby amenities…
Taxation est. · year 1
- Rental income
- $15,380
- − Mortgage interest
- −$5,036
- − Property taxes
- −$1,862
- − Insurance
- −$450
- − Repairs & maintenance
- −$1,230
- − Management
- −$1,230
- − Depreciation
- −$2,615
- Taxable income
- $2,956
- Est. tax owed @ 24.0%
- −$710
- After-tax cash flow
- $3,472/yr
For passive investors: Depreciation is non-cash, so a rental often shows a tax loss while cash-flowing — sheltering income. Rental losses are passive: they offset passive income freely, and up to $25,000/yr can offset ordinary (W-2) income if you actively participate and your MAGI is under $100k (phasing out to $0 by $150k); unused losses carry forward. On sale, claimed depreciation is recaptured at up to 25%, and gains may owe capital-gains tax (a 1031 exchange can defer both). Figures are a year-1 estimate at your 24.0% rate — not tax advice; consult a CPA.
Schools (NCES district)
- District
- Randolph Central School Corporation
- NCES district ID
- 1801770
- Math proficiency
- 32% ▼ -7.00%
- Reading proficiency
- 37% ▼ -4.00%
- Median HH income
- $41,627
- Composite
- 29.12/100
- National rank
- #6589
- State rank
- #201 of 301 in IN
Livability — Winchester
- Score
- 67/100
- State rank
- #240
- US rank
- #10313
Category grades
Schools grade is shown separately in the Schools card above.
Census & demographics
- Census place
- Winchester, IN
- City population
- 8,137
- Population (ZIP)
- 8,137
Population outlook (Randolph County) Hauer SSP2
- Today (2025)
- 22,998 people
- By 2030
- 21,815 · -5.1%
- By 2040
- 19,360 · -15.8%
- By 2050
- 17,010 · -26.0%
- By 2075
- 12,491 · -45.7%
- By 2100
- 8,986 · -60.9%
Race, ethnicity, and origin ACS 2023
- Neighborhood character
- Predominantly White (96%)
- Race & ethnicity
- White 96% Two or more races 2% Hispanic / Latino 1%
- Common ancestry
- Lithuanian 2% Italian 2% Slovak 2%
- Foreign-born
- 1%
- Languages at home
- 99% English-only · Spanish 1% Other Asian/Pacific 1%
Political lean MEDSL · Randolph
- 2024 margin
- Solid R (+53.7) · D 22.3% · R 75.9% · Other 1.8%
- 2008→2024 swing
- -44.9pp toward R · 2008: -8.8pp · 2024: -53.7pp
- All cycles
- 2024: R+53.7 2020: R+52.4 2016: R+48.5 2012: R+24.1 2008: R+8.8
Not yet ingested
- Civics
- —
Market trends
- HPI YoY
- ▲ 14.76%
- Current HPI
- 233.216
- Rent YoY
- —
- Metro
- —
- State GDP YoY
- ▲ 2.90%
- F500 in state
- 18
Industry mix (Fortune 500 HQ in IN)
| Industry | F500 HQs | Revenue |
|---|---|---|
| Industrial Machinery | 2 | $37B |
|
||
| Healthcare | 1 | $177B |
|
||
| Pharmaceuticals | 1 | $45B |
|
||
| Metals / Steel | 1 | $18B |
|
||
| Agriculture | 1 | $17B |
|
||
| Packaging | 1 | $12B |
|
||
Price history
+0.0% since first listed2 events — show timeline
- 2026-05-20 Listed $109,900 RRELMS
- 2026-05-20 Listed $109,900 IRMLS
Property tax history
+4.4%/yrLatest (2024): $1,862 · -8.5% YoY. Source: county tax records.
Cash-flow waterfall
monthlySold comps — $/sqft
last 12 mo · ≤1 miLoading sold comps…