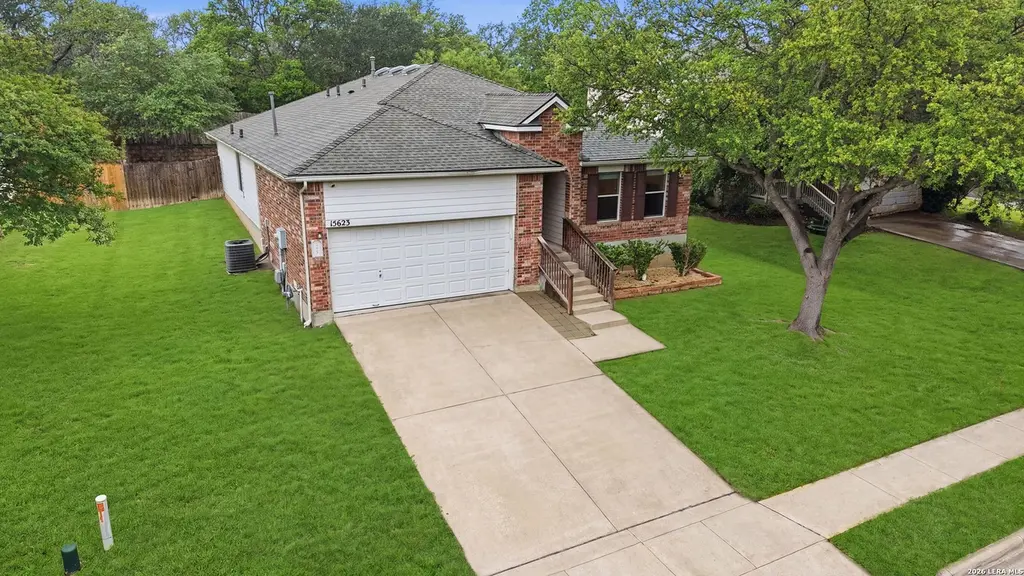
15623 Hastings Park · Selma, TX
Flood risk 1/10 · Minimal
- FEMA flood zone
- X (unshaded)
- Chance of flooding over 30 yrs
- 0.0%
- Est. flood insurance / yr
- $507 – $1,088
Fire risk 4/10 · Minor
- Est. fire insurance / yr
- $1,222 – $2,270
Heat risk 8/10 · Major
- Hot days now (above 108°F)
- 7 days/yr
- Hot days in 30 yrs
- 22 days/yr
Wind risk 8/10 · Major
- Chance of severe wind over 30 yrs
- 80.0%
Air-quality risk 2/10 · Minimal
- Unhealthy air days now
- 0 days/yr
- Unhealthy air days in 30 yrs
- 1 days/yr
Risk factors via First Street. Map © Google.
Why this score? — see what drove the D grade
The composite is a weighted blend of 9 inputs, each scored 0–100. Each bar is that input's sub-score; the figure is the points it added to the 100-point composite (weight × sub-score).
- ARV discount +15.0/15.0
- Cash flow +9.6/30.0
- 1% rule +3.9/10.0
- Livability +3.5/5.0
- DSCR +2.7/10.0
- Condition / age +2.5/5.0
- Schools +2.4/10.0
- Rent growth +1.8/5.0
- Appreciation +0.0/10.0
$199,900
🖨 Deal sheet (PDF) 📄 Offer letter ✓ Due diligence
Listing remarks MLS
FOR INFORMATION PLEASE CALL BLAKE OR ANDREW @ 210-651-1646 PULTE REGALIA PLAN. 1762 SQ FT. LOCATED IN BEAUTIFUL RETAMA RIDGE JUST 1 HALF MILE OF 1604 & I35. ALL HOMES BUILT ON OVERSIZED HOMESITES. GREAT LOCATION NEAR SHOPPING & ENTERTAINMENT! MOST POPULAR ONE STORY PLAN. GIBRALTER COUNTERTOPS. LOTS OF TILE.
Key facts
- Double vanity
- Open floor plan
- Walk-in shower
Tags
Property features AI
Finance
- Other: Possession at closing/funding
- Financial info: Down payment resource not indicated
- HOA & community: Located in the Lookout Meadow community (RETAMA RIDGE subdivision)
Exterior
- Parking: 2-car garage
- Security: Owned security system; Smoke alarm
- Utilities: Water system; Electric water heater; City garbage service
- Home design: Pre-owned single-family home; Built by Pulte; Approximate age: 21 years
- Construction: Slab foundation; Composition roof
- Exterior features: Brick and siding exterior; Three-sided masonry; Subdivision: RETAMA RIDGE; Lot in Lookout Meadow community
Interior
- Kitchen: Stove/Range; Smooth cooktop; Microwave; Dishwasher; Solid countertops; Walk-in pantry; 12 x 12 kitchen
- Bedrooms: Master bedroom on lower level with walk-in closet, ceiling fan and full bath; Bedroom 2 (14 x 10); Bedroom 3 (11 x 10)
- Flooring: Carpeting; Ceramic tile; Vinyl; Laminate
- Bathrooms: Two full bathrooms; Master bath with separate tub and shower
- Heating & cooling: Central heating (electric); Central air conditioning
- Interior features: Ceiling fans; Chandelier; Smoke alarm; Security system (owned); Garage door opener; Solid countertops; City garbage service; Living/dining room combination; Eat-in kitchen with breakfast bar; Two eating areas; Walk-in pantry; Utility room inside; Ground level / no steps; High ceilings; Open floor plan; All bedrooms downstairs; Laundry on main level; Walk-in closets; Attic with pull-down stairs; All window coverings remain
- Laundry & utility: Washer connection; Dryer connection; Utility room (8 x 6)
Neighborhood map
What this means for you Summary
Snapshot
- This is a 3-bed/2.0-bath single-family listed at $200k.
Deal economics
- At list price, monthly cash flow is $-135 ($-2k/yr) — negative.
- To cash-flow at today's rent, offer at most $176k (11.9% below list).
- To meet the 1% rule (rent ≥ 1% of price), the offer needs to be $178k (10.8% below list).
- Recommended offer: $176k (11.9% below list) — sets the bar for cash-flow.
- Cap rate 5.5% vs local median 4.1% in Selma — top-decile yield for the area; either an underpriced asset or a hidden risk that comps aren't pricing in. Stress-test before assuming the spread holds.
Location & tenants
- Location reads 69/100 on livability (#434 in TX) — a middle-class / working-renter tenant base. Strengths: housing A+, employment A, cost of living A; Watch: amenities F, commute F, health & safety F.
- Judson ISD (suburban): math 21% / reading 33% proficiency, ranked #660 of 826 in TX (top 80%) — low school quality limits family demand, transient renter base, plan for 1-2y turnover.
- Zoned schools: Rolling Meadows El (math 28% / reading 36%, grade F, #2,268 of 4,322 statewide, top 55%, 892 students, 62% FRL); Kitty Hawk Middle (math 21% / reading 34%, grade F, #1,156 of 1,662 statewide, top 71%, 1,237 students, 60% FRL); Judson H S (math 19% / reading 38%, grade F, #1,157 of 1,632 statewide, top 72%, 2,666 students, 62% FRL) — zoned schools at 61% FRL track the district average.
- Market conditions: Rents soft (-2.9%/yr); 506 active listings in the ZIP; 39 comparable units currently listed for rent nearby; rentals at typical pace (median 26d on market — plan ~3-4 weeks tenant-placement turnaround); solid renter incomes; 8,308 units permitted in Bexar County in 2024 (2,506 in 5+ unit buildings).
Forward outlook
- Local home prices are declining (-3.0%/yr); year-one equity from $1k of loan paydown is wiped out by about $6k of value loss. Plan a longer hold.
- Bexar County population projected at +50% by 2050 — long-run rental-demand tailwind backs the buy-and-hold thesis.
Negotiation context
- Only 10 days on market — expect competitive offers; lowballing is unlikely to land.
- 2 sale attempts since 21y ago with the ask held roughly flat each time — persistent listings suggest the price (not the market) is what's stuck; bring a comps-based counter.
Risks & watch-outs
- Climate carrying-cost: severe wind risk, 80% chance of damaging wind over 30y; extreme-heat days projected 7→22/yr by 2055 (HVAC capex compounding) — expect insurance premiums to compound above CPI over the hold.
Questions for the listing agent
- What do current leases actually rent for vs. the listed asking? Can we see a recent rent roll and the last 12 months of T-12 income?
- Is there a deadline driving the sale (1031 exchange, divorce, estate, relocation)? That informs how much negotiation room exists.
- Schools are D-rated, which usually means shorter tenancies and higher turnover. Who's the typical renter profile here, and what's been the actual vacancy rate?
- The area grade is low — what's the realistic commute time and amenity access for the typical tenant pool here? Any planned neighborhood developments (good or bad) we should know about?
- What's the average days-on-market for RENTAL listings here right now (not sales)? A rising rental-DOM trend means longer vacancies and softer asking-rent achievability than the comps imply.
- What's the recent tenant-quality profile in this submarket — average credit score on applications, eviction rate, late-payment / NSF rate, and stable-employment percentage? A property-management company in the area should have these aggregated.
- How much new for-sale + rental construction is in the pipeline within 1–3 miles? Heavy new supply typically softens prices + rents 12–24 months out; constrained supply supports both.
Investment metrics
- 1% rule
- 0.89% ✗
- Cap rate
- 5.48%
- Cash-on-cash
- -2.89%
- DSCR
- 0.87
- GRM
- 9.3
CMA / ARV
- ARV (median comp)
- $279,879
- List price
- $199,900
- Delta
- -28.58%
- Verdict
- UNDERPRICED
- Comps
- 20 within 1.0 mi
Show comp detail 12 sales within ~0.75 mi
| Address | Dist | Beds/Ba | Sqft | Sold | Price | $/sf | Match |
|---|---|---|---|---|---|---|---|
| 7710 Derby | 0.29mi | 3/2.0 | 1,744 (+1%) | 2mo | $264,990 | $152 | 84 |
| 8203 Ellerston | 0.35mi | 3/2.0 | 1,758 (+2%) | 1mo | $249,000 | $142 | 80 |
| 15802 Delaware | 0.07mi | 3/2.0 | 1,931 (+12%) | 5mo | $295,000 | $153 | 73 |
| 15843 Brisbane | 0.33mi | 3/2.0 | 1,798 (+4%) | 7mo | $179,900 | $100 | 72 |
| 7911 Saratoga | 0.46mi | 3/2.0 | 1,608 (-7%) | 2mo | $274,900 | $171 | 65 |
| 7706 Ruidoso Chase | 0.50mi | 4/2.0 (+1) | 1,710 (-1%) | 6mo | $255,000 | $149 | 65 |
| 7731 Derby Run | 0.61mi | 3/2.0 | 1,672 (-3%) | 9mo | $255,500 | $153 | 58 |
| 7635 Derby Run | 0.63mi | 4/2.0 (+1) | 1,672 (-3%) | 3mo | $280,000 | $167 | 58 |
| 16411 Alamo Derby | 0.55mi | 3/2.5 | 1,856 (+7%) | 4mo | $234,800 | $127 | 57 |
| 16427 Kentucky Rdg | 0.59mi | 3/2.5 | 1,624 (-6%) | 4mo | $249,000 | $153 | 57 |
| 16306 Rosebud Vis | 0.57mi | 3/2.0 | 1,513 (-12%) | 3mo | $275,000 | $182 | 50 |
| 16506 Caballo Vly | 0.61mi | 3/2.5 | 1,988 (+15%) | 2mo | $234,900 | $118 | 42 |
Match score weights: distance 35% · size 25% · config 20% · recency 20%. Top-matched comps best support the ARV.
Projected returns pro-forma
-3.0% appreciation · 0.0% rent growth · sell at horizon
- IRR
- -24.9%
- Equity multiple
- 0.18×
- Total profit
- $-46,091
- Equity at exit
- $29,806
- IRR
- -35.7%
- Equity multiple
- -0.27×
- Total profit
- $-70,892
- Equity at exit
- $17,284
Cash invested: $55,972 (down + closing). Projections, not guarantees.
Landlord ↔ Tenant lean methodology
- Overall (STATE)
- 87 Strongly Landlord-Friendly
- State Texas
- 87 Strongly Landlord-Friendly · R+5
- County
- — inherits STATE
- City
- — inherits STATE
ZIP-level market 78154
- Home prices YoY
- -17.6%
- Rents YoY
- -2.9%
- Active inventory
- 506
- Price-to-rent
- 9.3×
Monthly cashflow live
- Estimated rent
- $1,784 high interval (Pro) →
- Mortgage (P&I)
- −$1,048
- Tax from tax record
- −$413 /mo · $4,951/yr
- Insurance
- −$83
- HOA
- −$0
- Vacancy / Maint / Mgmt
- −$375
- Net cashflow
- $-135
Break-even live
Sensitivity live
| Price | -10% $-22 | -5% $-78 | +0% $-135 | +5% $-192 | +10% $-248 |
|---|---|---|---|---|---|
| Rent | -10% $-276 | -5% $-205 | +0% $-135 | +5% $-65 | +10% $6 |
| Rate | -1.0pp $-34 | -0.5pp $-84 | base $-135 | +0.5pp $-187 | +1.0pp $-239 |
UW: 25.0% down · 7.5% · 30yr · 1.5% tax · 5.0% vac · 8.0% maint · 8.0% mgmt
Financing live
Cash to close
- Down payment
- $49,975
- Closing costs
- $5,997
- Reserves months
- —
- Total cash needed
- —
Loan-product check · same deal, 3 products live
Conventional
25% down · 7.5% · 30yr
- Down + closing
- —
- Monthly P&I
- —
- Monthly cashflow
- —
- DSCR
- —
- Eligible?
- —
Personal DTI + credit; lowest rate.
DSCR
20% down · 8.5% · 30yr
- Down + closing
- —
- Monthly P&I
- —
- Monthly cashflow
- —
- DSCR
- —
- Eligible?
- —
No personal income docs; deal must DSCR.
Hard money
10% down · 12.0% · 12mo
- Down + closing
- —
- Monthly P&I
- —
- Monthly cashflow
- —
- DSCR
- —
- Eligible?
- —
Short-term bridge; refi at stabilization.
Rent comps 39 comps
| Address | Beds | Baths | Sqft | Rent | $/sqft | DOM | Units | Dist |
|---|---|---|---|---|---|---|---|---|
| 8110 Rosespur Park Selma, TX | 3.0 | 2.0 | 1758 | $1,800 | $1.02 | 25d | 1 | 0.19mi |
| 15803 Borwick Ln Selma, TX | 3.0 | 2.0 | 1758 | $1,595 | $0.91 | 25d | 1 | 0.24mi |
| 8130 Rosespur Park Selma, TX | 4.0 | 2.0 | 2086 | $1,875 | $0.90 | 14d | 1 | 0.25mi |
| 7902 Derby Vis Schertz, TX | 3.0 | 2.0 | 2005 | $1,895 | $0.95 | 45d | 1 | 0.27mi |
| 16302 Amberly Ct Schertz, TX | 3.0 | 2.0 | 1744 | $2,000 | $1.15 | 12d | 1 | 0.44mi |
| 7601 Gateway Blvd San Antonio, TX | 1.0–3.0 | 1.0–2.0 | 996 | $1,536 | $1.54 | 0d | 25 | 0.44mi |
| 15400 Lookout Rd Live Oak, TX | 1.0–3.0 | 1.0–2.0 | 1107 | $2,159 | $1.95 | 3d | 28 | 0.52mi |
| 15453 Lookout Rd Selma, TX | 2.0 | 1.0–2.0 | 843 | $1,655 | $1.96 | 3d | 25 | 0.52mi |
| 16505 Lookout Rd Selma, TX | 1.0–3.0 | 1.0–2.0 | 979 | $1,785 | $1.82 | 0d | 24 | 0.71mi |
| 7311 N Loop 1604 E San Antonio, TX | 1.0–2.0 | 1.0–2.0 | 849 | $1,377 | $1.62 | 0d | 27 | 0.72mi |
| 16611 Tenaca Trl San Antonio, TX | 3.0 | 2.0 | 1872 | $1,895 | $1.01 | 45d | 1 | 0.78mi |
| 7410 Tranquillo Way San Antonio, TX | 3.0 | 2.0 | 1725 | $2,000 | $1.16 | 23d | 1 | 0.89mi |
| 16833 Showdown Path Unit 2 Schertz, TX | 3.0 | 2.5 | 1151 | $1,300 | $1.13 | 45d | 1 | 0.95mi |
| 16819 Dancing Ava Unit 1 Selma, TX | 3.0 | 2.5 | 1300 | $1,575 | $1.21 | 6d | 1 | 0.96mi |
| 16808 Dancing Ava Unit 3 Selma, TX | 3.0 | 2.5 | 1219 | $1,295 | $1.06 | 45d | 1 | 0.96mi |
| 8246 Phoenix Ave Universal City, TX | 3.0 | 2.0 | 1521 | $1,700 | $1.12 | 25d | 1 | 0.98mi |
| 16824 Dancing Ava Unit 1 Selma, TX | 3.0 | 2.5 | 1160 | $2,600 | $2.24 | 45d | 1 | 1.00mi |
| 16905 Dancing Ava Unit 2 Selma, TX | 3.0 | 2.5 | 1175 | $1,425 | $1.21 | 45d | 1 | 1.04mi |
| 13803 Laramie Hl San Antonio, TX | 4.0 | 2.0 | 1862 | $2,095 | $1.13 | 16d | 1 | 1.05mi |
| 16917 Dancing Ava Unit 3 Selma, TX | 3.0 | 2.5 | 1219 | $1,324 | $1.09 | 23d | 1 | 1.07mi |
| 8323 Breezy Cv Unit 3 Selma, TX | 3.0 | 2.5 | 1219 | $1,450 | $1.19 | 25d | 1 | 1.10mi |
| 16918 Spirit Brk Unit 4 Selma, TX | 3.0 | 2.0 | 1400 | $1,325 | $0.95 | 45d | 1 | 1.12mi |
| 16922 Spirit Brk Unit 2 Selma, TX | 3.0 | 2.0 | 1400 | $1,325 | $0.95 | 45d | 1 | 1.14mi |
| 8335 Athenian Universal City, TX | 3.0 | 2.0 | 1753 | $1,725 | $0.98 | 19d | 1 | 1.19mi |
| 8335 Athenian Universal City, TX | 3.0 | 2.0 | 1753 | $1,725 | $0.98 | 25d | 1 | 1.19mi |
| 14406 Staghorn Gate San Antonio, TX | 3.0 | 2.5 | 2144 | $2,300 | $1.07 | 45d | 1 | 1.21mi |
| 13905 Oak Mdws Universal City, TX | 1.0–3.0 | 2.0 | 926 | $1,249 | $1.35 | 45d | 7 | 1.23mi |
| 14443 Mountainside Rdg San Antonio, TX | 3.0 | 2.5 | 2195 | $1,695 | $0.77 | 25d | 1 | 1.24mi |
| 7122 Teton Rdg San Antonio, TX | 3.0 | 2.0 | 1518 | $1,850 | $1.22 | 25d | 1 | 1.25mi |
| 7322 Raintree Frst San Antonio, TX | 3.0 | 2.0 | 1467 | $1,690 | $1.15 | 3d | 1 | 1.29mi |
| 7011 Raintree Frst San Antonio, TX | 3.0 | 2.0 | 1500 | $1,750 | $1.17 | 25d | 1 | 1.34mi |
| 9027 Harbour Town Selma, TX | 3.0 | 2.5 | 2136 | $1,800 | $0.84 | 45d | 1 | 1.40mi |
| 9006 Pinseeker Selma, TX | 3.0 | 2.0 | 1500 | $1,795 | $1.20 | 3d | 1 | 1.40mi |
| 13515 Demeter Universal City, TX | 4.0 | 3.0 | 1928 | $1,945 | $1.01 | 23d | 1 | 1.42mi |
| 7828 Pat Booker Rd Live Oak, TX | 1.0–3.0 | 1.0–2.0 | 1000 | $1,873 | $1.87 | 0d | 52 | 1.44mi |
| 13519 Thessaly Universal City, TX | 4.0 | 2.5 | 2099 | $3,100 | $1.48 | 45d | 1 | 1.46mi |
| 14819 Wilmington Schertz, TX | 3.0 | 2.0 | 1578 | $1,890 | $1.20 | 45d | 1 | 1.46mi |
| 13316 Reid Mdws Live Oak, TX | 3.0 | 2.5 | 1340 | $1,395 | $1.04 | 45d | 1 | 1.47mi |
| 6839 Raintree Frst San Antonio, TX | 3.0 | 2.0 | 1550 | $1,569 | $1.01 | 25d | 1 | 1.50mi |
Listing history 3 events
-
2026-05-14$199,900 New 767-char remark
-
2005-06-25soldstatus 319-char remark
Show marketing remark (319 chars)
FOR INFORMATION PLEASE CALL BLAKE OR ANDREW @ 210-651-1646 PULTE REGALIA PLAN. 1762 SQ FT. LOCATED IN BEAUTIFUL RETAMA RIDGE JUST 1 HALF MILE OF 1604 & I35. ALL HOMES BUILT ON OVERSIZED HOMESITES. GREAT LOCATION NEAR SHOPPING & ENTERTAINMENT! MOST POPULAR ONE STORY PLAN. GIBRALTER COUNTERTOPS. LOTS OF TILE.
-
2005-05-08$150,470 319-char remark
Show marketing remark (319 chars)
FOR INFORMATION PLEASE CALL BLAKE OR ANDREW @ 210-651-1646 PULTE REGALIA PLAN. 1762 SQ FT. LOCATED IN BEAUTIFUL RETAMA RIDGE JUST 1 HALF MILE OF 1604 & I35. ALL HOMES BUILT ON OVERSIZED HOMESITES. GREAT LOCATION NEAR SHOPPING & ENTERTAINMENT! MOST POPULAR ONE STORY PLAN. GIBRALTER COUNTERTOPS. LOTS OF TILE.
ⓘ Source: listings_history table (triggers on properties + properties_extension) + one-shot
backfill from property_details.listing_events for pre-trigger history.
Tax reassessment forecast TX · Resets to sale price
- Current annual tax
- $4,951 · $413/mo
- Projected year-2 tax
- $4,951 · $413/mo
- Expected delta
- $0/yr ($0/mo · 0.0%)
ⓘ Screening estimate from a state-policy table — verify with the county assessor before closing.
Climate risk First Street
- Flood 1/10 Low FEMA zone X (unshaded) · 0% chance over 30 yrs
- Wildfire 4/10 Moderate
- Heat 8/10 Severe 7 d/yr ≥108°F today · 22 d/yr by 30 yrs out
- Wind 8/10 Severe 80% chance of damaging wind over 30 yrs
- Air quality 2/10 Low 0 unhealthy d/yr today · 1 by 30 yrs out
Nearby sold comps map
Loading sold comps map…
Walkable amenities ~0.75 mi
Loading nearby amenities…
Taxation est. · year 1
- Rental income
- $21,405
- − Mortgage interest
- −$11,198
- − Property taxes
- −$4,951
- − Insurance
- −$1,000
- − Repairs & maintenance
- −$1,712
- − Management
- −$1,712
- − Depreciation
- −$5,815
- Taxable loss
- −$4,983
- Est. tax savings @ 24.0%
- +$1,196
- After-tax cash flow
- $-424/yr
For passive investors: Depreciation is non-cash, so a rental often shows a tax loss while cash-flowing — sheltering income. Rental losses are passive: they offset passive income freely, and up to $25,000/yr can offset ordinary (W-2) income if you actively participate and your MAGI is under $100k (phasing out to $0 by $150k); unused losses carry forward. On sale, claimed depreciation is recaptured at up to 25%, and gains may owe capital-gains tax (a 1031 exchange can defer both). Figures are a year-1 estimate at your 24.0% rate — not tax advice; consult a CPA.
Schools (NCES district)
- District
- Judson ISD
- NCES district ID
- 4824990
- Math proficiency
- 21% ▼ -21.00%
- Reading proficiency
- 33% ▼ -7.00%
- Median HH income
- $57,542
- Composite
- 24.39/100
- National rank
- #7689
- State rank
- #660 of 826 in TX
Livability — Selma
- Score
- 69/100
- State rank
- #434
- US rank
- #8922
Category grades
Schools grade is shown separately in the Schools card above.
Census & demographics
- Census place
- Selma, TX
- County
- Guadalupe County · 147,291 people
- Metro
- San Antonio-New Braunfels, TX
- Population (ZIP)
- 41,907
- Household income
- $100,572
- Rent vs Own
- Severe rent burden
- 776.0
Population outlook (Bexar County) Hauer SSP2
- Today (2025)
- 2,336,851 people
- By 2030
- 2,560,728 · +9.6%
- By 2040
- 3,020,569 · +29.3%
- By 2050
- 3,493,522 · +49.5%
- By 2075
- 4,668,459 · +99.8%
- By 2100
- 5,533,242 · +136.8%
Race, ethnicity, and origin ACS 2023
- Neighborhood character
- Diverse neighborhood (Simpson 0.66)
- Race & ethnicity
- White 46% Hispanic / Latino 32% Two or more races 19% Black 15% Asian 2%
- Hispanic origin (detail)
- Mexican 26%
- Common ancestry
- Italian 3% Romanian 3% Lithuanian 2%
- Foreign-born
- 6% · Canada
- Languages at home
- 82% English-only · Spanish 16% German/W. Germanic 1% Other Indo-European 1%
Political lean MEDSL · Bexar
- 2024 margin
- Lean D (+9.8) · D 54.3% · R 44.6% · Other 1.1%
- 2008→2024 swing
- +4.2pp toward D · 2008: 5.6pp · 2024: 9.8pp
- All cycles
- 2024: D+9.8 2020: D+18.2 2016: D+13.5 2012: D+4.6 2008: D+5.6
Not yet ingested
- Civics
- —
Market trends
- HPI YoY
- ▼ -47.53%
- Current HPI
- 222.8314
- Rent YoY
- ▼ -2.86%
- Metro
- San Antonio-New Braunfels, TX
- State GDP YoY
- ▲ 3.95%
- F500 in state
- 110
Industry mix (Fortune 500 HQ in TX)
| Industry | F500 HQs | Revenue |
|---|---|---|
| Energy | 16 | $1,198B |
|
||
| Technology | 5 | $198B |
|
||
| Engineering / Construction | 4 | $72B |
|
||
| Energy Services | 3 | $60B |
|
||
| Utilities | 3 | $41B |
|
||
| Healthcare | 2 | $330B |
|
||
Price history
+32.9% since first listed4 events — show timeline
- 2026-05-24 Pending — LERA
- 2026-05-14 Listed $199,900 LERA
- 2005-06-25 Sold (MLS) — LERA
- 2005-05-08 Listed $150,470 LERA
Property tax history
+12.4%/yrLatest (2025): $4,951 · -5.1% YoY. Source: county tax records.
Cash-flow waterfall
monthlySold comps — $/sqft
last 12 mo · ≤1 miLoading sold comps…