105 Green Pasture Rd · Fountain Inn, SC
Flood risk No data
- FEMA flood zone
- —
- Chance of flooding over 30 yrs
- —
- Est. flood insurance / yr
- —
Fire risk No data
- Est. fire insurance / yr
- —
Heat risk No data
- Hot days now (above threshold)
- —
- Hot days in 30 yrs
- —
Wind risk No data
- Chance of severe wind over 30 yrs
- —
Air-quality risk No data
- Unhealthy air days now
- —
- Unhealthy air days in 30 yrs
- —
Risk factors via First Street. Map © Google.
Why this score? — see what drove the D- grade
The composite is a weighted blend of 9 inputs, each scored 0–100. Each bar is that input's sub-score; the figure is the points it added to the 100-point composite (weight × sub-score).
- Cash flow +7.6/30.0
- ARV discount +7.5/15.0
- Appreciation +6.7/10.0
- Schools +4.2/10.0
- Livability +4.1/5.0
- 1% rule +3.0/10.0
- Rent growth +2.5/5.0
- Condition / age +2.5/5.0
- DSCR +1.7/10.0
$299,990
🖨 Deal sheet (PDF) 📄 Offer letter ✓ Due diligence
Listing remarks
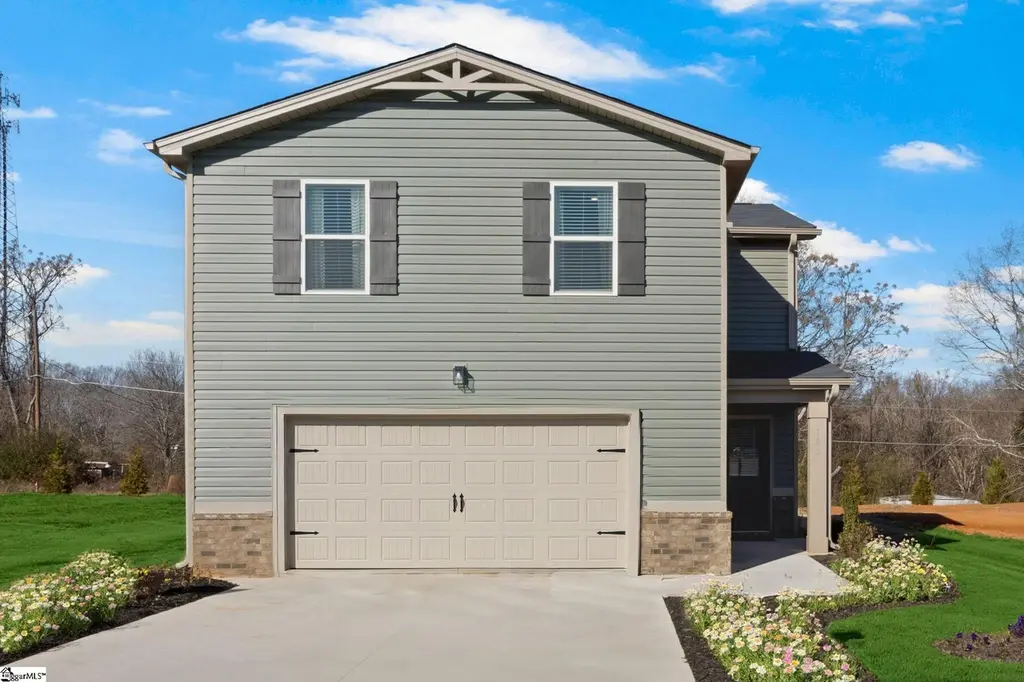
This home now includes a privacy fenced back yard! Welcome to the Sierra plan at Reedy Creek—now available for its very first owner! This stunning former model home offers 4 spacious bedrooms and 2.5 baths, showcasing thoughtful design and quality finishes throughout. The kitchen features abundant cabinet and counter space with beautiful granite countertops, perfect for everyday living and entertaining. Enjoy the convenience of full irrigation and a gorgeous, level lot ideal for outdoor enjoyment. Located just 5 minutes from charming downtown Fountain Inn, this home combines comfort, style, and an unbeatable location. Don’t miss the opportunity to own a former model in one of th
Key facts
- Former model home
- Full irrigation
- Level lot
Tags
Property features AI
Finance
- HOA & community: Has homeowners association; HOA covers common area insurance, by-laws, restrictive covenants, and other items (see remarks); Community amenities include common areas and a playground
Exterior
- Parking: Attached 2-car garage with key pad entry; Driveway parking (paved)
- Security: Key pad entry for garage
- Utilities: Public water; Public sewer; Electric water heater; Garbage pickup: none specified; Attached garage (electric available); Heat pump cooling system
- Home design: 2 stories; Model: Sierra; New construction (2025)
- Construction: Composition shingle roof; Slab foundation; Built by Dream Finders Homes; Attic and garage storage
- Exterior features: Patio; Tilt-out windows; Thermal windows; Vinyl siding
Interior
- Kitchen: Dishwasher; Electric oven; Electric standalone range; Built-in microwave
- Bedrooms: Primary bedroom: Other/See Remarks; Primary bedroom size approximately 14 x 14; Second bedroom size approximately 12 x 11; Third bedroom size approximately 12 x 11; Fourth bedroom size approximately 11 x 12
- Flooring: Carpet; Luxury vinyl tile/plank
- Bathrooms: 2 full bathrooms; 1 half bathroom
- Heating & cooling: Heat pump; Electric heating; Floor furnace
- Interior features: Attic stairs (disappearing); Cable available; Ceiling fans; Smooth ceilings; Granite countertops; Open floor plan; Garden tub; Walk-in closet; Pantry/closet; Smart systems pre-wiring; Window treatments remain; Other (see remarks)
- Laundry & utility: Laundry on 2nd floor; Washer connection; Electric dryer hookup
Neighborhood map
What this means for you Summary
Snapshot
- This is a 4-bed/2.5-bath other listed at $300k.
Deal economics
- At list price, monthly cash flow is $-358 ($-4k/yr) — negative.
- To cash-flow at today's rent, offer at most $237k (21.1% below list).
- To meet the 1% rule (rent ≥ 1% of price), the offer needs to be $240k (20.2% below list).
- Recommended offer: $237k (21.1% below list) — sets the bar for cash-flow.
Location & tenants
- Location reads 82/100 on livability (#4 in SC, #1,162 nationally) — a professional / high-income tenant draw. Strengths: crime A+, cost of living A+, housing A+; Watch: commute F.
- Greenville 01 (suburban): math 44% / reading 54% proficiency, ranked #10 of 80 in SC (top 12%) — families likely to look elsewhere, expect single-tenant / working-renter base with shorter leases.
- Zoned schools: Fountain Inn Elementary (math 48% / reading 47%, grade D, #199 of 597 statewide, top 35%, 835 students, 100% FRL) — zoned schools average 100% FRL vs 42% district-wide (58 pts higher); higher-poverty schools than district average — tighter screening recommended.
- Market conditions: 19 active listings in the ZIP; 1 comparable units currently listed for rent nearby; 621 units permitted in Laurens County in 2024 (0 in 5+ unit buildings).
Forward outlook
- In year one you build about $12k of equity ($2k loan paydown + $10k appreciation (3.4% local appreciation)).
- Laurens County population projected to shrink 7% by 2050 — rents likely to lag national; underwrite the cash flow, not the appreciation.
- By year 3, paydown + projected appreciation supports a ~$30k cash-out refi (75% LTV) — recoverable capital for the next deal without selling this one.
Negotiation context
- It's been on market 51 days — a 3% lower offer ($291k) is reasonable based on typical stale-listing flexibility.
- 3 sale attempts with the ask held roughly flat each time — persistent listings suggest the price (not the market) is what's stuck; bring a comps-based counter.
Questions for the listing agent
- What do current leases actually rent for vs. the listed asking? Can we see a recent rent roll and the last 12 months of T-12 income?
- It's been on market 51 days. Have you received any prior offers? Is the seller open to a 21% concession, seller financing, or rate buy-down credit?
- What does the HOA fee cover, when was the last increase, and are there any pending special assessments or reserve-fund shortfalls?
- Is there a deadline driving the sale (1031 exchange, divorce, estate, relocation)? That informs how much negotiation room exists.
- The area grade is low — what's the realistic commute time and amenity access for the typical tenant pool here? Any planned neighborhood developments (good or bad) we should know about?
- What's the average days-on-market for RENTAL listings here right now (not sales)? A rising rental-DOM trend means longer vacancies and softer asking-rent achievability than the comps imply.
- What's the recent tenant-quality profile in this submarket — average credit score on applications, eviction rate, late-payment / NSF rate, and stable-employment percentage? A property-management company in the area should have these aggregated.
- How much new for-sale + rental construction is in the pipeline within 1–3 miles? Heavy new supply typically softens prices + rents 12–24 months out; constrained supply supports both.
Investment metrics
- 1% rule
- 0.80% ✗
- Cap rate
- 4.86%
- Cash-on-cash
- -5.11%
- DSCR
- 0.77
- GRM
- 10.4
CMA / ARV
No comps found within radius.
Projected returns pro-forma
3.35% appreciation · 3.0% rent growth · sell at horizon
- IRR
- 3.9%
- Equity multiple
- 1.23×
- Total profit
- $19,162
- Equity at exit
- $140,899
- IRR
- 7.0%
- Equity multiple
- 2.11×
- Total profit
- $93,473
- Equity at exit
- $221,936
Cash invested: $83,997 (down + closing). Projections, not guarantees.
Landlord ↔ Tenant lean methodology
- Overall (STATE)
- 90 Strongly Landlord-Friendly
- State South Carolina
- 90 Strongly Landlord-Friendly · R+6
- County
- — inherits STATE
- City
- — inherits STATE
ZIP-level market 29664
- Home prices YoY
- 1.5%
- Active inventory
- 19
- Price-to-rent
- 10.4×
Monthly cashflow live
- Estimated rent
- $2,395 medium interval (Pro) →
- Mortgage (P&I)
- −$1,573
- Tax from tax record
- −$501 /mo · $6,017/yr
- Insurance
- −$125
- HOA
- −$50
- Vacancy / Maint / Mgmt
- −$503
- Net cashflow
- $-358
Break-even live
Sensitivity live
| Price | -10% $-188 | -5% $-273 | +0% $-358 | +5% $-442 | +10% $-527 |
|---|---|---|---|---|---|
| Rent | -10% $-547 | -5% $-452 | +0% $-358 | +5% $-263 | +10% $-168 |
| Rate | -1.0pp $-206 | -0.5pp $-281 | base $-358 | +0.5pp $-435 | +1.0pp $-514 |
UW: 25.0% down · 7.5% · 30yr · 1.5% tax · 5.0% vac · 8.0% maint · 8.0% mgmt
Financing live
Cash to close
- Down payment
- $74,998
- Closing costs
- $9,000
- Reserves months
- —
- Total cash needed
- —
Loan-product check · same deal, 3 products live
Conventional
25% down · 7.5% · 30yr
- Down + closing
- —
- Monthly P&I
- —
- Monthly cashflow
- —
- DSCR
- —
- Eligible?
- —
Personal DTI + credit; lowest rate.
DSCR
20% down · 8.5% · 30yr
- Down + closing
- —
- Monthly P&I
- —
- Monthly cashflow
- —
- DSCR
- —
- Eligible?
- —
No personal income docs; deal must DSCR.
Hard money
10% down · 12.0% · 12mo
- Down + closing
- —
- Monthly P&I
- —
- Monthly cashflow
- —
- DSCR
- —
- Eligible?
- —
Short-term bridge; refi at stabilization.
Rent comps 1 comps
| Address | Beds | Baths | Sqft | Rent | $/sqft | DOM | Units | Dist |
|---|---|---|---|---|---|---|---|---|
| 422 Yellowstone Trl Gray Court, SC | 5.0 | 3.0 | 1934 | $2,395 | $1.24 | 16d | 1 | 1.40mi |
HOA detail
- Monthly dues
- $50 · $600/yr
Listing history 13 events
-
2026-05-03status Pending
-
2026-04-12price $299,990
-
2026-03-28price $303,402
-
2026-03-13$294,990 Active
-
2026-03-13historical
-
2026-02-27price $294,990
-
2026-02-14price $299,940
-
2026-01-16price $308,940
-
2026-01-08historical
-
2026-01-07$308,990 Active
-
2025-12-11$308,990 Active
-
2025-01-27soldstatus $3,892,994
-
2024-07-03soldstatus $2,025,000
ⓘ Source: listings_history table (triggers on properties + properties_extension) + one-shot
backfill from property_details.listing_events for pre-trigger history.
Tax reassessment forecast SC · Resets to sale price
- Current annual tax
- $6,017 · $501/mo
- Projected year-2 tax
- $6,017 · $501/mo
- Expected delta
- $0/yr ($0/mo · 0.0%)
ⓘ Screening estimate from a state-policy table — verify with the county assessor before closing.
Nearby sold comps map
Loading sold comps map…
Walkable amenities ~0.75 mi
Loading nearby amenities…
Taxation est. · year 1
- Rental income
- $28,740
- − Mortgage interest
- −$16,804
- − Property taxes
- −$6,017
- − Insurance
- −$1,500
- − Repairs & maintenance
- −$2,299
- − Management
- −$2,299
- − HOA
- −$600
- − Depreciation
- −$8,727
- Taxable loss
- −$9,506
- Est. tax savings @ 24.0%
- +$2,281
- After-tax cash flow
- $-2,009/yr
For passive investors: Depreciation is non-cash, so a rental often shows a tax loss while cash-flowing — sheltering income. Rental losses are passive: they offset passive income freely, and up to $25,000/yr can offset ordinary (W-2) income if you actively participate and your MAGI is under $100k (phasing out to $0 by $150k); unused losses carry forward. On sale, claimed depreciation is recaptured at up to 25%, and gains may owe capital-gains tax (a 1031 exchange can defer both). Figures are a year-1 estimate at your 24.0% rate — not tax advice; consult a CPA.
Schools (NCES district)
- District
- Greenville 01
- NCES district ID
- 4502310
- Math proficiency
- 44% ▼ -10.00%
- Reading proficiency
- 54% ▼ -2.00%
- Median HH income
- $49,596
- Composite
- 41.88/100
- National rank
- #3370
- State rank
- #10 of 80 in SC
Livability — Fountain Inn
- Score
- 82/100
- State rank
- #4
- US rank
- #1162
Category grades
Schools grade is shown separately in the Schools card above.
Census & demographics
- City population
- 22,907
- Population (ZIP)
- 1,754
Population outlook (Laurens County) Hauer SSP2
- Today (2025)
- 66,741 people
- By 2030
- 66,454 · -0.4%
- By 2040
- 64,881 · -2.8%
- By 2050
- 61,941 · -7.2%
- By 2075
- 53,266 · -20.2%
- By 2100
- 41,495 · -37.8%
Race, ethnicity, and origin ACS 2023
- Neighborhood character
- Predominantly White (99%)
- Race & ethnicity
- White 99%
- Common ancestry
- Italian 4% Serbian 3% Slovak 2%
- Languages at home
- 99% English-only · German/W. Germanic 1%
Political lean MEDSL · Laurens
- 2024 margin
- Solid R (+40.9) · D 29.0% · R 69.9% · Other 1.1%
- 2008→2024 swing
- -22.8pp toward R · 2008: -18.1pp · 2024: -40.9pp
- All cycles
- 2024: R+40.9 2020: R+32.3 2016: R+29.9 2012: R+17.5 2008: R+18.1
Not yet ingested
- Civics
- —
Market trends
- HPI YoY
- ▲ 3.35%
- Current HPI
- 230.1147
- Rent YoY
- —
- Metro
- —
- State GDP YoY
- ▲ 4.51%
- F500 in state
- 2
Industry mix (Fortune 500 HQ in SC)
| Industry | F500 HQs | Revenue |
|---|---|---|
| Packaging | 1 | $7B |
|
||
Price history
-85.2% since first listed13 events — show timeline
- 2026-05-03 Pending — Greater Greenville MLS
- 2026-04-12 Price Changed $299,990 Greater Greenville MLS
- 2026-03-28 Price Changed $303,402 Greater Greenville MLS
- 2026-03-13 Listed $294,990 Greater Greenville MLS
- 2026-03-13 Listing Removed — Greater Greenville MLS
- 2026-02-27 Price Changed $294,990 Greater Greenville MLS
- 2026-02-14 Price Changed $299,940 Greater Greenville MLS
- 2026-01-16 Price Changed $308,940 Greater Greenville MLS
- 2026-01-08 Listing Removed — Greater Greenville MLS
- 2026-01-07 Listed $308,990 Greater Greenville MLS
- 2025-12-11 Listed $308,990 Greater Greenville MLS
- 2025-01-27 Sold (Public Records) $3,892,994 Public Records
- 2024-07-03 Sold (Public Records) $2,025,000 Public Records
Property tax history
+554.1%/yrLatest (2025): $6,017 · +554.1% YoY. Source: county tax records.
Cash-flow waterfall
monthlySold comps — $/sqft
last 12 mo · ≤1 miLoading sold comps…