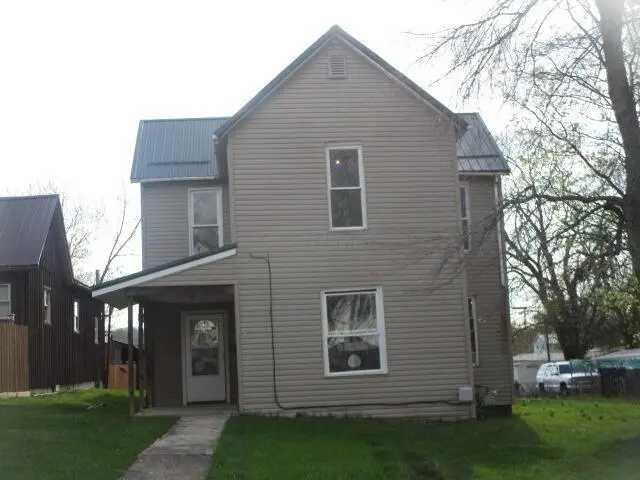
268 S Wisconsin Ave · Wellston, OH
Flood risk 1/10 · Minimal
- FEMA flood zone
- X (unshaded)
- Chance of flooding over 30 yrs
- 0.0%
- Est. flood insurance / yr
- $473 – $860
Fire risk 4/10 · Minor
- Est. fire insurance / yr
- $713 – $1,323
Heat risk 4/10 · Minor
- Hot days now (above 100°F)
- 7 days/yr
- Hot days in 30 yrs
- 19 days/yr
Wind risk 2/10 · Minimal
- Chance of severe wind over 30 yrs
- 1.0%
Air-quality risk 2/10 · Minimal
- Unhealthy air days now
- 0 days/yr
- Unhealthy air days in 30 yrs
- 1 days/yr
Risk factors via First Street. Map © Google.
Why this score? — see what drove the B grade
The composite is a weighted blend of 9 inputs, each scored 0–100. Each bar is that input's sub-score; the figure is the points it added to the 100-point composite (weight × sub-score).
- Cash flow +30.0/30.0
- 1% rule +10.0/10.0
- DSCR +10.0/10.0
- ARV discount +7.5/15.0
- Appreciation +3.5/10.0
- Schools +3.5/10.0
- Livability +3.4/5.0
- Rent growth +2.5/5.0
- Condition / age +2.5/5.0
$58,000
🖨 Deal sheet 📄 Offer letter ✓ Due diligence
Listing remarks MLS
Great opportunity for this fixer upper located in town! Spacious home with lots of potential, just needs some TLC. Vinyl siding and metal roof, just waiting for your personal touch. Use your vision the make it your own!
Key facts
- Metal roof
- Vinyl siding
- 6,969 sq ft lot
Tags
Neighborhood map
What this means for you Summary
Snapshot
- This is a 3-bed/1.0-bath single-family listed at $58k.
Deal economics
- At list price, monthly cash flow is $404 ($5k/yr) — positive.
- The deal already cash-flows at list — no discount required.
- Meets the 1% rule at list price ($1k rent vs $58k).
- Recommended offer: $55k (6.0% below list) — sets the bar for market timing.
- Cap rate 14.7% vs local median 3.2% in Wellston — top-decile yield for the area; either an underpriced asset or a hidden risk that comps aren't pricing in. Stress-test before assuming the spread holds.
Location & tenants
- Location reads 67/100 on livability (#606 in OH) — a middle-class / working-renter tenant base. Strengths: cost of living A+, housing A+, crime B; Watch: health & safety C-, employment D, amenities F.
- Wellston City (rural): math 38% / reading 47% proficiency, ranked #532 of 656 in OH (top 81%) — families likely to look elsewhere, expect single-tenant / working-renter base with shorter leases.
- Market conditions: 50 active listings in the ZIP; 32 units permitted in Jackson County in 2024 (0 in 5+ unit buildings).
Forward outlook
- Local home prices are declining (-3.0%/yr); year-one equity from $401 of loan paydown is wiped out by about $2k of value loss. Plan a longer hold.
- Jackson County population projected at -22% by 2050 — secular population decline; favor cash flow + early exit over multi-decade hold.
- At projected returns (-3.0% appreciation + 3.0% rent growth), your $16k cash investment doubles in ~5 years — after that, you're playing with house money.
Negotiation context
- It's been on market 78 days — a 6% lower offer ($55k) is reasonable based on typical stale-listing flexibility.
- 2 sale attempts; this cycle's ask has dropped $4k (7%) from the opening price — seller is motivated, your offer sets the floor, not the list.
Risks & watch-outs
- Watch-outs: built in 1900 — expect roof / HVAC / electrical / plumbing capex.
Questions for the listing agent
- It's been on market 78 days. Have you received any prior offers? Is the seller open to a 6% concession, seller financing, or rate buy-down credit?
- Built in 1900 — when were the roof, HVAC, electrical panel, plumbing, and water heater last replaced?
- Why hasn't it sold? Are there any deal-killer items the seller is aware of (foundation, flood, title, zoning, code violations)?
- Is there a deadline driving the sale (1031 exchange, divorce, estate, relocation)? That informs how much negotiation room exists.
- What's the average days-on-market for RENTAL listings here right now (not sales)? A rising rental-DOM trend means longer vacancies and softer asking-rent achievability than the comps imply.
- What's the recent tenant-quality profile in this submarket — average credit score on applications, eviction rate, late-payment / NSF rate, and stable-employment percentage? A property-management company in the area should have these aggregated.
- How much new for-sale + rental construction is in the pipeline within 1–3 miles? Heavy new supply typically softens prices + rents 12–24 months out; constrained supply supports both.
Investment metrics
- 1% rule
- 1.75% ✓
- Cap rate
- 14.66%
- Cash-on-cash
- 29.87%
- DSCR
- 2.33
- GRM
- 4.8
CMA / ARV
- ARV (median comp)
- $156,516
- List price
- $58,000
- Delta
- -62.94%
- Verdict
- UNDERPRICED
- Comps
- 20 within 1.0 mi
Show comp detail 12 sales within ~0.75 mi
| Address | Dist | Beds/Ba | Sqft | Sold | Price | $/sf | Match |
|---|---|---|---|---|---|---|---|
| 234 S Minnesota Ave | 0.09mi | 3/2.0 | 1,532 (-8%) | 11mo | $213,500 | $139 | 70 |
| 224 W 4th St | 0.07mi | 3/2.0 | 1,456 (-12%) | 7mo | $190,000 | $130 | 66 |
| 260 S Minnesota Ave | 0.06mi | 4/2.5 (+1) | 1,716 (+4%) | 21mo | $126,500 | $74 | 63 |
| 511 E Broadway St | 0.66mi | 4/1.0 (+1) | 1,656 (0%) | 8mo | $86,000 | $52 | 58 |
| 850 Kansas Ave | 0.46mi | 3/2.0 | 1,568 (-5%) | 17mo | $235,000 | $150 | 52 |
| 398 No. 8 Pike | 0.67mi | 3/1.5 | 1,568 (-5%) | 9mo | $255,000 | $163 | 50 |
| 398 Number 8 Pike | 0.72mi | 3/1.5 | 1,568 (-5%) | 9mo | $255,000 | $163 | 48 |
| 1040 W Broadway St St | 0.66mi | 3/2.0 | 1,508 (-9%) | 6mo | $265,000 | $176 | 45 |
| 436 S Connecticut Ave | 0.74mi | 4/1.0 (+1) | 1,750 (+6%) | 7mo | $125,000 | $71 | 45 |
| 319 N Park Ave | 0.52mi | 4/2.0 (+1) | 1,876 (+13%) | 1mo | $199,000 | $106 | 44 |
| 518 E 7th St | 0.66mi | 3/1.5 | 1,552 (-6%) | 16mo | $160,000 | $103 | 44 |
| 705 S Connecticut Ave | 0.72mi | 4/2.5 (+1) | 1,896 (+14%) | 10mo | $159,000 | $84 | 23 |
Match score weights: distance 35% · size 25% · config 20% · recency 20%. Top-matched comps best support the ARV.
Projected returns pro-forma
-3.0% appreciation · 3.0% rent growth · sell at horizon
- IRR
- 24.4%
- Equity multiple
- 2.01×
- Total profit
- $16,364
- Equity at exit
- $8,648
- IRR
- 32.3%
- Equity multiple
- 3.92×
- Total profit
- $47,461
- Equity at exit
- $5,015
Cash invested: $16,240 (down + closing). Projections, not guarantees.
Landlord ↔ Tenant lean methodology
- Overall (STATE)
- 73 Landlord-Friendly
- State Ohio
- 73 Landlord-Friendly · R+6
- County
- — inherits STATE
- City
- — inherits STATE
ZIP-level market 45692
- Home prices YoY
- -1.4%
- Active inventory
- 50
- Price-to-rent
- 4.8×
Monthly cashflow live
- Estimated rent
- $1,016 medium interval (Pro) →
- Mortgage (P&I)
- −$304
- Tax from tax record
- −$70 /mo · $844/yr
- Insurance
- −$24
- HOA
- −$0
- Vacancy / Maint / Mgmt
- −$213
- Net cashflow
- $404
Break-even live
UW: 25.0% down · 7.5% · 30yr · 1.5% tax · 5.0% vac · 8.0% maint · 8.0% mgmt
Financing live
Cash to close
- Down payment
- $14,500
- Closing costs
- $1,740
- Reserves months
- —
- Total cash needed
- —
Loan-product check · same deal, 3 products live
Conventional
25% down · 7.5% · 30yr
- Down + closing
- —
- Monthly P&I
- —
- Monthly cashflow
- —
- DSCR
- —
- Eligible?
- —
Personal DTI + credit; lowest rate.
DSCR
20% down · 8.5% · 30yr
- Down + closing
- —
- Monthly P&I
- —
- Monthly cashflow
- —
- DSCR
- —
- Eligible?
- —
No personal income docs; deal must DSCR.
Hard money
10% down · 12.0% · 12mo
- Down + closing
- —
- Monthly P&I
- —
- Monthly cashflow
- —
- DSCR
- —
- Eligible?
- —
Short-term bridge; refi at stabilization.
Listing history 18 events
-
2026-06-18days on market $58,000 Active 78 DOM
-
2026-06-17days on market $58,000 Active 77 DOM
-
2026-06-16days on market $58,000 Active 76 DOM
-
2026-06-15days on market $58,000 Active 75 DOM
-
2026-06-13days on market $58,000 Active 73 DOM
-
2026-06-12days on market $58,000 Active 72 DOM
-
2026-06-09days on market $58,000 Active 69 DOM
-
2026-06-08days on market $58,000 Active 68 DOM
-
2026-06-08days on market $58,000 Active 67 DOM
-
2026-06-07days on market $58,000 Active 66 DOM
-
2026-06-04days on market $58,000 Active 63 DOM
-
2026-06-02days on market $58,000 Active 62 DOM
-
2026-06-01days on market $58,000 Active 61 DOM
-
2026-05-31days on market $58,000 Active 60 DOM
-
2026-05-13price $58,000
Show marketing remark (219 chars)
Great opportunity for this fixer upper located in town! Spacious home with lots of potential, just needs some TLC. Vinyl siding and metal roof, just waiting for your personal touch. Use your vision the make it your own!
-
2026-05-13price $58,000 219-char remark
Show marketing remark (219 chars)
Great opportunity for this fixer upper located in town! Spacious home with lots of potential, just needs some TLC. Vinyl siding and metal roof, just waiting for your personal touch. Use your vision the make it your own!
-
2026-04-02$62,400 Active
-
2026-04-01$62,400 Active 219-char remark
Show marketing remark (219 chars)
Great opportunity for this fixer upper located in town! Spacious home with lots of potential, just needs some TLC. Vinyl siding and metal roof, just waiting for your personal touch. Use your vision the make it your own!
ⓘ Source: listings_history table (triggers on properties + properties_extension) + one-shot
backfill from property_details.listing_events for pre-trigger history.
Tax reassessment forecast OH · Partial reset (capped growth)
- Current annual tax
- $844 · $70/mo
- Projected year-2 tax
- $875 · $73/mo
- Expected delta
- +$30/yr (+$3/mo · 3.6%)
ⓘ Screening estimate from a state-policy table — verify with the county assessor before closing.
Climate risk First Street
- Flood 1/10 Low FEMA zone X (unshaded) · 0% chance over 30 yrs
- Wildfire 4/10 Moderate
- Heat 4/10 Moderate 7 d/yr ≥100°F today · 19 d/yr by 30 yrs out
- Wind 2/10 Low 100% chance of damaging wind over 30 yrs
- Air quality 2/10 Low 0 unhealthy d/yr today · 1 by 30 yrs out
Nearby sold comps map
Loading sold comps map…
Walkable amenities ~0.75 mi
Loading nearby amenities…
Taxation est. · year 1
- Rental income
- $12,197
- − Mortgage interest
- −$3,249
- − Property taxes
- −$844
- − Insurance
- −$290
- − Repairs & maintenance
- −$976
- − Management
- −$976
- − Depreciation
- −$1,687
- Taxable income
- $4,175
- Est. tax owed @ 24.0%
- −$1,002
- After-tax cash flow
- $3,849/yr
For passive investors: Depreciation is non-cash, so a rental often shows a tax loss while cash-flowing — sheltering income. Rental losses are passive: they offset passive income freely, and up to $25,000/yr can offset ordinary (W-2) income if you actively participate and your MAGI is under $100k (phasing out to $0 by $150k); unused losses carry forward. On sale, claimed depreciation is recaptured at up to 25%, and gains may owe capital-gains tax (a 1031 exchange can defer both). Figures are a year-1 estimate at your 24.0% rate — not tax advice; consult a CPA.
Schools (NCES district)
- District
- Wellston City
- NCES district ID
- 3904502
- Math proficiency
- 38% ▼ -18.00%
- Reading proficiency
- 47% ▼ -10.00%
- Median HH income
- $35,982
- Composite
- 35.2/100
- National rank
- #4991
- State rank
- #532 of 656 in OH
Livability — Wellston
- Score
- 67/100
- State rank
- #606
- US rank
- #10407
Category grades
Schools grade is shown separately in the Schools card above.
Census & demographics
- Census place
- Wellston, OH
- County
- Jackson · 32,540 people
- City population
- 7,699
- Population (ZIP)
- 7,699
- Household income
- $52,449
- Rent vs Own
Population outlook (Jackson County) Hauer SSP2
- Today (2025)
- 30,794 people
- By 2030
- 29,535 · -4.1%
- By 2040
- 26,757 · -13.1%
- By 2050
- 23,897 · -22.4%
- By 2075
- 17,115 · -44.4%
- By 2100
- 10,908 · -64.6%
Race, ethnicity, and origin ACS 2023
- Neighborhood character
- Predominantly White (98%)
- Race & ethnicity
- White 98% Two or more races 1%
- Common ancestry
- Italian 2% Lithuanian 1% Serbian 1%
- Languages at home
- 99% English-only · German/W. Germanic 1%
Political lean MEDSL · Jackson
- 2024 margin
- Solid R (+58.1) · D 20.7% · R 78.8%
- 2008→2024 swing
- -37.9pp toward R · 2008: -20.2pp · 2024: -58.1pp
- All cycles
- 2024: R+58.1 2020: R+54.1 2016: R+48.9 2012: R+20.8 2008: R+20.2
Not yet ingested
- Civics
- —
Market trends
- HPI YoY
- ▼ -3.09%
- Current HPI
- 219.2619
- Rent YoY
- —
- Metro
- —
- State GDP YoY
- ▲ 1.98%
- F500 in state
- 48
Industry mix (Fortune 500 HQ in OH)
| Industry | F500 HQs | Revenue |
|---|---|---|
| Insurance | 3 | $145B |
|
||
| Industrial Machinery | 3 | $49B |
|
||
| Financial Services | 3 | $24B |
|
||
| Consumer Goods | 2 | $93B |
|
||
| Aerospace / Defense | 2 | $47B |
|
||
| Utilities | 2 | $33B |
|
||
Price history
-7.1% since first listed4 events — show timeline
- 2026-05-13 Price Changed $58,000 SVAR
- 2026-05-13 Price Changed $58,000 CBRMLS
- 2026-04-02 Listed $62,400 SVAR
- 2026-04-01 Listed $62,400 CBRMLS
Property tax history
+10.5%/yrLatest (2025): $844 · +89.1% YoY. Source: county tax records.
Cash-flow waterfall
monthlySold comps — $/sqft
last 12 mo · ≤1 miLoading sold comps…