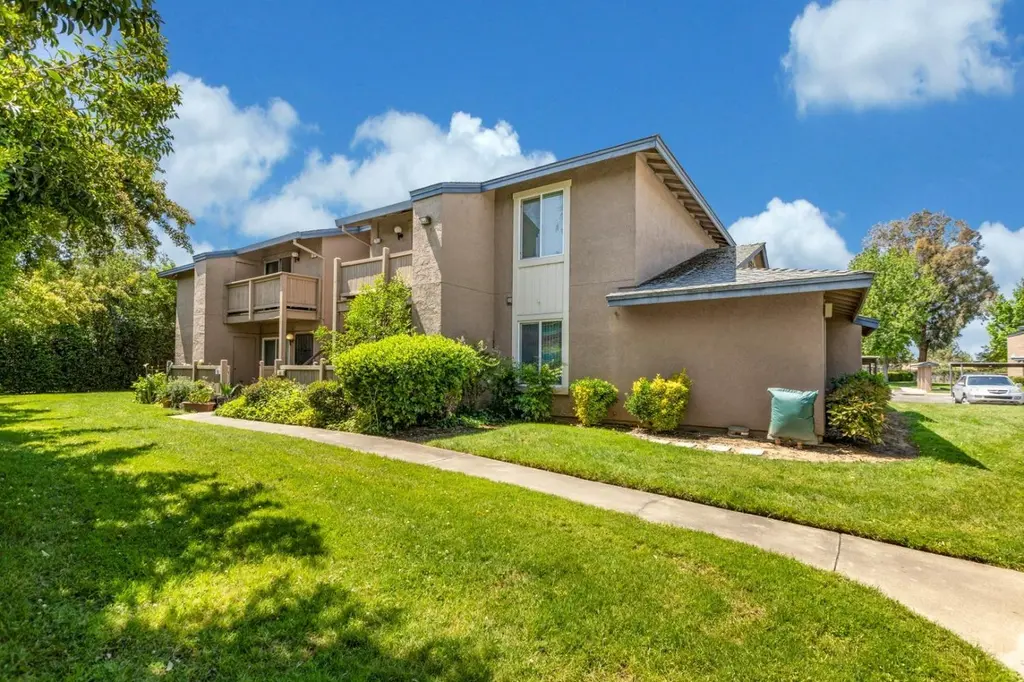
6400 66th Ave #72 · Florin, CA
Flood risk No data
- FEMA flood zone
- —
- Chance of flooding over 30 yrs
- —
- Est. flood insurance / yr
- —
Fire risk No data
- Est. fire insurance / yr
- —
Heat risk No data
- Hot days now (above threshold)
- —
- Hot days in 30 yrs
- —
Wind risk No data
- Chance of severe wind over 30 yrs
- —
Air-quality risk No data
- Unhealthy air days now
- —
- Unhealthy air days in 30 yrs
- —
Risk factors via First Street. Map © Google.
Why this score? — see what drove the D grade
The composite is a weighted blend of 9 inputs, each scored 0–100. Each bar is that input's sub-score; the figure is the points it added to the 100-point composite (weight × sub-score).
- ARV discount +13.1/15.0
- Cash flow +8.5/30.0
- 1% rule +6.6/10.0
- Schools +4.1/10.0
- Livability +2.9/5.0
- Rent growth +2.5/5.0
- Condition / age +2.5/5.0
- DSCR +2.3/10.0
- Appreciation +0.0/10.0
$160,000
🖨 Deal sheet (PDF) 📄 Offer letter ✓ Due diligence
Listing remarks
Welcome to this charming upper-level condominium located in the heart of Sacramento, nestled within a vibrant and growing community. Offering both comfort and convenience, this well-maintained home features spacious living areas filled with natural light, creating an inviting atmosphere perfect for everyday living or relaxing at the end of the day. The thoughtfully updated kitchen showcases modern finishes, ample cabinetry, and functional workspace, making meal preparation both easy and enjoyable. The renovated bathroom adds a fresh, contemporary touch, enhancing the home's overall appeal and move-in readiness. The open living and dining layout provides flexibility for entertaining, working
Key facts
- Renovated bathroom
- Updated kitchen
- $515 HOA
Tags
Neighborhood map
What this means for you Summary
Snapshot
- This is a 2-bed/1.0-bath condo listed at $160k.
Deal economics
- At list price, monthly cash flow is $-140 ($-2k/yr) — negative.
- To cash-flow at today's rent, offer at most $135k (15.4% below list).
- Meets the 1% rule at list price ($2k rent vs $160k).
- Recommended offer: $135k (15.4% below list) — sets the bar for cash-flow.
- Cap rate 5.2% vs local median 3.6% in Florin — top-decile yield for the area; either an underpriced asset or a hidden risk that comps aren't pricing in. Stress-test before assuming the spread holds.
Location & tenants
- Location reads 58/100 on livability (#673 in CA) — a working-class tenant base; expect higher turnover. Strengths: housing A; Watch: employment D, crime F, amenities F.
- Elk Grove Unified (suburban): math 40% / reading 51% proficiency, ranked #165 of 517 in CA (top 32%) — families likely to look elsewhere, expect single-tenant / working-renter base with shorter leases.
- Zoned schools: Samuel Kennedy Elementary (math 14% / reading 17%, grade F, #1,398 of 1,571 statewide, top 89%, 897 students, 72% FRL); James Rutter Middle (math 17% / reading 32%, grade F, #277 of 498 statewide, top 73%, 847 students, 65% FRL); Florin High (math 27% / reading 46%, grade F, #602 of 1,170 statewide, top 52%, 1,676 students, 60% FRL) — zoned schools average 66% FRL vs 43% district-wide (23 pts higher); higher-poverty schools than district average — tighter screening recommended.
- Zoned-school proficiency averages 26% at this address vs 46% district-wide (-20 pts) — the specific schools serving this property underperform the Elk Grove Unified average; the district grade overstates school quality for this exact location.
- Market conditions: Rents flat; 186 active listings in the ZIP; 31 comparable units currently listed for rent nearby; rentals at typical pace (median 22d on market — plan ~3-4 weeks tenant-placement turnaround); 6,825 units permitted in Sacramento County in 2024 (1,752 in 5+ unit buildings).
- This rent runs 33% of the median local income ($67k/yr) — at the standard rent-burdened threshold; future hikes will face affordability resistance.
Forward outlook
- Local home prices are declining (-3.0%/yr); year-one equity from $1k of loan paydown is wiped out by about $5k of value loss. Plan a longer hold.
- Sacramento County population projected at +17% by 2050 — long-run rental-demand tailwind backs the buy-and-hold thesis.
Negotiation context
- It's been on market 122 days — a 12% lower offer ($141k) is reasonable based on typical stale-listing flexibility.
Risks & watch-outs
- Watch-outs: HOA is 28% of rent.
Questions for the listing agent
- What do current leases actually rent for vs. the listed asking? Can we see a recent rent roll and the last 12 months of T-12 income?
- It's been on market 122 days. Have you received any prior offers? Is the seller open to a 15% concession, seller financing, or rate buy-down credit?
- What does the HOA fee cover, when was the last increase, and are there any pending special assessments or reserve-fund shortfalls?
- Any open or pending special assessments — roof, HVAC, plumbing, elevator, façade? What's the per-unit balance and payoff schedule, and is the seller paying it off at close or rolling it to the buyer?
- Why hasn't it sold? Are there any deal-killer items the seller is aware of (foundation, flood, title, zoning, code violations)?
- Is there a deadline driving the sale (1031 exchange, divorce, estate, relocation)? That informs how much negotiation room exists.
- Schools are D-rated, which usually means shorter tenancies and higher turnover. Who's the typical renter profile here, and what's been the actual vacancy rate?
- Crime grade is F in this area — have there been break-ins, vandalism, or insurance claims at this property in the last 3 years? What carrier currently insures it and at what premium?
- The area grade is low — what's the realistic commute time and amenity access for the typical tenant pool here? Any planned neighborhood developments (good or bad) we should know about?
- What's the average days-on-market for RENTAL listings here right now (not sales)? A rising rental-DOM trend means longer vacancies and softer asking-rent achievability than the comps imply.
- What's the recent tenant-quality profile in this submarket — average credit score on applications, eviction rate, late-payment / NSF rate, and stable-employment percentage? A property-management company in the area should have these aggregated.
- How much new apartment / multifamily construction is in the pipeline within 1–3 miles? Heavy new supply (>2% of stock underway) typically softens rents 12–24 months out; light construction supports rent growth.
Investment metrics
- 1% rule
- 1.16% ✓
- Cap rate
- 5.25%
- Cash-on-cash
- -3.74%
- DSCR
- 0.83
- GRM
- 7.2
CMA / ARV
- ARV (median comp)
- $182,624
- List price
- $160,000
- Delta
- -12.39%
- Verdict
- UNDERPRICED
- Comps
- 20 within 1.0 mi
Projected returns pro-forma
-3.0% appreciation · 0.02% rent growth · sell at horizon
- IRR
- -27.5%
- Equity multiple
- 0.11×
- Total profit
- $-39,889
- Equity at exit
- $23,857
- IRR
- -55.1%
- Equity multiple
- -0.47×
- Total profit
- $-65,721
- Equity at exit
- $13,834
Cash invested: $44,800 (down + closing). Projections, not guarantees.
Landlord ↔ Tenant lean methodology
- Overall (STATE)
- 18 Strongly Tenant-Friendly
- State California
- 18 Strongly Tenant-Friendly · D+13
- County
- — inherits STATE
- City
- — inherits STATE
ZIP-level market 95823
- Rents YoY
- 0.0%
- Active inventory
- 186
- Price-to-rent
- 7.2×
Monthly cashflow live
- Estimated rent
- $1,857 high interval (Pro) →
- Mortgage (P&I)
- −$839
- Tax from tax record
- −$186 /mo · $2,228/yr
- Insurance
- −$67
- HOA
- −$515
- Vacancy / Maint / Mgmt
- −$390
- Net cashflow
- $-140
Break-even live
Sensitivity live
| Price | -10% $-49 | -5% $-94 | +0% $-140 | +5% $-185 | +10% $-230 |
|---|---|---|---|---|---|
| Rent | -10% $-286 | -5% $-213 | +0% $-140 | +5% $-66 | +10% $7 |
| Rate | -1.0pp $-59 | -0.5pp $-99 | base $-140 | +0.5pp $-181 | +1.0pp $-223 |
UW: 25.0% down · 7.5% · 30yr · 1.5% tax · 5.0% vac · 8.0% maint · 8.0% mgmt
Financing live
Cash to close
- Down payment
- $40,000
- Closing costs
- $4,800
- Reserves months
- —
- Total cash needed
- —
Loan-product check · same deal, 3 products live
Conventional
25% down · 7.5% · 30yr
- Down + closing
- —
- Monthly P&I
- —
- Monthly cashflow
- —
- DSCR
- —
- Eligible?
- —
Personal DTI + credit; lowest rate.
DSCR
20% down · 8.5% · 30yr
- Down + closing
- —
- Monthly P&I
- —
- Monthly cashflow
- —
- DSCR
- —
- Eligible?
- —
No personal income docs; deal must DSCR.
Hard money
10% down · 12.0% · 12mo
- Down + closing
- —
- Monthly P&I
- —
- Monthly cashflow
- —
- DSCR
- —
- Eligible?
- —
Short-term bridge; refi at stabilization.
Rent comps 31 comps
| Address | Beds | Baths | Sqft | Rent | $/sqft | DOM | Units | Dist |
|---|---|---|---|---|---|---|---|---|
| 7283 Florin Mall Dr #14 Sacramento, CA | 2.0 | 2.0 | 902 | $1,675 | $1.86 | 45d | 1 | 0.26mi |
| 7252 Florin Mall Dr Unit 7252 Sacramento, CA | 2.0 | 2.0 | 900 | $1,725 | $1.92 | 45d | 1 | 0.34mi |
| 6901 Florin Rd Sacramento, CA | 2.0 | 1.0 | 752 | $1,648 | $2.19 | 9d | 4 | 0.46mi |
| 7474 La Mancha Way Sacramento, CA | 1.0–2.0 | 1.0 | 777 | $1,695 | $2.18 | 0d | 3 | 0.59mi |
| 5545 Sky Pkwy Sacramento, CA | 1.0–2.0 | 1.0 | 716 | $1,630 | $2.28 | 19d | 7 | 0.84mi |
| 7614 Par Pkwy Sacramento, CA | 2.0 | 1.0 | 850 | $1,750 | $2.06 | 45d | 1 | 1.03mi |
| 7351 Gigi Pl Unit 7353 Sacramento, CA | 2.0 | 1.0 | 1000 | $1,775 | $1.77 | 25d | 1 | 1.04mi |
| 6465 Village Center Dr Sacramento, CA | 1.0–2.0 | 1.0 | 629 | $1,670 | $2.65 | 4d | 9 | 1.07mi |
| 7337 Power Inn Rd Sacramento, CA | 2.0 | 1.0 | 663 | $1,775 | $2.68 | 25d | 3 | 1.13mi |
| 6475 Stockton Blvd Sacramento, CA | 2.0 | 2.0 | 988 | $2,600 | $2.63 | 21d | 1 | 1.16mi |
| 7238 East Pkwy Apt B5 Sacramento, CA | 2.0 | 1.5 | 1020 | $1,645 | $1.61 | 9d | 1 | 1.17mi |
| 6470 Stockton Blvd Sacramento, CA | 1.0–2.0 | 1.0–2.0 | 856 | $1,845 | $2.16 | 45d | 2 | 1.18mi |
| 7639 Clover Woods Ct Sacramento, CA | 2.0 | 1.0 | 1032 | $1,895 | $1.84 | 45d | 1 | 1.18mi |
| 6519 Prentiss Dr Sacramento, CA | 3.0 | 2.0 | 1029 | $2,300 | $2.24 | 14d | 1 | 1.26mi |
| 5500 Mack Rd Sacramento, CA | 2.0 | 1.0–2.0 | 856 | $1,603 | $1.87 | 9d | 1 | 1.32mi |
| 7575 Power Inn Rd Sacramento, CA | 1.0–2.0 | 1.0–2.0 | 729 | $1,950 | $2.67 | 3d | 5 | 1.33mi |
| 5152 Mack Rd Sacramento, CA | 2.0 | 2.0 | 801 | $1,731 | $2.16 | 19d | 1 | 1.39mi |
| 5152 Mack Rd Sacramento, CA | 1.0 | 1.0 | 597 | $1,525 | $2.55 | 25d | 1 | 1.39mi |
| 5152 Mack Rd Sacramento, CA | 2.0 | 2.0 | 801 | $1,784 | $2.23 | 0d | 1 | 1.39mi |
| 5152 Mack Rd Sacramento, CA | 2.0 | 2.0 | 801 | $1,891 | $2.36 | 22d | 1 | 1.39mi |
| 5152 Mack Rd Sacramento, CA | 1.0 | 1.0 | 597 | $1,603 | $2.69 | 6d | 1 | 1.39mi |
| 7826 Center Pkwy Sacramento, CA | 1.0–2.0 | 1.0–2.0 | 737 | $1,795 | $2.43 | 45d | 1 | 1.39mi |
| 6633 Valley Hi Dr Sacramento, CA | 2.0 | 2.0 | 809 | $1,889 | $2.33 | 6d | 1 | 1.40mi |
| 6611 50th St Sacramento, CA | 2.0 | 1.0 | 873 | $1,950 | $2.23 | 9d | 1 | 1.42mi |
| 7051 Bowling Dr Sacramento, CA | 1.0–2.0 | 1.0–1.5 | 716 | $1,445 | $2.02 | 4d | 5 | 1.43mi |
| 4407 Bouts Pkwy Sacramento, CA | 3.0 | 1.0 | 1024 | $1,950 | $1.90 | 45d | 1 | 1.43mi |
| 7733 Robinette Rd Sacramento, CA | 3.0 | 2.0 | 1120 | $2,150 | $1.92 | 45d | 1 | 1.44mi |
| 7605 Franklin Blvd Sacramento, CA | 2.0 | 1.0 | 824 | $1,645 | $2.00 | 4d | 1 | 1.44mi |
| 4400 Shining Star Dr Sacramento, CA | 1.0–4.0 | 1.0–2.0 | 1225 | $2,254 | $1.84 | 45d | 1 | 1.47mi |
| 7408 Franklin Blvd #2 Sacramento, CA | 2.0 | 1.0 | 840 | $1,300 | $1.55 | 23d | 1 | 1.48mi |
| 4911 50th Ave Unit 11 Sacramento, CA | 2.0 | 2.0 | 875 | $1,660 | $1.90 | 25d | 1 | 1.48mi |
HOA detail condo
- Monthly dues
- $515 · $6,180/yr
- Assessments
- None detected in remarks — confirm with the listing agent.
Listing history 24 events
-
2026-06-21days on market $160,000 Active 122 DOM
-
2026-06-18days on market $160,000 Active 119 DOM
-
2026-06-17days on market $160,000 Active 118 DOM
-
2026-06-16days on market $160,000 Active 117 DOM
-
2026-06-15days on market $160,000 Active 116 DOM
-
2026-06-13days on market $160,000 Active 114 DOM
-
2026-06-13days on market $160,000 Active 113 DOM
-
2026-06-09days on market $160,000 Active 110 DOM
-
2026-06-08days on market $160,000 Active 109 DOM
-
2026-06-07days on market $160,000 Active 108 DOM
-
2026-06-05days on market $160,000 Active 105 DOM
-
2026-06-03days on market $160,000 Active 104 DOM
-
2026-06-02days on market $160,000 Active 103 DOM
-
2026-06-02price $160,000 Active 102 DOM
-
2026-06-01days on market $200,000 Active 102 DOM
-
2026-05-31days on market $200,000 Active 101 DOM
-
2024-10-02soldstatus $210,000
-
2019-06-20soldstatus $125,000
-
2016-07-21soldstatus $70,000
-
2014-01-10soldstatus $42,000
-
1995-03-21soldstatus $32,000
-
1994-03-17soldstatus $42,753
-
1988-01-07soldstatus $40,000
-
1984-11-30soldstatus $50,000
ⓘ Source: listings_history table (triggers on properties + properties_extension) + one-shot
backfill from property_details.listing_events for pre-trigger history.
Tax reassessment forecast CA · Resets to sale price
- Current annual tax
- $2,228 · $186/mo
- Projected year-2 tax
- $2,228 · $186/mo
- Expected delta
- $0/yr ($0/mo · 0.0%)
ⓘ Screening estimate from a state-policy table — verify with the county assessor before closing.
Nearby sold comps map
Loading sold comps map…
Walkable amenities ~0.75 mi
Loading nearby amenities…
Taxation est. · year 1
- Rental income
- $22,281
- − Mortgage interest
- −$8,962
- − Property taxes
- −$2,228
- − Insurance
- −$800
- − Repairs & maintenance
- −$1,782
- − Management
- −$1,782
- − HOA
- −$6,180
- − Depreciation
- −$4,655
- Taxable loss
- −$4,110
- Est. tax savings @ 24.0%
- +$986
- After-tax cash flow
- $-689/yr
For passive investors: Depreciation is non-cash, so a rental often shows a tax loss while cash-flowing — sheltering income. Rental losses are passive: they offset passive income freely, and up to $25,000/yr can offset ordinary (W-2) income if you actively participate and your MAGI is under $100k (phasing out to $0 by $150k); unused losses carry forward. On sale, claimed depreciation is recaptured at up to 25%, and gains may owe capital-gains tax (a 1031 exchange can defer both). Figures are a year-1 estimate at your 24.0% rate — not tax advice; consult a CPA.
Schools (NCES district)
- District
- Elk Grove Unified
- NCES district ID
- 0612330
- Math proficiency
- 40% ▼ -5.00%
- Reading proficiency
- 51% ▼ -5.00%
- Median HH income
- $67,860
- Composite
- 40.72/100
- National rank
- #3658
- State rank
- #165 of 517 in CA
Livability — Florin
- Score
- 58/100
- State rank
- #673
- US rank
- #20705
Category grades
Schools grade is shown separately in the Schools card above.
Census & demographics
- Census place
- Florin, CA
- County
- Sacramento County · 1,539,646 people
- City population
- 60,532
- Metro
- Sacramento-Roseville-Folsom, CA
- Population (ZIP)
- 83,607
- Household income
- $66,895
- Rent vs Own
- Severe rent burden
- 4034.0
Population outlook (Sacramento County) Hauer SSP2
- Today (2025)
- 1,660,763 people
- By 2030
- 1,732,990 · +4.3%
- By 2040
- 1,855,755 · +11.7%
- By 2050
- 1,941,335 · +16.9%
- By 2075
- 2,046,162 · +23.2%
- By 2100
- 1,961,444 · +18.1%
Race, ethnicity, and origin ACS 2023
- Neighborhood character
- Highly diverse neighborhood (Simpson 0.77)
- Race & ethnicity
- Hispanic / Latino 35% Asian 25% Black 17% Two or more races 16% White 11% Pacific Islander 4% Native American 1%
- Hispanic origin (detail)
- Mexican 29% Puerto Rican 1%
- Common ancestry
- Lithuanian 1% Italian 1% Scotch-Irish 1%
- Foreign-born
- 30% · Canada, Vietnam, China
- Languages at home
- 47% English-only · Spanish 25% Other Asian/Pacific 9% Other Indo-European 8%
Political lean MEDSL · Sacramento
- 2024 margin
- D (+19.7) · D 58.1% · R 38.4% · Other 3.5%
- 2008→2024 swing
- +0.7pp no change · 2008: 19.0pp · 2024: 19.7pp
- All cycles
- 2024: D+19.7 2020: D+25.3 2016: D+23.7 2012: D+16.3 2008: D+19.0
Not yet ingested
- Civics
- —
Market trends
- HPI YoY
- ▼ -331.02%
- Current HPI
- 377.4278
- Rent YoY
- ▬ 0.02%
- Metro
- Sacramento-Roseville-Folsom, CA
- State GDP YoY
- ▲ 3.21%
- F500 in state
- 116
Industry mix (Fortune 500 HQ in CA)
| Industry | F500 HQs | Revenue |
|---|---|---|
| Technology | 27 | $1,492B |
|
||
| Financial Services | 3 | $174B |
|
||
| Retail | 3 | $44B |
|
||
| Insurance | 3 | $26B |
|
||
| Media / Entertainment | 2 | $115B |
|
||
| Pharmaceuticals / Biotech | 2 | $62B |
|
||
Price history
+320.0% since first listed8 events — show timeline
- 2024-10-02 Sold (Public Records) $210,000 Public Records
- 2019-06-20 Sold (Public Records) $125,000 Public Records
- 2016-07-21 Sold (Public Records) $70,000 Public Records
- 2014-01-10 Sold (Public Records) $42,000 Public Records
- 1995-03-21 Sold (Public Records) $32,000 Public Records
- 1994-03-17 Sold (Public Records) $42,753 Public Records
- 1988-01-07 Sold (Public Records) $40,000 Public Records
- 1984-11-30 Sold (Public Records) $50,000 Public Records
Property tax history
+9.3%/yrLatest (2025): $2,228 · +27.2% YoY. Source: county tax records.
Cash-flow waterfall
monthlySold comps — $/sqft
last 12 mo · ≤1 miLoading sold comps…