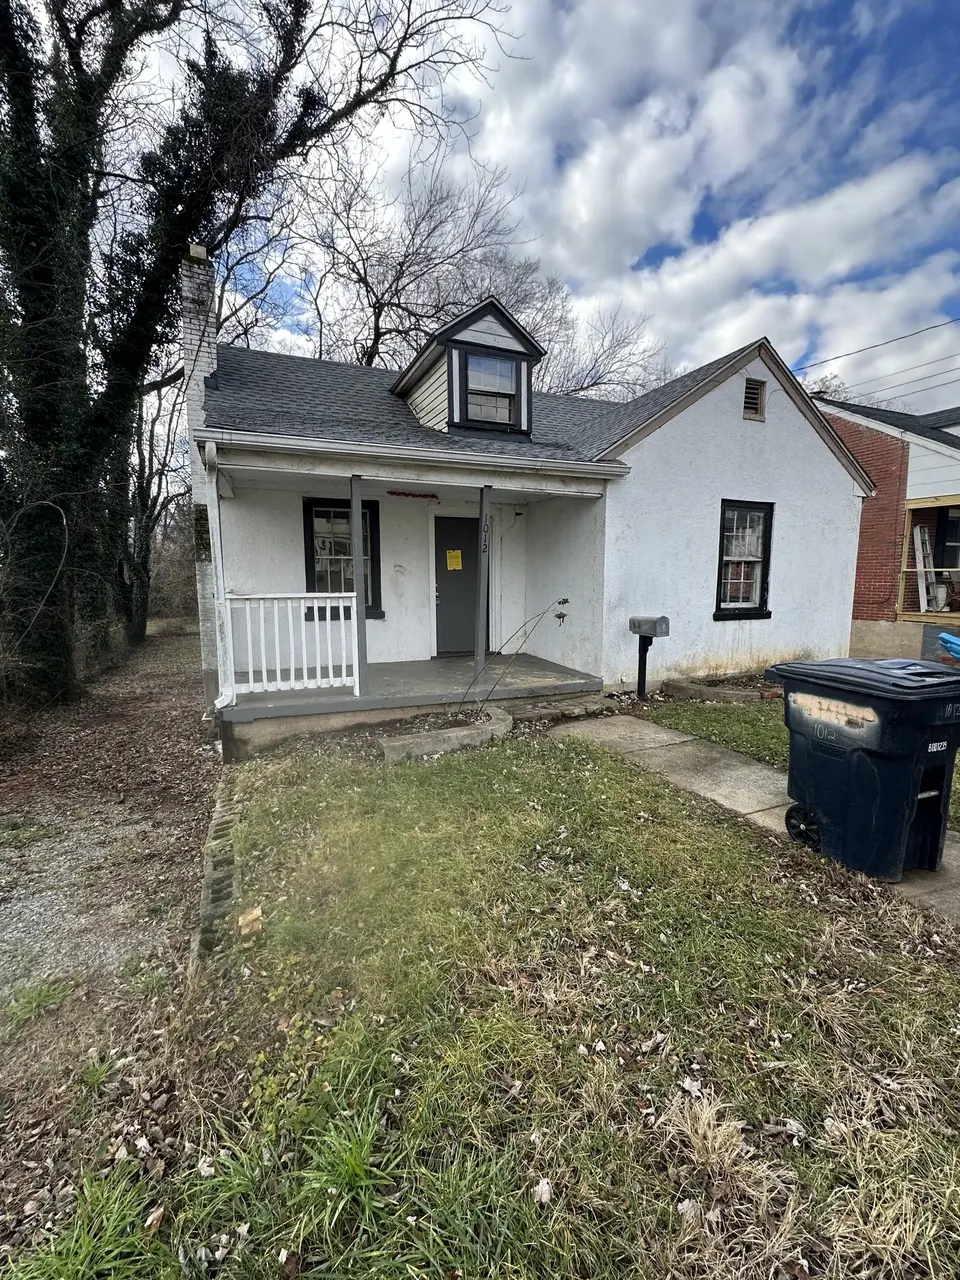
1012 Hunt Ave NW · Roanoke, VA
Flood risk 1/10 · Minimal
- FEMA flood zone
- X (unshaded)
- Chance of flooding over 30 yrs
- 0.0%
- Est. flood insurance / yr
- $473 – $860
Fire risk 1/10 · Minimal
- Est. fire insurance / yr
- $666 – $1,236
Heat risk 5/10 · Moderate
- Hot days now (above 101°F)
- 7 days/yr
- Hot days in 30 yrs
- 17 days/yr
Wind risk 2/10 · Minimal
- Chance of severe wind over 30 yrs
- 1.0%
Air-quality risk 1/10 · Minimal
- Unhealthy air days now
- 0 days/yr
- Unhealthy air days in 30 yrs
- 0 days/yr
Risk factors via First Street. Map © Google.
Why this score? — see what drove the D+ grade
The composite is a weighted blend of 9 inputs, each scored 0–100. Each bar is that input's sub-score; the figure is the points it added to the 100-point composite (weight × sub-score).
- Cash flow +22.1/30.0
- DSCR +7.1/10.0
- Rent growth +5.0/5.0
- 1% rule +4.9/10.0
- Schools +4.1/10.0
- Livability +3.7/5.0
- Condition / age +2.5/5.0
- ARV discount +0.0/15.0
- Appreciation +0.0/10.0
$145,906
🖨 Deal sheet 📄 Offer letter ✓ Due diligence
Listing remarks MLS
Cute Cape Cod with great location now that the 10th St Extension is complete. Covered rocking chair front porch.
Key facts
- Great location
- 5,662 sq ft lot
- Built 1947
Tags
Neighborhood map
What this means for you Summary
Snapshot
- This is a 3-bed/1.0-bath single-family listed at $146k.
Deal economics
- At list price, monthly cash flow is $235 ($3k/yr) — positive.
- The deal already cash-flows at list — no discount required.
- To meet the 1% rule (rent ≥ 1% of price), the offer needs to be $145k (0.8% below list).
- Recommended offer: $128k (12.0% below list) — sets the bar for market timing.
- Cap rate 8.2% vs local median 4.2% in Roanoke — top-decile yield for the area; either an underpriced asset or a hidden risk that comps aren't pricing in. Stress-test before assuming the spread holds.
Location & tenants
- Location reads 73/100 on livability (#163 in VA) — a middle-class / working-renter tenant base. Strengths: cost of living A+, health & safety A+, housing A; Watch: amenities C-, employment D, crime F.
- Roanoke City Public School District (urban): math 40% / reading 58% proficiency, ranked #102 of 131 in VA (top 78%) — families likely to look elsewhere, expect single-tenant / working-renter base with shorter leases; 67% free/reduced lunch — lower-income household profile, screen leases tightly.
- Market conditions: Rents rising fast (+10.5%/yr); 194 active listings in the ZIP; 29 comparable units currently listed for rent nearby; rentals at typical pace (median 21d on market — plan ~3-4 weeks tenant-placement turnaround); 45% of comp listings sitting > 30 days — soft ceiling on asking rent; 113 units permitted in Roanoke city in 2024 (0 in 5+ unit buildings).
- This rent runs 33% of the median local income ($53k/yr) — at the standard rent-burdened threshold; future hikes will face affordability resistance.
Forward outlook
- Local home prices are declining (-3.0%/yr); year-one equity from $1k of loan paydown is wiped out by about $4k of value loss. Plan a longer hold.
- Roanoke County population projected at +11% by 2050 — modest demand growth; plan on rents tracking national, not racing it.
- At projected returns (-3.0% appreciation + 8.0% rent growth), your $41k cash investment doubles in ~9 years — after that, you're playing with house money.
Negotiation context
- It's been on market 531 days — a 12% lower offer ($128k) is reasonable based on typical stale-listing flexibility.
- 3 sale attempts since 11y ago; this cycle's ask has dropped $33k (18%) from the opening price — seller is motivated, your offer sets the floor, not the list.
Risks & watch-outs
- Watch-outs: built in 1947 — expect roof / HVAC / electrical / plumbing capex.
- Climate carrying-cost: extreme-heat days projected 7→17/yr by 2055 (HVAC capex compounding) — expect insurance premiums to compound above CPI over the hold.
Questions for the listing agent
- It's been on market 531 days. Have you received any prior offers? Is the seller open to a 12% concession, seller financing, or rate buy-down credit?
- Built in 1947 — when were the roof, HVAC, electrical panel, plumbing, and water heater last replaced?
- Why hasn't it sold? Are there any deal-killer items the seller is aware of (foundation, flood, title, zoning, code violations)?
- Is there a deadline driving the sale (1031 exchange, divorce, estate, relocation)? That informs how much negotiation room exists.
- Schools are A-rated — typically a magnet for longer-tenancy family renters. What's the average tenant stay here, and is there a school-zone premium baked into asking?
- Crime grade is F in this area — have there been break-ins, vandalism, or insurance claims at this property in the last 3 years? What carrier currently insures it and at what premium?
- The area grade is low — what's the realistic commute time and amenity access for the typical tenant pool here? Any planned neighborhood developments (good or bad) we should know about?
- What's the average days-on-market for RENTAL listings here right now (not sales)? A rising rental-DOM trend means longer vacancies and softer asking-rent achievability than the comps imply.
- What's the recent tenant-quality profile in this submarket — average credit score on applications, eviction rate, late-payment / NSF rate, and stable-employment percentage? A property-management company in the area should have these aggregated.
- How much new for-sale + rental construction is in the pipeline within 1–3 miles? Heavy new supply typically softens prices + rents 12–24 months out; constrained supply supports both.
Investment metrics
- 1% rule
- 0.99% ✗
- Cap rate
- 8.23%
- Cash-on-cash
- 6.91%
- DSCR
- 1.31
- GRM
- 8.4
CMA / ARV
- ARV (median comp)
- $120,165
- List price
- $145,906
- Delta
- 21.42%
- Verdict
- OVERPRICED
- Comps
- 20 within 1.0 mi
Show comp detail 12 sales within ~0.75 mi
| Address | Dist | Beds/Ba | Sqft | Sold | Price | $/sf | Match |
|---|---|---|---|---|---|---|---|
| 1638 Norris Dr NW | 0.64mi | 3/1.0 | 1,000 (-2%) | 1mo | $200,000 | $200 | 66 |
| 2622 Bowman St NW | 0.60mi | 2/1.0 (-1) | 970 (-5%) | 0mo | $212,000 | $219 | 59 |
| 1228 Thomas Ave NW | 0.44mi | 3/3.0 | 1,078 (+6%) | 9mo | $259,950 | $241 | 55 |
| 706 Queen Ave NW | 0.43mi | 2/1.0 (-1) | 1,067 (+5%) | 16mo | $163,000 | $153 | 54 |
| 3226 Hillcrest Ave NW | 0.47mi | 4/1.0 (+1) | 1,045 (+3%) | 19mo | $174,900 | $167 | 53 |
| 2603 Chatham St NW | 0.54mi | 3/1.0 | 1,123 (+10%) | 8mo | $197,000 | $175 | 51 |
| 3124 Round Hill Ave NW | 0.60mi | 2/1.0 (-1) | 936 (-8%) | 5mo | $165,000 | $176 | 49 |
| 2724 Forest Hill Ave NE | 0.51mi | 3/1.0 | 916 (-10%) | 14mo | $190,000 | $207 | 48 |
| 1210 Mercer Ave NW | 0.56mi | 2/1.0 (-1) | 944 (-7%) | 12mo | $125,000 | $132 | 46 |
| 3144 Roundhill Ave NW | 0.60mi | 3/1.5 | 1,144 (+12%) | 7mo | $225,000 | $197 | 44 |
| 2705 Forest Hill Ave NW | 0.55mi | 2/1.0 (-1) | 866 (-15%) | 1mo | $189,300 | $219 | 43 |
| 1530 12th St NW | 0.33mi | 4/2.0 (+1) | 1,152 (+13%) | 21mo | $189,950 | $165 | 36 |
Match score weights: distance 35% · size 25% · config 20% · recency 20%. Top-matched comps best support the ARV.
Projected returns pro-forma
-3.0% appreciation · 8.0% rent growth · sell at horizon
- IRR
- -0.6%
- Equity multiple
- 0.97×
- Total profit
- $-1,049
- Equity at exit
- $21,755
- IRR
- 13.4%
- Equity multiple
- 2.30×
- Total profit
- $53,044
- Equity at exit
- $12,615
Cash invested: $40,854 (down + closing). Projections, not guarantees.
Landlord ↔ Tenant lean methodology
- Overall (STATE)
- 55 Moderately Landlord-Leaning
- State Virginia
- 55 Moderately Landlord-Leaning · D+2
- County
- — inherits STATE
- City
- — inherits STATE
ZIP-level market 24012
- Rents YoY
- 10.5%
- Active inventory
- 194
- Price-to-rent
- 8.4×
Monthly cashflow live
- Estimated rent
- $1,448 high interval (Pro) →
- Mortgage (P&I)
- −$765
- Tax from tax record
- −$83 /mo · $992/yr
- Insurance
- −$61
- HOA
- −$0
- Vacancy / Maint / Mgmt
- −$304
- Net cashflow
- $235
Break-even live
UW: 25.0% down · 7.5% · 30yr · 1.5% tax · 5.0% vac · 8.0% maint · 8.0% mgmt
Financing live
Cash to close
- Down payment
- $36,476
- Closing costs
- $4,377
- Reserves months
- —
- Total cash needed
- —
Loan-product check · same deal, 3 products live
Conventional
25% down · 7.5% · 30yr
- Down + closing
- —
- Monthly P&I
- —
- Monthly cashflow
- —
- DSCR
- —
- Eligible?
- —
Personal DTI + credit; lowest rate.
DSCR
20% down · 8.5% · 30yr
- Down + closing
- —
- Monthly P&I
- —
- Monthly cashflow
- —
- DSCR
- —
- Eligible?
- —
No personal income docs; deal must DSCR.
Hard money
10% down · 12.0% · 12mo
- Down + closing
- —
- Monthly P&I
- —
- Monthly cashflow
- —
- DSCR
- —
- Eligible?
- —
Short-term bridge; refi at stabilization.
Rent comps 29 comps
| Address | Beds | Baths | Sqft | Rent | $/sqft | DOM | Units | Dist |
|---|---|---|---|---|---|---|---|---|
| 2916 Courtland Rd NW Roanoke, VA | 2.0 | 1.0 | 722 | $1,123 | $1.56 | 21d | 1 | 0.37mi |
| 1115 Grayson Ave NW Roanoke, VA | 4.0 | 2.0 | 1094 | $2,300 | $2.10 | 43d | 1 | 0.40mi |
| 1117 Rugby Blvd NW Unit B Roanoke, VA | 2.0 | 1.0 | 1048 | $778 | $0.74 | 21d | 1 | 0.47mi |
| 1531 Syracuse Ave NW Roanoke, VA | 3.0 | 1.0 | 1488 | $1,675 | $1.13 | 43d | 1 | 0.58mi |
| 1533 Rugby Blvd NW Roanoke, VA | 3.0 | 1.0 | 1500 | $1,475 | $0.98 | 43d | 1 | 0.62mi |
| 717 Orange Ave NW Roanoke, VA | 2.0 | 1.0 | 738 | $900 | $1.22 | 43d | 1 | 0.64mi |
| 44 Forest Hill Ave NE Roanoke, VA | 2.0 | 1.0 | 768 | $1,150 | $1.50 | 21d | 1 | 0.70mi |
| 106 Lee Ave NE Apt 10 Roanoke, VA | 2.0 | 1.5 | 820 | $1,160 | $1.41 | 43d | 1 | 0.76mi |
| 106 Lee Ave NE Apt 10 Roanoke, VA | 2.0 | 1.5 | 902 | $1,125 | $1.25 | 13d | 1 | 0.76mi |
| 2716 Edison St NE Unit & 2718 Roanoke, VA | 2.0 | 1.5 | 864 | $1,225 | $1.42 | 43d | 1 | 0.79mi |
| 1515 Dunbar St NW Roanoke, VA | 3.0 | 2.0 | 1058 | $1,623 | $1.53 | 13d | 1 | 0.81mi |
| 1116 Fairfax Ave NW Roanoke, VA | 2.0 | 1.0 | 800 | $1,400 | $1.75 | 21d | 1 | 0.94mi |
| 401 Rutherford Ave NW Roanoke, VA | 3.0 | 1.0 | 1064 | $1,450 | $1.36 | 43d | 1 | 0.95mi |
| 1007 Gilmer Ave NW Roanoke, VA | 2.0 | 2.0 | 1187 | $1,175 | $0.99 | 21d | 1 | 0.98mi |
| 333 Harrison Ave NW Roanoke, VA | 3.0 | 2.0 | 1186 | $1,123 | $0.95 | 21d | 1 | 1.00mi |
| 813 Gilmer Ave NW Roanoke, VA | 2.0 | 1.0 | 1050 | $1,322 | $1.26 | 21d | 1 | 1.00mi |
| 2109 Colgate St NE Roanoke, VA | 3.0 | 1.0 | 1240 | $1,700 | $1.37 | 13d | 1 | 1.01mi |
| 3111 Ellsworth St NE Roanoke, VA | 1.0–2.0 | 1.0 | 662 | $1,199 | $1.81 | 13d | 2 | 1.02mi |
| 1712 Wayne St NE Roanoke, VA | 2.0 | 1.0 | 826 | $1,250 | $1.51 | 21d | 1 | 1.02mi |
| 3323 Collingwood St NE Roanoke, VA | 3.0 | 2.0 | 1200 | $2,150 | $1.79 | 43d | 1 | 1.12mi |
| 216 Patton Ave NW Unit 2 Roanoke, VA | 2.0 | 1.0 | 1240 | $1,025 | $0.83 | 21d | 1 | 1.13mi |
| 3228 Oliver Rd NE Roanoke, VA | 3.0 | 1.0 | 1017 | $1,150 | $1.13 | 21d | 1 | 1.14mi |
| 1920 Melrose Ave NW Roanoke, VA | 2.0 | 1.0 | 768 | $950 | $1.24 | 43d | 1 | 1.18mi |
| 2608 Florida Ave NW Roanoke, VA | 3.0 | 1.0 | 1394 | $1,600 | $1.15 | 21d | 1 | 1.34mi |
| 10 12 1/2 St SW Roanoke, VA | 3.0 | 1.5 | 999 | $1,023 | $1.02 | 43d | 1 | 1.35mi |
| 701 Salem Ave SW Roanoke, VA | 2.0 | 1.0 | 1250 | $1,950 | $1.56 | 43d | 1 | 1.40mi |
| 2731 Cove Rd NW Roanoke, VA | 3.0 | 2.5 | 1427 | $1,523 | $1.07 | 43d | 1 | 1.41mi |
| 802 Rorer Ave SW Apt A Roanoke, VA | 2.0 | 1.0 | 820 | $895 | $1.09 | 43d | 1 | 1.47mi |
| 1716 Empress Dr NW Roanoke, VA | 1.0–2.0 | 1.0 | 671 | $1,040 | $1.55 | 13d | 1 | 1.49mi |
Listing history 33 events
-
2026-06-18days on market $145,906 Active 531 DOM
-
2026-06-17days on market $145,906 Active 530 DOM
-
2026-06-16days on market $145,906 Active 529 DOM
-
2026-06-15days on market $145,906 Active 528 DOM
-
2026-06-14days on market $145,906 Active 526 DOM
-
2026-06-13days on market $145,906 Active 525 DOM
-
2026-06-10days on market $145,906 Active 523 DOM
-
2026-06-09days on market $145,906 Active 522 DOM
-
2026-06-08days on market $145,906 Active 521 DOM
-
2026-06-05days on market $145,906 Active 517 DOM
-
2026-06-03days on market $145,906 Active 516 DOM
-
2026-06-02days on market $145,906 Active 515 DOM
-
2026-06-01days on market $145,906 Active 514 DOM
-
2026-05-31days on market $145,906 Active 513 DOM
-
2026-05-30days on market $145,906 Active 512 DOM
-
2026-02-05price $145,906 112-char remark
Show marketing remark (112 chars)
Cute Cape Cod with great location now that the 10th St Extension is complete. Covered rocking chair front porch.
-
2026-01-05price $148,884 112-char remark
Show marketing remark (112 chars)
Cute Cape Cod with great location now that the 10th St Extension is complete. Covered rocking chair front porch.
-
2025-11-12price $151,922 112-char remark
Show marketing remark (112 chars)
Cute Cape Cod with great location now that the 10th St Extension is complete. Covered rocking chair front porch.
-
2025-10-08price $155,022 112-char remark
Show marketing remark (112 chars)
Cute Cape Cod with great location now that the 10th St Extension is complete. Covered rocking chair front porch.
-
2025-09-03price $158,186 112-char remark
Show marketing remark (112 chars)
Cute Cape Cod with great location now that the 10th St Extension is complete. Covered rocking chair front porch.
-
2025-08-08price $161,414 112-char remark
Show marketing remark (112 chars)
Cute Cape Cod with great location now that the 10th St Extension is complete. Covered rocking chair front porch.
-
2025-06-26price $164,709 112-char remark
Show marketing remark (112 chars)
Cute Cape Cod with great location now that the 10th St Extension is complete. Covered rocking chair front porch.
-
2025-05-18price $168,070 112-char remark
Show marketing remark (112 chars)
Cute Cape Cod with great location now that the 10th St Extension is complete. Covered rocking chair front porch.
-
2025-04-11price $171,500 112-char remark
Show marketing remark (112 chars)
Cute Cape Cod with great location now that the 10th St Extension is complete. Covered rocking chair front porch.
-
2025-03-07price $175,000 112-char remark
Show marketing remark (112 chars)
Cute Cape Cod with great location now that the 10th St Extension is complete. Covered rocking chair front porch.
-
2025-01-03$178,750 Active 112-char remark
Show marketing remark (112 chars)
Cute Cape Cod with great location now that the 10th St Extension is complete. Covered rocking chair front porch.
-
2020-12-09historical
-
2020-06-08$104,950
-
2015-10-28soldstatus $600,000
-
2015-09-11historical
-
2015-07-10$65,000
-
1983-05-05soldstatus $7,000
-
1962-01-01soldstatus $8,500
ⓘ Source: listings_history table (triggers on properties + properties_extension) + one-shot
backfill from property_details.listing_events for pre-trigger history.
Tax reassessment forecast VA · Resets to sale price
- Current annual tax
- $992 · $83/mo
- Projected year-2 tax
- $1,196 · $100/mo
- Expected delta
- +$205/yr (+$17/mo · 20.6%)
ⓘ Screening estimate from a state-policy table — verify with the county assessor before closing.
Climate risk First Street
- Flood 1/10 Low FEMA zone X (unshaded) · 0% chance over 30 yrs
- Wildfire 1/10 Low
- Heat 5/10 Major 7 d/yr ≥101°F today · 17 d/yr by 30 yrs out
- Wind 2/10 Low 100% chance of damaging wind over 30 yrs
- Air quality 1/10 Low 0 unhealthy d/yr today · 0 by 30 yrs out
Nearby sold comps map
Loading sold comps map…
Walkable amenities ~0.75 mi
Loading nearby amenities…
Taxation est. · year 1
- Rental income
- $17,375
- − Mortgage interest
- −$8,173
- − Property taxes
- −$992
- − Insurance
- −$730
- − Repairs & maintenance
- −$1,390
- − Management
- −$1,390
- − Depreciation
- −$4,245
- Taxable income
- $456
- Est. tax owed @ 24.0%
- −$109
- After-tax cash flow
- $2,713/yr
For passive investors: Depreciation is non-cash, so a rental often shows a tax loss while cash-flowing — sheltering income. Rental losses are passive: they offset passive income freely, and up to $25,000/yr can offset ordinary (W-2) income if you actively participate and your MAGI is under $100k (phasing out to $0 by $150k); unused losses carry forward. On sale, claimed depreciation is recaptured at up to 25%, and gains may owe capital-gains tax (a 1031 exchange can defer both). Figures are a year-1 estimate at your 24.0% rate — not tax advice; consult a CPA.
Schools (NCES district)
- District
- Roanoke City Public School District
- NCES district ID
- 5103300
- Math proficiency
- 40% ▼ -38.00%
- Reading proficiency
- 58% ▼ -12.00%
- Median HH income
- $38,592
- Composite
- 40.8/100
- National rank
- #3639
- State rank
- #102 of 131 in VA
Livability — Roanoke
- Score
- 73/100
- State rank
- #163
- US rank
- #5055
Category grades
Schools grade is shown separately in the Schools card above.
Census & demographics
- Census place
- Roanoke, VA
- County
- Roanoke City · 101,625 people
- City population
- 168,930
- Metro
- Roanoke, VA
- Population (ZIP)
- 28,235
- Household income
- $52,973
- Rent vs Own
- Severe rent burden
- 1360.0
Population outlook (Roanoke County) Hauer SSP2
- Today (2025)
- 106,094 people
- By 2030
- 108,927 · +2.7%
- By 2040
- 114,104 · +7.5%
- By 2050
- 118,032 · +11.3%
- By 2075
- 123,363 · +16.3%
- By 2100
- 116,827 · +10.1%
Race, ethnicity, and origin ACS 2023
- Neighborhood character
- Diverse neighborhood (Simpson 0.59)
- Race & ethnicity
- White 60% Black 16% Hispanic / Latino 14% Two or more races 13% Asian 4%
- Hispanic origin (detail)
- Mexican 4% Dominican 1%
- Common ancestry
- Romanian 2% Slovak 2% Serbian 1%
- Foreign-born
- 11% · Canada, Vietnam, Jamaica
- Languages at home
- 84% English-only · Spanish 11% Other Asian/Pacific 2% Vietnamese 2%
Political lean MEDSL · Roanoke
- 2024 margin
- Strong D (+23.6) · D 61.1% · R 37.5% · Other 1.4%
- 2008→2024 swing
- +0.2pp no change · 2008: 23.4pp · 2024: 23.6pp
- All cycles
- 2024: D+23.6 2020: D+25.8 2016: D+17.6 2012: D+21.5 2008: D+23.4
Not yet ingested
- Civics
- —
Market trends
- HPI YoY
- ▼ -137.94%
- Current HPI
- 186.9007
- Rent YoY
- ▲ 10.46%
- Metro
- Roanoke, VA
- State GDP YoY
- ▲ 2.40%
- F500 in state
- 50
Industry mix (Fortune 500 HQ in VA)
| Industry | F500 HQs | Revenue |
|---|---|---|
| Aerospace / Defense | 4 | $236B |
|
||
| Technology / Defense | 3 | $32B |
|
||
| Financial Services | 2 | $176B |
|
||
| Utilities | 2 | $27B |
|
||
| Insurance | 2 | $25B |
|
||
| Technology | 2 | $15B |
|
||
Price history
+1616.5% since first listed18 events — show timeline
- 2026-02-05 Price Changed $145,906 MLSRV
- 2026-01-05 Price Changed $148,884 MLSRV
- 2025-11-12 Price Changed $151,922 MLSRV
- 2025-10-08 Price Changed $155,022 MLSRV
- 2025-09-03 Price Changed $158,186 MLSRV
- 2025-08-08 Price Changed $161,414 MLSRV
- 2025-06-26 Price Changed $164,709 MLSRV
- 2025-05-18 Price Changed $168,070 MLSRV
- 2025-04-11 Price Changed $171,500 MLSRV
- 2025-03-07 Price Changed $175,000 MLSRV
- 2025-01-03 Listed $178,750 MLSRV
- 2020-12-09 Listing Removed — MLSRV
- 2020-06-08 Listed $104,950 MLSRV
- 2015-10-28 Sold (Public Records) $600,000 Public Records
- 2015-09-11 Listing Removed — MLSRV
- 2015-07-10 Listed $65,000 MLSRV
- 1983-05-05 Sold (Public Records) $7,000 Public Records
- 1962-01-01 Sold (Public Records) $8,500 Public Records
Property tax history
+10.2%/yrLatest (2025): $992 · +5.9% YoY. Source: county tax records.
Cash-flow waterfall
monthlySold comps — $/sqft
last 12 mo · ≤1 miLoading sold comps…