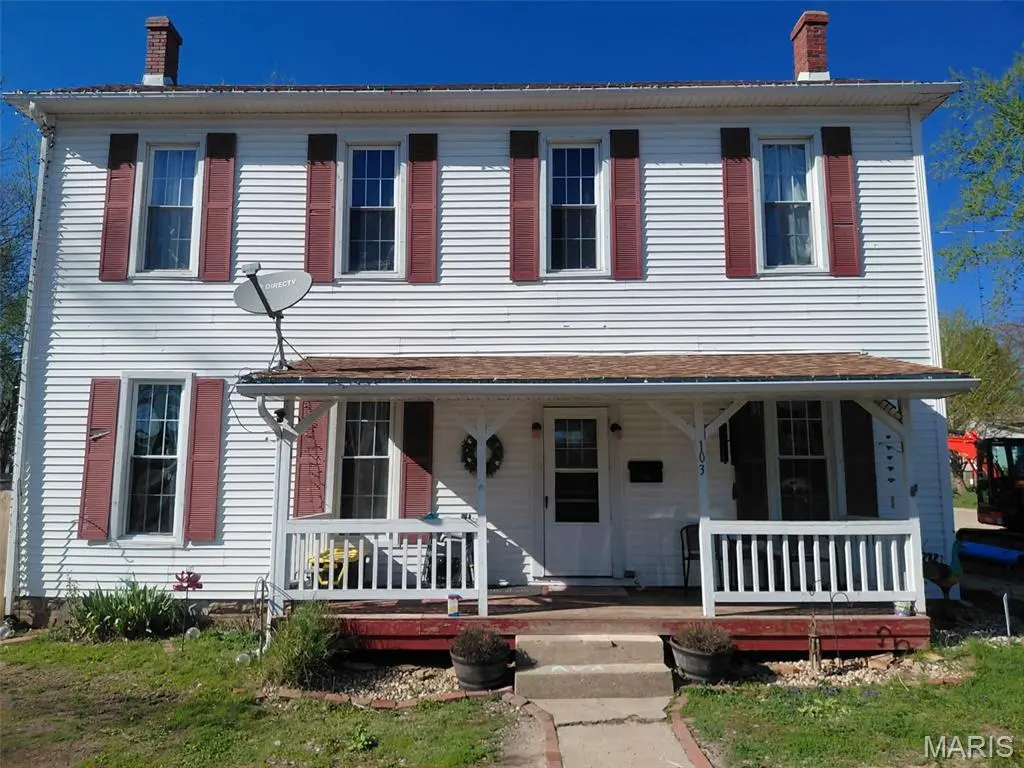
103 W Main St · Vandalia, IL
Flood risk 1/10 · Minimal
- FEMA flood zone
- —
- Chance of flooding over 30 yrs
- 0.0%
- Est. flood insurance / yr
- —
Fire risk 1/10 · Minimal
- Est. fire insurance / yr
- $804 – $1,492
Heat risk 4/10 · Minor
- Hot days now (above 105°F)
- 7 days/yr
- Hot days in 30 yrs
- 19 days/yr
Wind risk 2/10 · Minimal
- Chance of severe wind over 30 yrs
- 2.0%
Air-quality risk 2/10 · Minimal
- Unhealthy air days now
- 1 days/yr
- Unhealthy air days in 30 yrs
- 2 days/yr
Risk factors via First Street. Map © Google.
Why this score? — see what drove the C+ grade
The composite is a weighted blend of 9 inputs, each scored 0–100. Each bar is that input's sub-score; the figure is the points it added to the 100-point composite (weight × sub-score).
- Cash flow +28.8/30.0
- DSCR +10.0/10.0
- 1% rule +8.0/10.0
- ARV discount +7.5/15.0
- Livability +3.6/5.0
- Rent growth +2.5/5.0
- Condition / age +2.5/5.0
- Schools +1.8/10.0
- Appreciation +0.0/10.0
$79,000
🖨 Deal sheet 📄 Offer letter ✓ Due diligence
Listing remarks
Charming two-story home on a desirable corner lot, featuring a welcoming front porch perfect for relaxing. Inside, you’ll find a beautifully updated kitchen, bathroom, and laundry room. Enjoy a fully fenced backyard ideal for pets, play, or entertaining. With a brand-new roof installed in 2025, this move-in ready home is waiting for its next family to make it their own.
Key facts
- Brand new roof
- Front porch
- Updated kitchen
Tags
Property features AI
Exterior
- Utilities: Community water; Public sewer; Electricity (single phase); Natural gas connected; Water connected; Sewer connected; Electricity connected
- Home design: Single family residence; Two levels; Residential property
- Construction: Vinyl siding; Architectural shingle roof
- Exterior features: Back yard fencing; City lot on a corner parcel; Level lot
Interior
- Kitchen: Free-standing electric range; Free-standing refrigerator; Kitchen approximately 16x11
- Bedrooms: 3 bedrooms (all on the upper level); Bedroom sizes roughly 15x15, 11x9, and 15x9
- Bathrooms: 1 full bathroom (main level)
- Heating & cooling: Forced air heating; Central air conditioning
- Interior features: Basement with block construction
- Laundry & utility: Laundry room (about 8x8)
Neighborhood map
What this means for you Summary
Snapshot
- This is a 3-bed/1.0-bath other listed at $79k.
Deal economics
- At list price, monthly cash flow is $266 ($3k/yr) — positive.
- The deal already cash-flows at list — no discount required.
- Meets the 1% rule at list price ($1k rent vs $79k).
- Recommended offer: $77k (3.0% below list) — sets the bar for market timing.
- Cap rate 10.3% vs local median 4.9% in Vandalia — top-decile yield for the area; either an underpriced asset or a hidden risk that comps aren't pricing in. Stress-test before assuming the spread holds.
Location & tenants
- Location reads 71/100 on livability (#348 in IL) — a middle-class / working-renter tenant base. Strengths: crime A+, cost of living A+, housing A-; Watch: employment D, amenities F, commute F.
- Vandalia CUSD 203 (town): math 17% / reading 25% proficiency, ranked #414 of 620 in IL (top 67%) — low school quality limits family demand, transient renter base, plan for 1-2y turnover.
- Zoned schools: Vandalia Community High School (math 17% / reading 22%, grade F, #397 of 693 statewide, top 61%, 408 students, 0% FRL) — zoned schools average 0% FRL vs 51% district-wide (51 pts lower); this property's tenant base skews higher-income than the district average.
- Market conditions: 44 active listings in the ZIP.
Forward outlook
- Local home prices are declining (-3.0%/yr); year-one equity from $546 of loan paydown is wiped out by about $2k of value loss. Plan a longer hold.
- Fayette County population projected to shrink 9% by 2050 — rents likely to lag national; underwrite the cash flow, not the appreciation.
- At projected returns (-3.0% appreciation + 3.0% rent growth), your $22k cash investment doubles in ~9 years — after that, you're playing with house money.
Negotiation context
- It's been on market 44 days — a 3% lower offer ($77k) is reasonable based on typical stale-listing flexibility.
Risks & watch-outs
- Watch-outs: built in 1895 — expect roof / HVAC / electrical / plumbing capex.
Questions for the listing agent
- It's been on market 44 days. Have you received any prior offers? Is the seller open to a 3% concession, seller financing, or rate buy-down credit?
- Built in 1895 — when were the roof, HVAC, electrical panel, plumbing, and water heater last replaced?
- Is there a deadline driving the sale (1031 exchange, divorce, estate, relocation)? That informs how much negotiation room exists.
- Schools are D-rated, which usually means shorter tenancies and higher turnover. Who's the typical renter profile here, and what's been the actual vacancy rate?
- What's the average days-on-market for RENTAL listings here right now (not sales)? A rising rental-DOM trend means longer vacancies and softer asking-rent achievability than the comps imply.
- What's the recent tenant-quality profile in this submarket — average credit score on applications, eviction rate, late-payment / NSF rate, and stable-employment percentage? A property-management company in the area should have these aggregated.
- How much new for-sale + rental construction is in the pipeline within 1–3 miles? Heavy new supply typically softens prices + rents 12–24 months out; constrained supply supports both.
Investment metrics
- 1% rule
- 1.30% ✓
- Cap rate
- 10.34%
- Cash-on-cash
- 14.44%
- DSCR
- 1.64
- GRM
- 6.4
CMA / ARV
No comps found within radius.
Projected returns pro-forma
-3.0% appreciation · 3.0% rent growth · sell at horizon
- IRR
- 4.9%
- Equity multiple
- 1.19×
- Total profit
- $4,163
- Equity at exit
- $11,779
- IRR
- 14.3%
- Equity multiple
- 2.15×
- Total profit
- $25,516
- Equity at exit
- $6,830
Cash invested: $22,120 (down + closing). Projections, not guarantees.
Landlord ↔ Tenant lean methodology
- Overall (STATE)
- 43 Moderately Tenant-Leaning
- State Illinois
- 43 Moderately Tenant-Leaning · D+7
- County
- — inherits STATE
- City
- — inherits STATE
ZIP-level market 62471
- Active inventory
- 44
- Price-to-rent
- 6.4×
Monthly cashflow live
- Estimated rent
- $1,030 medium interval (Pro) →
- Mortgage (P&I)
- −$414
- Tax from tax record
- −$100 /mo · $1,201/yr
- Insurance
- −$33
- HOA
- −$0
- Vacancy / Maint / Mgmt
- −$216
- Net cashflow
- $266
Break-even live
UW: 25.0% down · 7.5% · 30yr · 1.5% tax · 5.0% vac · 8.0% maint · 8.0% mgmt
Financing live
Cash to close
- Down payment
- $19,750
- Closing costs
- $2,370
- Reserves months
- —
- Total cash needed
- —
Loan-product check · same deal, 3 products live
Conventional
25% down · 7.5% · 30yr
- Down + closing
- —
- Monthly P&I
- —
- Monthly cashflow
- —
- DSCR
- —
- Eligible?
- —
Personal DTI + credit; lowest rate.
DSCR
20% down · 8.5% · 30yr
- Down + closing
- —
- Monthly P&I
- —
- Monthly cashflow
- —
- DSCR
- —
- Eligible?
- —
No personal income docs; deal must DSCR.
Hard money
10% down · 12.0% · 12mo
- Down + closing
- —
- Monthly P&I
- —
- Monthly cashflow
- —
- DSCR
- —
- Eligible?
- —
Short-term bridge; refi at stabilization.
Listing history 8 events
-
2026-06-01status $79,000 Pending 44 DOM
-
2026-06-01days on market $79,000 Active Under Contract 44 DOM
-
2026-05-31days on market $79,000 Active Under Contract 43 DOM
-
2026-05-31days on market $79,000 Active Under Contract 42 DOM
-
2026-04-20historical Active Under Contract
-
2026-04-18$79,000 Active
-
2016-12-09historical
-
2016-05-28price $49,900
ⓘ Source: listings_history table (triggers on properties + properties_extension) + one-shot
backfill from property_details.listing_events for pre-trigger history.
Tax reassessment forecast IL · Partial reset (capped growth)
- Current annual tax
- $1,201 · $100/mo
- Projected year-2 tax
- $1,497 · $125/mo
- Expected delta
- +$296/yr (+$25/mo · 24.6%)
ⓘ Screening estimate from a state-policy table — verify with the county assessor before closing.
Climate risk First Street
- Flood 1/10 Low 0% chance over 30 yrs
- Wildfire 1/10 Low
- Heat 4/10 Moderate 7 d/yr ≥105°F today · 19 d/yr by 30 yrs out
- Wind 2/10 Low 2% chance of damaging wind over 30 yrs
- Air quality 2/10 Low 1 unhealthy d/yr today · 2 by 30 yrs out
Nearby sold comps map
Loading sold comps map…
Walkable amenities ~0.75 mi
Loading nearby amenities…
Taxation est. · year 1
- Rental income
- $12,356
- − Mortgage interest
- −$4,425
- − Property taxes
- −$1,201
- − Insurance
- −$395
- − Repairs & maintenance
- −$988
- − Management
- −$988
- − Depreciation
- −$2,298
- Taxable income
- $2,059
- Est. tax owed @ 24.0%
- −$494
- After-tax cash flow
- $2,699/yr
For passive investors: Depreciation is non-cash, so a rental often shows a tax loss while cash-flowing — sheltering income. Rental losses are passive: they offset passive income freely, and up to $25,000/yr can offset ordinary (W-2) income if you actively participate and your MAGI is under $100k (phasing out to $0 by $150k); unused losses carry forward. On sale, claimed depreciation is recaptured at up to 25%, and gains may owe capital-gains tax (a 1031 exchange can defer both). Figures are a year-1 estimate at your 24.0% rate — not tax advice; consult a CPA.
Schools (NCES district)
- District
- Vandalia CUSD 203
- NCES district ID
- 1740140
- Math proficiency
- 17% ▼ -4.00%
- Reading proficiency
- 25% ▼ -7.00%
- Median HH income
- $45,995
- Composite
- 18.33/100
- National rank
- #8948
- State rank
- #414 of 620 in IL
Livability — Vandalia
- Score
- 71/100
- State rank
- #348
- US rank
- #7078
Category grades
Schools grade is shown separately in the Schools card above.
Census & demographics
- Census place
- Vandalia, IL
- City population
- 10,309
- Population (ZIP)
- 10,309
Population outlook (Fayette County) Hauer SSP2
- Today (2025)
- 21,667 people
- By 2030
- 21,362 · -1.4%
- By 2040
- 20,602 · -4.9%
- By 2050
- 19,669 · -9.2%
- By 2075
- 16,870 · -22.1%
- By 2100
- 12,861 · -40.6%
Race, ethnicity, and origin ACS 2023
- Neighborhood character
- Predominantly White (86%)
- Race & ethnicity
- White 86% Black 7% Two or more races 5% Hispanic / Latino 4%
- Common ancestry
- Lithuanian 2% Slovak 1% Romanian 1%
- Foreign-born
- 2% · Canada
- Languages at home
- 92% English-only · Spanish 4% German/W. Germanic 3%
Political lean MEDSL · Fayette
- 2024 margin
- Solid R (+64.7) · D 17.0% · R 81.7% · Other 1.3%
- 2008→2024 swing
- -48.9pp toward R · 2008: -15.8pp · 2024: -64.7pp
- All cycles
- 2024: R+64.7 2020: R+61.8 2016: R+58.3 2012: R+34.6 2008: R+15.8
Not yet ingested
- Civics
- —
Market trends
- HPI YoY
- ▼ -73.05%
- Current HPI
- 133.4945
- Rent YoY
- —
- Metro
- —
- State GDP YoY
- ▲ 1.59%
- F500 in state
- 60
Industry mix (Fortune 500 HQ in IL)
| Industry | F500 HQs | Revenue |
|---|---|---|
| Insurance | 4 | $201B |
|
||
| Consumer Goods | 4 | $87B |
|
||
| Industrial Machinery | 3 | $64B |
|
||
| Healthcare | 2 | $55B |
|
||
| Retail / Pharmacy | 1 | $148B |
|
||
| Agriculture / Food | 1 | $86B |
|
||
Price history
+58.3% since first listed4 events — show timeline
- 2026-04-20 Contingent — MARIS as Distributed by MLS Grid
- 2026-04-18 Listed $79,000 MARIS as Distributed by MLS Grid
- 2016-12-09 Listing Removed — MRED as Distributed by MLS Grid
- 2016-05-28 Price Changed $49,900 MARIS as Distributed by MLS Grid
Property tax history
+7.3%/yrLatest (2024): $1,201 · +1.8% YoY. Source: county tax records.
Cash-flow waterfall
monthlySold comps — $/sqft
last 12 mo · ≤1 miLoading sold comps…