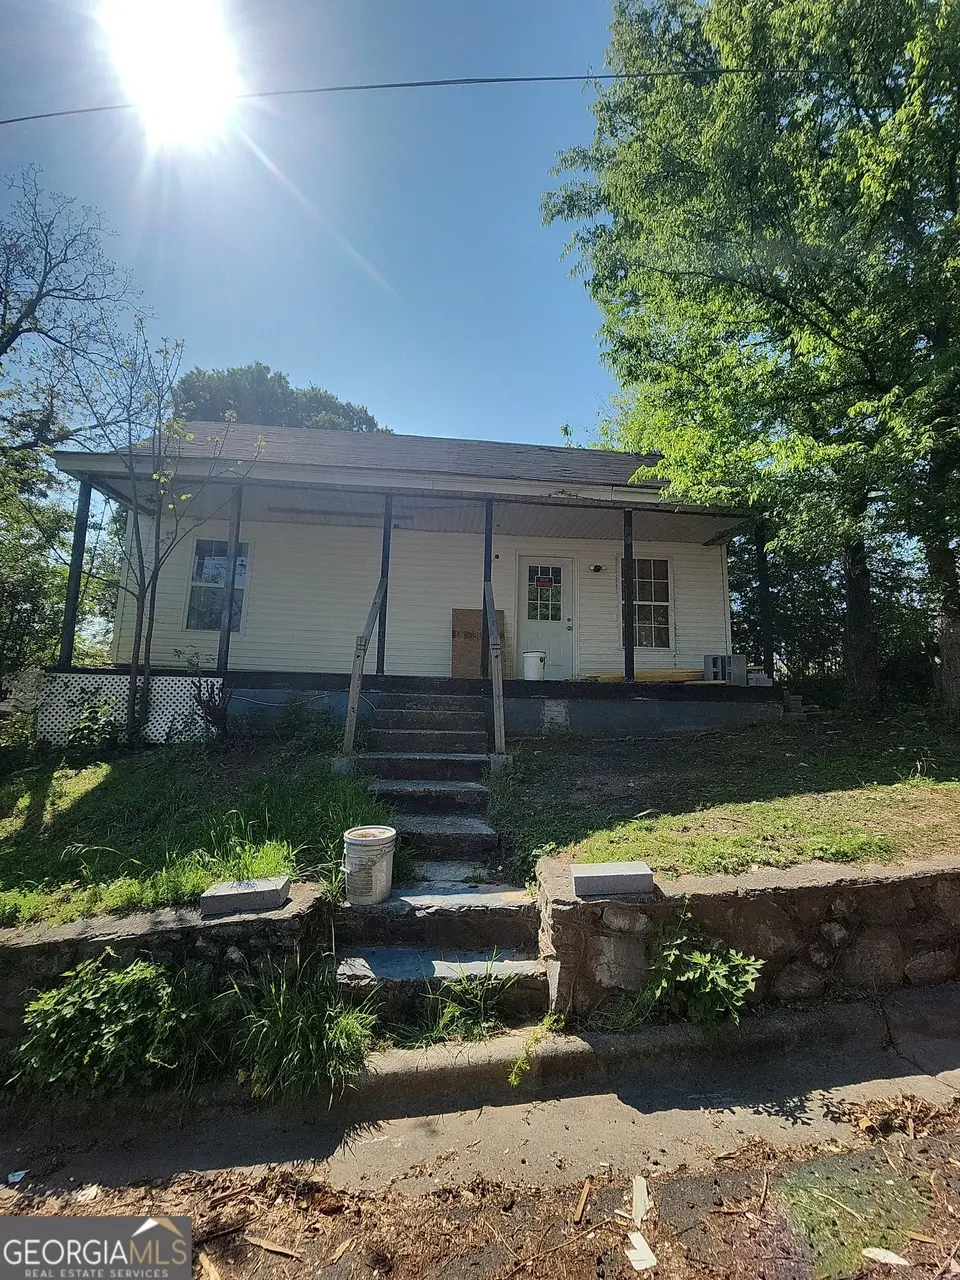
5 Ross St · Rome, GA
Flood risk 1/10 · Minimal
- FEMA flood zone
- X (unshaded)
- Chance of flooding over 30 yrs
- 0.0%
- Est. flood insurance / yr
- $507 – $1,088
Fire risk 3/10 · Minor
- Est. fire insurance / yr
- $963 – $1,789
Heat risk 7/10 · Major
- Hot days now (above 104°F)
- 7 days/yr
- Hot days in 30 yrs
- 20 days/yr
Wind risk 4/10 · Minor
- Chance of severe wind over 30 yrs
- 18.0%
Air-quality risk 3/10 · Minor
- Unhealthy air days now
- 3 days/yr
- Unhealthy air days in 30 yrs
- 3 days/yr
Risk factors via First Street. Map © Google.
Why this score? — see what drove the B- grade
The composite is a weighted blend of 9 inputs, each scored 0–100. Each bar is that input's sub-score; the figure is the points it added to the 100-point composite (weight × sub-score).
- Cash flow +30.0/30.0
- 1% rule +10.0/10.0
- DSCR +10.0/10.0
- ARV discount +7.5/15.0
- Rent growth +4.1/5.0
- Livability +3.2/5.0
- Condition / age +2.5/5.0
- Schools +2.3/10.0
- Appreciation +0.0/10.0
$69,999
🖨 Deal sheet 📄 Offer letter ✓ Due diligence
Listing remarks MLS
Investment opportunity located in the Tax Allocation District 5 within 1 mile to the heart of downtown Rome. This 3 bedroom, 1 bathroom is sold AS-IS. Brand new HVAC unit.
Key facts
- Brand new hvac unit
- 3,484 sq ft lot
- Built 1912
Tags
Property features AI
Finance
- Other: Directions provided but not included here
- Financial info: Multi-family units to be built: 0
- HOA & community: Community amenities include proximity to public transport, schools, and shopping
Exterior
- Parking: On-street parking; Open parking available
- Security: No security features listed
- Utilities: Public water; Public sewer; 220-volt electric service; Cable available; Electricity available; Natural gas available; Water available
- Home design: One-level home; Facing/entry direction not specified; Fee simple ownership; Property listed as fixer
- Construction: Block and vinyl siding construction; Composition roof; Block foundation; Built area above grade listed (size not shown in sections)
- Exterior features: Front porch; Rear porch; Asphalt road frontage; Located on a city street; Near public transport, schools, and shopping
Interior
- Kitchen: No specific kitchen features listed
- Bedrooms: Three main-level bedrooms
- Flooring: Other flooring
- Bathrooms: One full bathroom (main level)
- Heating & cooling: Central heating (electric); Central air conditioning (electric)
- Interior features: No shared/common walls; Attic; Crawl space
- Laundry & utility: No specific laundry features listed
Neighborhood map
What this means for you Summary
Snapshot
- This is a 3-bed/1.0-bath single-family listed at $70k.
Deal economics
- At list price, monthly cash flow is $762 ($9k/yr) — positive.
- The deal already cash-flows at list — no discount required.
- Meets the 1% rule at list price ($2k rent vs $70k).
- Recommended offer: $68k (3.0% below list) — sets the bar for market timing.
- Cap rate 19.3% vs local median 3.3% in Rome — top-decile yield for the area; either an underpriced asset or a hidden risk that comps aren't pricing in. Stress-test before assuming the spread holds.
Location & tenants
- Location reads 64/100 on livability (#266 in GA) — a middle-class / working-renter tenant base. Strengths: cost of living A+, housing A+, health & safety A+; Watch: crime F, amenities F, commute F.
- Rome City (urban): math 27% / reading 29% proficiency, ranked #112 of 174 in GA (top 64%) — low school quality limits family demand, transient renter base, plan for 1-2y turnover; 71% free/reduced lunch — lower-income household profile, screen leases tightly.
- Zoned schools: Main Elementary School (math 9% / reading 10%, grade F, #1,122 of 1,228 statewide, top 91%, 419 students, 97% FRL); Rome Middle School (math 32% / reading 35%, grade F, #206 of 470 statewide, top 45%, 966 students, 55% FRL); Rome High School (math 12% / reading 15%, grade F, #325 of 424 statewide, top 78%, 2,095 students, 66% FRL) — zoned schools at 73% FRL track the district average.
- Market conditions: Rents rising fast (+6.3%/yr); 411 active listings in the ZIP; 8 comparable units currently listed for rent nearby; rentals lingering (median 44d on market — plan ~5-8 weeks vacancy on turnover, expect pricing pressure); 100% of comp listings sitting > 30 days — soft ceiling on asking rent; 355 units permitted in Floyd County in 2024 (0 in 5+ unit buildings).
Forward outlook
- Local home prices are declining (-3.0%/yr); year-one equity from $484 of loan paydown is wiped out by about $2k of value loss. Plan a longer hold.
- Floyd County population projected to shrink 6% by 2050 — rents likely to lag national; underwrite the cash flow, not the appreciation.
- At projected returns (-3.0% appreciation + 6.3% rent growth), your $20k cash investment doubles in ~3 years — after that, you're playing with house money.
Negotiation context
- It's been on market 32 days — a 3% lower offer ($68k) is reasonable based on typical stale-listing flexibility.
- 3 sale attempts since 11y ago; this cycle's ask has dropped $15k (18%) from the opening price — seller is motivated, your offer sets the floor, not the list.
- Current owner paid $32k; list at $70k implies a 121% gain — meaningful room to come down on a strong offer.
Risks & watch-outs
- Watch-outs: built in 1912 — expect roof / HVAC / electrical / plumbing capex.
- Climate carrying-cost: extreme-heat days projected 7→20/yr by 2055 (HVAC capex compounding) — expect insurance premiums to compound above CPI over the hold.
Questions for the listing agent
- It's been on market 32 days. Have you received any prior offers? Is the seller open to a 3% concession, seller financing, or rate buy-down credit?
- Built in 1912 — when were the roof, HVAC, electrical panel, plumbing, and water heater last replaced?
- Is there a deadline driving the sale (1031 exchange, divorce, estate, relocation)? That informs how much negotiation room exists.
- Schools are F-rated, which usually means shorter tenancies and higher turnover. Who's the typical renter profile here, and what's been the actual vacancy rate?
- Crime grade is F in this area — have there been break-ins, vandalism, or insurance claims at this property in the last 3 years? What carrier currently insures it and at what premium?
- What's the average days-on-market for RENTAL listings here right now (not sales)? A rising rental-DOM trend means longer vacancies and softer asking-rent achievability than the comps imply.
- What's the recent tenant-quality profile in this submarket — average credit score on applications, eviction rate, late-payment / NSF rate, and stable-employment percentage? A property-management company in the area should have these aggregated.
- How much new for-sale + rental construction is in the pipeline within 1–3 miles? Heavy new supply typically softens prices + rents 12–24 months out; constrained supply supports both.
Investment metrics
- 1% rule
- 2.31% ✓
- Cap rate
- 19.35%
- Cash-on-cash
- 46.63%
- DSCR
- 3.07
- GRM
- 3.6
CMA / ARV
- ARV (median comp)
- $186,925
- List price
- $69,999
- Delta
- -54.53%
- Verdict
- UNDERPRICED
- Comps
- 20 within 1.0 mi
Show comp detail 12 sales within ~0.75 mi
| Address | Dist | Beds/Ba | Sqft | Sold | Price | $/sf | Match |
|---|---|---|---|---|---|---|---|
| 102 Smith St | 0.04mi | 3/2.0 | 1,409 (+7%) | 6mo | $190,000 | $135 | 78 |
| 200 Ross St NE | 0.31mi | 3/2.0 | 1,358 (+3%) | 9mo | $190,000 | $140 | 69 |
| 308 Reservoir St NE | 0.25mi | 4/2.0 (+1) | 1,363 (+3%) | 14mo | $220,000 | $161 | 62 |
| 204 E 6th Ave | 0.40mi | 3/2.0 | 1,397 (+6%) | 7mo | $329,900 | $236 | 62 |
| 470 E 3rd St | 0.48mi | 2/2.0 (-1) | 1,336 (+1%) | 10mo | $220,360 | $165 | 58 |
| 122 Perkins St NE | 0.74mi | 3/2.0 | 1,289 (-2%) | 3mo | $199,000 | $154 | 55 |
| 203 Forsyth St NE | 0.67mi | 3/2.0 | 1,395 (+6%) | 1mo | $90,000 | $65 | 54 |
| 205 Camp St NE | 0.51mi | 2/2.0 (-1) | 1,224 (-7%) | 10mo | $182,000 | $149 | 47 |
| 302 Wright St NE | 0.58mi | 3/2.0 | 1,442 (+9%) | 11mo | $222,000 | $154 | 45 |
| 205 Forsyth St NE | 0.68mi | 3/2.5 | 1,400 (+6%) | 13mo | $219,000 | $156 | 41 |
| 307 Roswell Ave SE | 0.69mi | 2/2.0 (-1) | 1,410 (+7%) | 13mo | $297,500 | $211 | 37 |
| 1 Chambers St NE | 0.59mi | 3/2.0 | 1,140 (-14%) | 12mo | $239,000 | $210 | 36 |
Match score weights: distance 35% · size 25% · config 20% · recency 20%. Top-matched comps best support the ARV.
Projected returns pro-forma
-3.0% appreciation · 6.28% rent growth · sell at horizon
- IRR
- 47.7%
- Equity multiple
- 3.18×
- Total profit
- $42,726
- Equity at exit
- $10,437
- IRR
- 54.8%
- Equity multiple
- 7.33×
- Total profit
- $124,064
- Equity at exit
- $6,052
Cash invested: $19,600 (down + closing). Projections, not guarantees.
Landlord ↔ Tenant lean methodology
- Overall (STATE)
- 90 Strongly Landlord-Friendly
- State Georgia
- 90 Strongly Landlord-Friendly · R+3
- County
- — inherits STATE
- City
- — inherits STATE
ZIP-level market 30161
- Rents YoY
- 6.3%
- Active inventory
- 411
- Price-to-rent
- 3.6×
Monthly cashflow live
- Estimated rent
- $1,618 high interval (Pro) →
- Mortgage (P&I)
- −$367
- Tax from tax record
- −$121 /mo · $1,447/yr
- Insurance
- −$29
- HOA
- −$0
- Vacancy / Maint / Mgmt
- −$340
- Net cashflow
- $762
Break-even live
UW: 25.0% down · 7.5% · 30yr · 1.5% tax · 5.0% vac · 8.0% maint · 8.0% mgmt
Financing live
Cash to close
- Down payment
- $17,500
- Closing costs
- $2,100
- Reserves months
- —
- Total cash needed
- —
Loan-product check · same deal, 3 products live
Conventional
25% down · 7.5% · 30yr
- Down + closing
- —
- Monthly P&I
- —
- Monthly cashflow
- —
- DSCR
- —
- Eligible?
- —
Personal DTI + credit; lowest rate.
DSCR
20% down · 8.5% · 30yr
- Down + closing
- —
- Monthly P&I
- —
- Monthly cashflow
- —
- DSCR
- —
- Eligible?
- —
No personal income docs; deal must DSCR.
Hard money
10% down · 12.0% · 12mo
- Down + closing
- —
- Monthly P&I
- —
- Monthly cashflow
- —
- DSCR
- —
- Eligible?
- —
Short-term bridge; refi at stabilization.
Rent comps 8 comps
| Address | Beds | Baths | Sqft | Rent | $/sqft | DOM | Units | Dist |
|---|---|---|---|---|---|---|---|---|
| 413 E 2nd St Rome, GA | 2.0 | 1.5 | 1328 | $1,275 | $0.96 | 43d | 1 | 0.50mi |
| 3 Forsyth St NE Rome, GA | 3.0 | 2.0 | 1134 | $1,795 | $1.58 | 43d | 1 | 0.58mi |
| 1 Roseway Cir NE Rome, GA | 2.0 | 1.0 | 875 | $1,200 | $1.37 | 43d | 1 | 0.68mi |
| 105 W Callahan St Rome, GA | 3.0 | 2.0 | 1500 | $2,000 | $1.33 | 43d | 1 | 0.70mi |
| 340 W 3rd St Rome, GA | 2.0 | 1.0–2.0 | 804 | $2,225 | $2.77 | 43d | 27 | 0.70mi |
| 525 W 13th St NE Rome, GA | 2.0–3.0 | 2.0 | 1059 | $1,499 | $1.41 | 43d | 12 | 1.09mi |
| 1005 N 2nd Ave NW #26 Rome, GA | 3.0 | 2.5 | 1418 | $1,700 | $1.20 | 43d | 1 | 1.36mi |
| 19 Poplar St NE Unit Na Rome, GA | 2.0 | 1.0 | 1020 | $1,550 | $1.52 | 43d | 1 | 1.46mi |
Listing history 30 events
-
2026-06-19days on market $69,999 Active 32 DOM
-
2026-06-18days on market $69,999 Active 31 DOM
-
2026-06-17days on market $69,999 Active 30 DOM
-
2026-06-16days on market $69,999 Active 29 DOM
-
2026-06-15days on market $69,999 Active 28 DOM
-
2026-06-14days on market $69,999 Active 26 DOM
-
2026-06-13days on market $69,999 Active 25 DOM
-
2026-06-10days on market $69,999 Active 23 DOM
-
2026-06-09days on market $69,999 Active 22 DOM
-
2026-06-08days on market $69,999 Active 21 DOM
-
2026-06-07days on market $69,999 Active 20 DOM
-
2026-06-05days on market $69,999 Active 17 DOM
-
2026-06-03days on market $69,999 Active 16 DOM
-
2026-06-02days on market $69,999 Active 15 DOM
-
2026-06-01days on market $69,999 Active 14 DOM
-
2026-05-31days on market $69,999 Active 13 DOM
-
2026-05-30days on market $69,999 Active 12 DOM
-
2026-05-04$85,000 Active 172-char remark
-
2026-04-22$85,000 New 172-char remark
Show marketing remark (172 chars)
Investment opportunity located in the Tax Allocation District 5 within 1 mile to the heart of downtown Rome. This 3 bedroom, 1 bathroom is sold AS-IS. Brand new HVAC unit.
-
2026-01-23soldstatus $31,735
-
2015-08-11price $16,000
Show marketing remark (285 chars)
TWO BEDROOM IN DOWNTOWN AREA. HAS HAD SOME REMODELING. ROSS IS A ONE WAY STREET SO BE SURE TO ENTER OFF BROAD STREET AT END NEAREST NORTH BROAD AT FIVE POINTS RED LIGHT. SOLD "AS IS"! NO WARRANTIES OR GUARANTEES! BANK OWNED! FORECLOSURE. ADDENDUM MUST ACCOMPANY OFFER.
-
2015-07-27historical
Show marketing remark (285 chars)
TWO BEDROOM IN DOWNTOWN AREA. HAS HAD SOME REMODELING. ROSS IS A ONE WAY STREET SO BE SURE TO ENTER OFF BROAD STREET AT END NEAREST NORTH BROAD AT FIVE POINTS RED LIGHT. SOLD "AS IS"! NO WARRANTIES OR GUARANTEES! BANK OWNED! FORECLOSURE. ADDENDUM MUST ACCOMPANY OFFER.
-
2015-07-24soldstatus $16,000 Sold
Show marketing remark (285 chars)
TWO BEDROOM IN DOWNTOWN AREA. HAS HAD SOME REMODELING. ROSS IS A ONE WAY STREET SO BE SURE TO ENTER OFF BROAD STREET AT END NEAREST NORTH BROAD AT FIVE POINTS RED LIGHT. SOLD "AS IS"! NO WARRANTIES OR GUARANTEES! BANK OWNED! FORECLOSURE. ADDENDUM MUST ACCOMPANY OFFER.
-
2015-06-24status Under Contract
Show marketing remark (285 chars)
TWO BEDROOM IN DOWNTOWN AREA. HAS HAD SOME REMODELING. ROSS IS A ONE WAY STREET SO BE SURE TO ENTER OFF BROAD STREET AT END NEAREST NORTH BROAD AT FIVE POINTS RED LIGHT. SOLD "AS IS"! NO WARRANTIES OR GUARANTEES! BANK OWNED! FORECLOSURE. ADDENDUM MUST ACCOMPANY OFFER.
-
2015-06-24price $22,900
Show marketing remark (285 chars)
TWO BEDROOM IN DOWNTOWN AREA. HAS HAD SOME REMODELING. ROSS IS A ONE WAY STREET SO BE SURE TO ENTER OFF BROAD STREET AT END NEAREST NORTH BROAD AT FIVE POINTS RED LIGHT. SOLD "AS IS"! NO WARRANTIES OR GUARANTEES! BANK OWNED! FORECLOSURE. ADDENDUM MUST ACCOMPANY OFFER.
-
2015-04-01$22,900 New
Show marketing remark (285 chars)
TWO BEDROOM IN DOWNTOWN AREA. HAS HAD SOME REMODELING. ROSS IS A ONE WAY STREET SO BE SURE TO ENTER OFF BROAD STREET AT END NEAREST NORTH BROAD AT FIVE POINTS RED LIGHT. SOLD "AS IS"! NO WARRANTIES OR GUARANTEES! BANK OWNED! FORECLOSURE. ADDENDUM MUST ACCOMPANY OFFER.
-
2003-09-29soldstatus $27,500
-
1999-02-04soldstatus $60,000
-
1984-04-03soldstatus $31,800
-
1978-01-21soldstatus $40,000
ⓘ Source: listings_history table (triggers on properties + properties_extension) + one-shot
backfill from property_details.listing_events for pre-trigger history.
Tax reassessment forecast GA · Resets to sale price
- Current annual tax
- $1,447 · $121/mo
- Projected year-2 tax
- $1,447 · $121/mo
- Expected delta
- $0/yr ($0/mo · 0.0%)
ⓘ Screening estimate from a state-policy table — verify with the county assessor before closing.
Climate risk First Street
- Flood 1/10 Low FEMA zone X (unshaded) · 0% chance over 30 yrs
- Wildfire 3/10 Moderate
- Heat 7/10 Severe 7 d/yr ≥104°F today · 20 d/yr by 30 yrs out
- Wind 4/10 Moderate 18% chance of damaging wind over 30 yrs
- Air quality 3/10 Moderate 3 unhealthy d/yr today · 3 by 30 yrs out
Nearby sold comps map
Loading sold comps map…
Walkable amenities ~0.75 mi
Loading nearby amenities…
Taxation est. · year 1
- Rental income
- $19,420
- − Mortgage interest
- −$3,921
- − Property taxes
- −$1,447
- − Insurance
- −$350
- − Repairs & maintenance
- −$1,554
- − Management
- −$1,554
- − Depreciation
- −$2,036
- Taxable income
- $8,558
- Est. tax owed @ 24.0%
- −$2,054
- After-tax cash flow
- $7,085/yr
For passive investors: Depreciation is non-cash, so a rental often shows a tax loss while cash-flowing — sheltering income. Rental losses are passive: they offset passive income freely, and up to $25,000/yr can offset ordinary (W-2) income if you actively participate and your MAGI is under $100k (phasing out to $0 by $150k); unused losses carry forward. On sale, claimed depreciation is recaptured at up to 25%, and gains may owe capital-gains tax (a 1031 exchange can defer both). Figures are a year-1 estimate at your 24.0% rate — not tax advice; consult a CPA.
Schools (NCES district)
- District
- Rome City
- NCES district ID
- 1304440
- Math proficiency
- 27% ▼ -14.00%
- Reading proficiency
- 29% ▼ -4.00%
- Median HH income
- $34,889
- Composite
- 23.1/100
- National rank
- #7963
- State rank
- #112 of 174 in GA
Livability — Rome
- Score
- 64/100
- State rank
- #266
- US rank
- #14459
Category grades
Schools grade is shown separately in the Schools card above.
Census & demographics
- Census place
- Rome, GA
- County
- Floyd County · 77,706 people
- City population
- 77,706
- Metro
- Rome, GA
- Population (ZIP)
- 34,705
- Household income
- $61,667
- Rent vs Own
- Severe rent burden
- 1104.0
Population outlook (Floyd County) Hauer SSP2
- Today (2025)
- 96,321 people
- By 2030
- 95,532 · -0.8%
- By 2040
- 93,332 · -3.1%
- By 2050
- 90,850 · -5.7%
- By 2075
- 84,989 · -11.8%
- By 2100
- 76,097 · -21.0%
Race, ethnicity, and origin ACS 2023
- Neighborhood character
- Predominantly White (68%)
- Race & ethnicity
- White 68% Black 20% Hispanic / Latino 7% Two or more races 6% Asian 1%
- Hispanic origin (detail)
- Mexican 2%
- Common ancestry
- Slovak 3% Serbian 2% Italian 2%
- Foreign-born
- 5% · Canada
- Languages at home
- 91% English-only · Spanish 5% Other Indo-European 1%
Political lean MEDSL · Floyd
- 2024 margin
- Solid R (+42.0) · D 28.8% · R 70.7%
- 2008→2024 swing
- -5.6pp toward R · 2008: -36.4pp · 2024: -42.0pp
- All cycles
- 2024: R+42.0 2020: R+41.1 2016: R+43.5 2012: R+39.9 2008: R+36.4
Not yet ingested
- Civics
- —
Market trends
- HPI YoY
- ▼ -186.06%
- Current HPI
- 257.8168
- Rent YoY
- ▲ 6.28%
- Metro
- Rome, GA
- State GDP YoY
- ▲ 2.66%
- F500 in state
- 28
Industry mix (Fortune 500 HQ in GA)
| Industry | F500 HQs | Revenue |
|---|---|---|
| Paper / Packaging | 2 | $29B |
|
||
| Retail | 1 | $160B |
|
||
| Transportation / Logistics | 1 | $91B |
|
||
| Airlines | 1 | $62B |
|
||
| Consumer Goods | 1 | $47B |
|
||
| Utilities | 1 | $25B |
|
||
Price history
+75.0% since first listed17 events — show timeline
- 2026-05-26 Price Changed $69,999 FMLS
- 2026-05-26 Price Changed $69,999 GAMLS
- 2026-05-24 Price Changed $75,000 FMLS
- 2026-05-24 Price Changed $75,000 GAMLS
- 2026-05-04 Listed $85,000 FMLS
- 2026-04-22 Listed $85,000 GAMLS
- 2026-01-23 Sold (Public Records) $31,735 Public Records
- 2015-08-11 Price Changed $16,000 GAMLS
- 2015-07-27 Listing Removed — GAMLS
- 2015-07-24 Sold (MLS) $16,000 GAMLS
- 2015-06-24 Pending — GAMLS
- 2015-06-24 Price Changed $22,900 GAMLS
- 2015-04-01 Listed $22,900 GAMLS
- 2003-09-29 Sold (Public Records) $27,500 Public Records
- 1999-02-04 Sold (Public Records) $60,000 Public Records
- 1984-04-03 Sold (Public Records) $31,800 Public Records
- 1978-01-21 Sold (Public Records) $40,000 Public Records
Property tax history
+12.0%/yrLatest (2025): $1,447 · +9.9% YoY. Source: county tax records.
Cash-flow waterfall
monthlySold comps — $/sqft
last 12 mo · ≤1 miLoading sold comps…