1289 Barrigona Ct · Island Walk, FL
Flood risk 1/10 · Minimal
- FEMA flood zone
- X (unshaded)
- Chance of flooding over 30 yrs
- 0.0%
- Est. flood insurance / yr
- $507 – $1,088
Fire risk 4/10 · Minor
- Est. fire insurance / yr
- $947 – $1,759
Heat risk 9/10 · Severe
- Hot days now (above 107°F)
- 3 days/yr
- Hot days in 30 yrs
- 14 days/yr
Wind risk 10/10 · Severe
- Chance of severe wind over 30 yrs
- 99.0%
Air-quality risk 2/10 · Minimal
- Unhealthy air days now
- 2 days/yr
- Unhealthy air days in 30 yrs
- 2 days/yr
Risk factors via First Street. Map © Google.
Why this score? — see what drove the F grade
The composite is a weighted blend of 9 inputs, each scored 0–100. Each bar is that input's sub-score; the figure is the points it added to the 100-point composite (weight × sub-score).
- ARV discount +7.5/15.0
- Schools +5.0/10.0
- Livability +3.2/5.0
- Condition / age +2.5/5.0
- Rent growth +1.9/5.0
- Cash flow +1.7/30.0
- 1% rule +0.0/10.0
- DSCR +0.0/10.0
- Appreciation +0.0/10.0
$689,900
🖨 Deal sheet (PDF) 📄 Offer letter ✓ Due diligence
Listing remarks
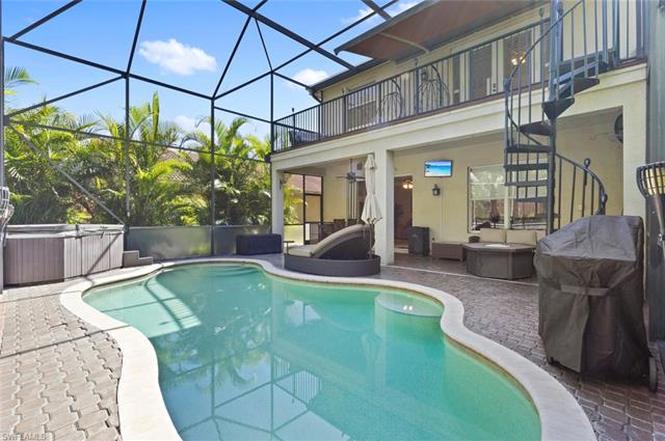
This classic 4 bedroom, 2.5 bath “Monaco” model is ideally located on a quiet cul-de-sac just steps away from the clubhouse and all the ample amenities! This model features a unique second-story balcony, a thoughtful addition that brings extra outdoor space and charm to an already functional floor plan. Step inside to spacious and comfortable main living areas with wood and tile flooring throughout the first floor, neutral finishes, and an abundance of natural light that makes the home feel bright and welcoming. The kitchen has been updated and opens right into the family room, making it perfect for everyday living and entertaining. The first floor is dedicated entirely to livin
Key facts
- Above ground spa
- Second story balcony
- Custom dual vanities
Tags
Property features AI
Finance
- Other: No RV allowed (restrictions)
- Financial info: Total annual recurring fees listed; Total one-time fees listed
- HOA & community: Mandatory HOA (gated community); Quarterly HOA fee; Professional management; HOA maintenance covers cable, insurance, internet/WiFi access, irrigation water, lawn/land maintenance, and street lights; Community amenities include clubhouse, community pool and spa, exercise room, tennis, pickleball, basketball, volleyball, bike/jog paths, sidewalks, business center, billiards, and more
Exterior
- Parking: Attached 2-car garage
- Security: Monitored alarm; Entry keypad; Gated community with guard at gate and patrolled security
- Utilities: Central water; Sewer assessment paid; Cable available; Electric service for heat and cooling
- Home design: Residential single-family home; 2-story; Rear exposure facing east; Located in the Saturnia Lakes community
- Construction: Built in 2002; Concrete block and wood frame construction; Tile roof
- Exterior features: Deck; Stone exterior finish; Above-ground private spa; Below-ground private pool; Double-hung windows; Manual shutters
Interior
- Kitchen: Pantry; Built-in desk; Dishwasher; Disposal; Microwave; Refrigerator/ice maker; Freezer
- Bedrooms: 4 bedrooms; Master bedroom upstairs
- Flooring: Carpet; Laminate; Tile; Wood
- Bathrooms: 2 full bathrooms; 1 half bathroom; Master bath with dual sinks and multiple shower heads (shower only)
- Heating & cooling: Central electric heat; Central electric cooling; Ceiling fans
- Interior features: Built-in cabinets; Cable prewire; French doors; Pantry; Smoke detectors; Walk-in closet; Built-in desk; Breakfast bar; Dining (family and living); Balcony; Family room; Screened lanai/porch; Unfurnished; Great room floor plan; Split bedroom layout; 5 ceiling fans
- Laundry & utility: Washer; Dryer; Auto garage door
Neighborhood map
What this means for you Summary
Snapshot
- This is a 4-bed/2.5-bath single-family listed at $690k.
Deal economics
- At list price, monthly cash flow is $-3k ($-32k/yr) — negative.
- To cash-flow at today's rent, offer at most $307k (55.5% below list).
- To meet the 1% rule (rent ≥ 1% of price), the offer needs to be $346k (49.8% below list).
- Recommended offer: $307k (55.5% below list) — sets the bar for cash-flow.
Location & tenants
- Location reads 64/100 on livability (#692 in FL) — a middle-class / working-renter tenant base. Strengths: crime A+, employment A+, housing B+; Watch: health & safety D, amenities F, commute F.
- Collier (suburban): math 60% / reading 56% proficiency, ranked #16 of 73 in FL (top 22%) — acceptable for families but not a draw, mixed tenant base, ~2y average lease.
- Zoned schools: Laurel Oak Elementary School (math 82% / reading 77%, grade A, #116 of 2,144 statewide, top 6%, 1,203 students, 20% FRL); Oakridge Middle School (math 75% / reading 67%, grade A, #59 of 571 statewide, top 11%, 1,183 students, 26% FRL); Gulf Coast High School (math 57% / reading 68%, grade B-, #93 of 667 statewide, top 14%, 2,447 students, 20% FRL) — zoned schools average 22% FRL vs 55% district-wide (33 pts lower); this property's tenant base skews higher-income than the district average.
- Zoned-school proficiency averages 71% at this address vs 58% district-wide (+13 pts) — the actual schools serving this property are materially stronger than the Collier average implies; a family-tenant draw the district grade alone would hide.
- Market conditions: Rents soft (-2.5%/yr); 590 active listings in the ZIP; 13 comparable units currently listed for rent nearby; rentals at typical pace (median 25d on market — plan ~3-4 weeks tenant-placement turnaround); high-income renter base; 3,520 units permitted in Collier County in 2024 (959 in 5+ unit buildings).
- This rent runs 37% of the median local income ($113k/yr) — at the standard rent-burdened threshold; future hikes will face affordability resistance.
Forward outlook
- Local home prices are declining (-3.0%/yr); year-one equity from $5k of loan paydown is wiped out by about $21k of value loss. Plan a longer hold.
- Collier County population projected at +30% by 2050 — long-run rental-demand tailwind backs the buy-and-hold thesis.
Negotiation context
- It's been on market 332 days — a 12% lower offer ($607k) is reasonable based on typical stale-listing flexibility.
Risks & watch-outs
- Climate carrying-cost: severe wind risk, 99% chance of damaging wind over 30y; extreme-heat days projected 3→14/yr by 2055 (HVAC capex compounding) — expect insurance premiums to compound above CPI over the hold.
Questions for the listing agent
- What do current leases actually rent for vs. the listed asking? Can we see a recent rent roll and the last 12 months of T-12 income?
- It's been on market 332 days. Have you received any prior offers? Is the seller open to a 56% concession, seller financing, or rate buy-down credit?
- What does the HOA fee cover, when was the last increase, and are there any pending special assessments or reserve-fund shortfalls?
- Why hasn't it sold? Are there any deal-killer items the seller is aware of (foundation, flood, title, zoning, code violations)?
- Is there a deadline driving the sale (1031 exchange, divorce, estate, relocation)? That informs how much negotiation room exists.
- The area grade is low — what's the realistic commute time and amenity access for the typical tenant pool here? Any planned neighborhood developments (good or bad) we should know about?
- What's the average days-on-market for RENTAL listings here right now (not sales)? A rising rental-DOM trend means longer vacancies and softer asking-rent achievability than the comps imply.
- What's the recent tenant-quality profile in this submarket — average credit score on applications, eviction rate, late-payment / NSF rate, and stable-employment percentage? A property-management company in the area should have these aggregated.
- How much new for-sale + rental construction is in the pipeline within 1–3 miles? Heavy new supply typically softens prices + rents 12–24 months out; constrained supply supports both.
Investment metrics
- 1% rule
- 0.50% ✗
- Cap rate
- 1.69%
- Cash-on-cash
- -16.45%
- DSCR
- 0.27
- GRM
- 16.6
CMA / ARV
No comps found within radius.
Projected returns pro-forma
-3.0% appreciation · 0.0% rent growth · sell at horizon
- IRR
- -52.3%
- Equity multiple
- -0.50×
- Total profit
- $-290,183
- Equity at exit
- $102,866
- IRR
- —
- Equity multiple
- -1.63×
- Total profit
- $-507,344
- Equity at exit
- $59,650
Cash invested: $193,172 (down + closing). Projections, not guarantees.
Landlord ↔ Tenant lean methodology
- Overall (STATE)
- 87 Strongly Landlord-Friendly
- State Florida
- 87 Strongly Landlord-Friendly · R+3
- County
- — inherits STATE
- City
- — inherits STATE
ZIP-level market 34119
- Rents YoY
- -2.5%
- Active inventory
- 590
- Price-to-rent
- 16.6×
Monthly cashflow live
- Estimated rent
- $3,463 high interval (Pro) →
- Mortgage (P&I)
- −$3,618
- Tax est. 1.5%
- −$862 /mo · $10,348/yr
- Insurance
- −$287
- HOA
- −$616
- Vacancy / Maint / Mgmt
- −$727
- Net cashflow
- $-2,648
Break-even live
Sensitivity live
| Price | -10% $-2,172 | -5% $-2,410 | +0% $-2,648 | +5% $-2,887 | +10% $-3,125 |
|---|---|---|---|---|---|
| Rent | -10% $-2,922 | -5% $-2,785 | +0% $-2,648 | +5% $-2,512 | +10% $-2,375 |
| Rate | -1.0pp $-2,301 | -0.5pp $-2,473 | base $-2,648 | +0.5pp $-2,827 | +1.0pp $-3,009 |
UW: 25.0% down · 7.5% · 30yr · 1.5% tax · 5.0% vac · 8.0% maint · 8.0% mgmt
Financing live
Cash to close
- Down payment
- $172,475
- Closing costs
- $20,697
- Reserves months
- —
- Total cash needed
- —
Loan-product check · same deal, 3 products live
Conventional
25% down · 7.5% · 30yr
- Down + closing
- —
- Monthly P&I
- —
- Monthly cashflow
- —
- DSCR
- —
- Eligible?
- —
Personal DTI + credit; lowest rate.
DSCR
20% down · 8.5% · 30yr
- Down + closing
- —
- Monthly P&I
- —
- Monthly cashflow
- —
- DSCR
- —
- Eligible?
- —
No personal income docs; deal must DSCR.
Hard money
10% down · 12.0% · 12mo
- Down + closing
- —
- Monthly P&I
- —
- Monthly cashflow
- —
- DSCR
- —
- Eligible?
- —
Short-term bridge; refi at stabilization.
Rent comps 13 comps
| Address | Beds | Baths | Sqft | Rent | $/sqft | DOM | Units | Dist |
|---|---|---|---|---|---|---|---|---|
| 7905 Preserve Cir Naples, FL | 3.0 | 2.0 | 1400 | $3,050 | $2.18 | 25d | 2 | 0.77mi |
| 7905 Preserve Cir Naples, FL | 2.0–3.0 | 1.0–2.0 | 1272 | $5,000 | $3.93 | 15d | 3 | 0.77mi |
| 10815 Renaissance Ct Urban Estates, FL | 1.0–3.0 | 1.0–2.0 | 890 | $2,587 | $2.91 | 15d | 176 | 0.92mi |
| 8067 Dream Catcher Cir Naples, FL | 2.0–3.0 | 2.5 | 1430 | $2,803 | $1.96 | 15d | 28 | 0.92mi |
| 8164 Ibis Cove Cir Unit B202 Naples, FL | 3.0 | 2.0 | 1455 | $2,750 | $1.89 | 25d | 1 | 0.94mi |
| 8211 Ibis Cove Cir Unit A119 Naples, FL | 3.0 | 2.0 | 1455 | $2,500 | $1.72 | 25d | 1 | 0.97mi |
| 8207 Ibis Cove Cir Unit Y Naples, FL | 3.0 | 2.0 | 1455 | $2,800 | $1.92 | 25d | 1 | 0.97mi |
| 8207 Ibis Cove Cir Unit S Naples, FL | 3.0 | 2.0 | 1455 | $5,000 | $3.44 | 25d | 1 | 0.97mi |
| 8151 Ibis Cove Cir Naples, FL | 3.0 | 2.0 | 1455 | $2,295 | $1.58 | 15d | 1 | 0.98mi |
| 8288 Key Royal Ln #1431 Naples, FL | 3.0 | 2.0 | 1186 | $2,195 | $1.85 | 15d | 1 | 1.15mi |
| 2115 Malibu Lake Cir Naples, FL | 1.0–4.0 | 1.0–2.0 | 1188 | $3,299 | $2.78 | 15d | 56 | 1.36mi |
| 6544 Huntington Lakes Cir Unit 9-204 Naples, FL | 3.0 | 2.0 | 1382 | $4,250 | $3.08 | 25d | 1 | 1.39mi |
| 6655 Huntington Lakes Cir #204 Naples, FL | 3.0 | 2.0 | 1315 | $3,500 | $2.66 | 25d | 1 | 1.43mi |
HOA detail
- Monthly dues
- $616 · $7,392/yr
Listing history 17 events
-
2026-06-22days on market $689,900 Active 332 DOM
-
2026-06-18days on market $689,900 Active 329 DOM
-
2026-06-17days on market $689,900 Active 328 DOM
-
2026-06-16days on market $689,900 Active 327 DOM
-
2026-06-15days on market $689,900 Active 326 DOM
-
2026-06-10days on market $689,900 Active 321 DOM
-
2026-06-09days on market $689,900 Active 320 DOM
-
2026-06-08days on market $689,900 Active 319 DOM
-
2026-06-07days on market $689,900 Active 318 DOM
-
2026-06-02days on market $689,900 Active 313 DOM
-
2026-06-01days on market $689,900 Active 312 DOM
-
2026-05-31days on market $689,900 Active 311 DOM
-
2026-05-30days on market $689,900 Active 310 DOM
-
2026-03-27price $689,900
-
2026-01-06price $699,900
-
2025-10-08price $735,000
-
2025-07-24$760,000 Active
ⓘ Source: listings_history table (triggers on properties + properties_extension) + one-shot
backfill from property_details.listing_events for pre-trigger history.
Climate risk First Street
- Flood 1/10 Low FEMA zone X (unshaded) · 0% chance over 30 yrs
- Wildfire 4/10 Moderate
- Heat 9/10 Extreme 3 d/yr ≥107°F today · 14 d/yr by 30 yrs out
- Wind 10/10 Extreme 99% chance of damaging wind over 30 yrs
- Air quality 2/10 Low 2 unhealthy d/yr today · 2 by 30 yrs out
Nearby sold comps map
Loading sold comps map…
Walkable amenities ~0.75 mi
Loading nearby amenities…
Taxation est. · year 1
- Rental income
- $41,551
- − Mortgage interest
- −$38,645
- − Property taxes
- −$10,348
- − Insurance
- −$3,450
- − Repairs & maintenance
- −$3,324
- − Management
- −$3,324
- − HOA
- −$7,392
- − Depreciation
- −$20,070
- Taxable loss
- −$45,002
- Est. tax savings @ 24.0%
- +$10,801
- After-tax cash flow
- $-20,979/yr
For passive investors: Depreciation is non-cash, so a rental often shows a tax loss while cash-flowing — sheltering income. Rental losses are passive: they offset passive income freely, and up to $25,000/yr can offset ordinary (W-2) income if you actively participate and your MAGI is under $100k (phasing out to $0 by $150k); unused losses carry forward. On sale, claimed depreciation is recaptured at up to 25%, and gains may owe capital-gains tax (a 1031 exchange can defer both). Figures are a year-1 estimate at your 24.0% rate — not tax advice; consult a CPA.
Schools (NCES district)
- District
- Collier
- NCES district ID
- 1200330
- Math proficiency
- 60% ▼ -4.00%
- Reading proficiency
- 56% ▼ -2.00%
- Median HH income
- $58,275
- Composite
- 50.23/100
- National rank
- #1892
- State rank
- #16 of 73 in FL
Livability — Island Walk
- Score
- 64/100
- State rank
- #692
- US rank
- #14444
Category grades
Schools grade is shown separately in the Schools card above.
Census & demographics
- County
- Collier County · 396,295 people
- Metro
- Naples-Marco Island, FL
- Population (ZIP)
- 36,807
- Household income
- $113,391
- Rent vs Own
- Severe rent burden
- 741.0
Population outlook (Collier County) Hauer SSP2
- Today (2025)
- 420,858 people
- By 2030
- 450,054 · +6.9%
- By 2040
- 502,232 · +19.3%
- By 2050
- 544,932 · +29.5%
- By 2075
- 627,203 · +49.0%
- By 2100
- 659,015 · +56.6%
Race, ethnicity, and origin ACS 2023
- Neighborhood character
- Predominantly White (74%)
- Race & ethnicity
- White 74% Hispanic / Latino 20% Two or more races 14% Black 1%
- Hispanic origin (detail)
- Mexican 6% Puerto Rican 2% Cuban 4% Dominican 2%
- Common ancestry
- Romanian 4% Lithuanian 2% Italian 2%
- Foreign-born
- 17% · Canada, Jamaica, Dominican Republic
- Languages at home
- 78% English-only · Spanish 15% Other Indo-European 3% Russian/Polish/Slavic 1%
Political lean MEDSL · Collier
- 2024 margin
- Solid R (+33.1) · D 33.1% · R 66.2%
- 2008→2024 swing
- -10.6pp toward R · 2008: -22.5pp · 2024: -33.1pp
- All cycles
- 2024: R+33.1 2020: R+24.7 2016: R+26.0 2012: R+30.1 2008: R+22.5
Not yet ingested
- Civics
- —
Market trends
- HPI YoY
- ▼ -243.12%
- Current HPI
- 269.3208
- Rent YoY
- ▼ -2.51%
- Metro
- Naples-Marco Island, FL
- State GDP YoY
- ▲ 3.28%
- F500 in state
- 36
Industry mix (Fortune 500 HQ in FL)
| Industry | F500 HQs | Revenue |
|---|---|---|
| Industrial Technology | 2 | $29B |
|
||
| Insurance | 2 | $17B |
|
||
| Retail | 1 | $60B |
|
||
| Technology Distribution | 1 | $58B |
|
||
| Homebuilding | 1 | $35B |
|
||
| Technology Manufacturing | 1 | $35B |
|
||
Price history
-9.2% since first listed4 events — show timeline
- 2026-03-27 Price Changed $689,900 NAPLESMLS
- 2026-01-06 Price Changed $699,900 NAPLESMLS
- 2025-10-08 Price Changed $735,000 NAPLESMLS
- 2025-07-24 Listed $760,000 NAPLESMLS
Property tax history
-18.8%/yrLatest (2025): $262 · -91.3% YoY. Source: county tax records.
Cash-flow waterfall
monthlySold comps — $/sqft
last 12 mo · ≤1 miLoading sold comps…