800 Blue Stem St · Yulee, FL
Flood risk 1/10 · Minimal
- FEMA flood zone
- X (unshaded)
- Chance of flooding over 30 yrs
- 0.0%
- Est. flood insurance / yr
- $507 – $1,088
Fire risk 6/10 · Moderate
- Est. fire insurance / yr
- $947 – $1,759
Heat risk 9/10 · Severe
- Hot days now (above 107°F)
- 7 days/yr
- Hot days in 30 yrs
- 20 days/yr
Wind risk 9/10 · Severe
- Chance of severe wind over 30 yrs
- 99.0%
Air-quality risk 5/10 · Moderate
- Unhealthy air days now
- 6 days/yr
- Unhealthy air days in 30 yrs
- 7 days/yr
Risk factors via First Street. Map © Google.
Why this score? — see what drove the D- grade
The composite is a weighted blend of 9 inputs, each scored 0–100. Each bar is that input's sub-score; the figure is the points it added to the 100-point composite (weight × sub-score).
- Appreciation +10.0/10.0
- ARV discount +7.5/15.0
- Schools +6.0/10.0
- Cash flow +5.0/30.0
- Livability +3.3/5.0
- Rent growth +3.2/5.0
- Condition / age +2.5/5.0
- 1% rule +2.1/10.0
- DSCR +0.0/10.0
$387,170
🖨 Deal sheet (PDF) 📄 Offer letter ✓ Due diligence
Listing remarks
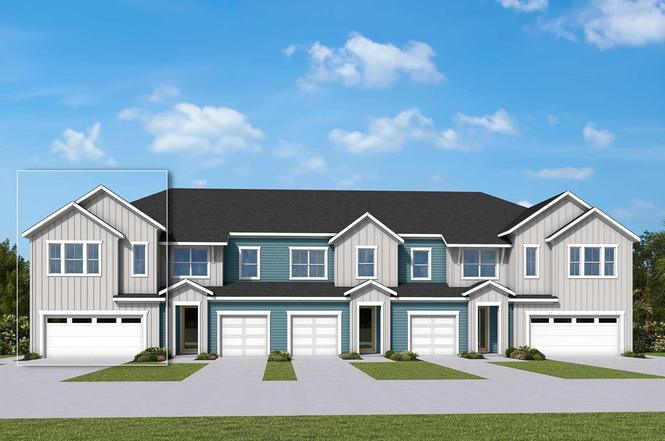
Welcome to the Peppermill, a beautifully designed two-story townhome offering the perfect blend of comfort, style, and modern convenience. With 1,774 square feet of thoughtfully planned living space, this home lives large and provides the ideal layout for both everyday living and effortless entertaining. Step inside to a bright, open-concept main floor featuring a spacious great room, a dining area, and a well-appointed kitchen that flows seamlessly together—perfect for hosting gatherings or enjoying quiet evenings at home. A conveniently located half bath adds extra functionality on the first level. Upstairs, you’ll find all three bedrooms, including a private owner’s sui
Key facts
- $417 HOA
- 2 garage spots
- Built 2026
Property features AI
Finance
- HOA & community: Homeowners association present with annual fee of $1,220 and monthly fee of $316
Exterior
- Parking: Two-car garage
- Utilities: Public water; Public sewer
- Home design: 2-story home; New construction
- Construction: Frame construction; Shingle roof; Built by David Weekley Homes
- Exterior features: Paved road access; 20' wide lot
Interior
- Kitchen: Dishwasher; Disposal; Microwave; Stove
- Bedrooms: Bedrooms located on the upper level; Bonus room on the upper level
- Flooring: Carpet in bedrooms and bonus room; Plank/Vinyl flooring in main-level family room, dining room, and kitchen
- Bathrooms: 2 full bathrooms; 1 partial bathroom
- Interior features: Vinyl windows
Neighborhood map
What this means for you Summary
Snapshot
- This is a 3-bed/2.5-bath townhouse listed at $387k.
Deal economics
- At list price, monthly cash flow is $-913 ($-11k/yr) — negative.
- To cash-flow at today's rent, offer at most $255k (34.1% below list).
- To meet the 1% rule (rent ≥ 1% of price), the offer needs to be $276k (28.7% below list).
- Recommended offer: $255k (34.1% below list) — sets the bar for cash-flow.
Location & tenants
- Location reads 66/100 on livability (#605 in FL) — a middle-class / working-renter tenant base. Strengths: housing A+, cost of living A-, crime B+; Watch: amenities F, commute F, health & safety F.
- Nassau (town): math 74% / reading 65% proficiency, ranked #4 of 73 in FL (top 6%) — acceptable for families but not a draw, mixed tenant base, ~2y average lease.
- Market conditions: Rents rising (+2.9%/yr); 601 active listings in the ZIP; 6 comparable units currently listed for rent nearby; rentals at typical pace (median 23d on market — plan ~3-4 weeks tenant-placement turnaround); solid renter incomes; 953 units permitted in Nassau County in 2024 (24 in 5+ unit buildings).
- This rent runs 36% of the median local income ($93k/yr) — at the standard rent-burdened threshold; future hikes will face affordability resistance.
Forward outlook
- In year one you build about $41k of equity ($3k loan paydown + $39k appreciation (10.0% local appreciation)).
- Nassau County population projected at +17% by 2050 — long-run rental-demand tailwind backs the buy-and-hold thesis.
- By year 2, paydown + projected appreciation supports a ~$67k cash-out refi (75% LTV) — recoverable capital for the next deal without selling this one.
Negotiation context
- It's been on market 103 days — a 9% lower offer ($352k) is reasonable based on typical stale-listing flexibility.
Risks & watch-outs
- Climate carrying-cost: severe wind risk, 99% chance of damaging wind over 30y; major wildfire risk; extreme-heat days projected 7→20/yr by 2055 (HVAC capex compounding) — expect insurance premiums to compound above CPI over the hold.
Questions for the listing agent
- What do current leases actually rent for vs. the listed asking? Can we see a recent rent roll and the last 12 months of T-12 income?
- It's been on market 103 days. Have you received any prior offers? Is the seller open to a 34% concession, seller financing, or rate buy-down credit?
- What does the HOA fee cover, when was the last increase, and are there any pending special assessments or reserve-fund shortfalls?
- Why hasn't it sold? Are there any deal-killer items the seller is aware of (foundation, flood, title, zoning, code violations)?
- Is there a deadline driving the sale (1031 exchange, divorce, estate, relocation)? That informs how much negotiation room exists.
- Schools are B-rated — typically a magnet for longer-tenancy family renters. What's the average tenant stay here, and is there a school-zone premium baked into asking?
- The area grade is low — what's the realistic commute time and amenity access for the typical tenant pool here? Any planned neighborhood developments (good or bad) we should know about?
- What's the average days-on-market for RENTAL listings here right now (not sales)? A rising rental-DOM trend means longer vacancies and softer asking-rent achievability than the comps imply.
- What's the recent tenant-quality profile in this submarket — average credit score on applications, eviction rate, late-payment / NSF rate, and stable-employment percentage? A property-management company in the area should have these aggregated.
- How much new for-sale + rental construction is in the pipeline within 1–3 miles? Heavy new supply typically softens prices + rents 12–24 months out; constrained supply supports both.
Investment metrics
- 1% rule
- 0.71% ✗
- Cap rate
- 3.46%
- Cash-on-cash
- -10.11%
- DSCR
- 0.55
- GRM
- 11.7
CMA / ARV
No comps found within radius.
Projected returns pro-forma
10.0% appreciation · 2.88% rent growth · sell at horizon
- IRR
- 17.2%
- Equity multiple
- 2.41×
- Total profit
- $152,685
- Equity at exit
- $348,793
- IRR
- 16.3%
- Equity multiple
- 5.57×
- Total profit
- $495,276
- Equity at exit
- $752,186
Cash invested: $108,408 (down + closing). Projections, not guarantees.
Landlord ↔ Tenant lean methodology
- Overall (STATE)
- 87 Strongly Landlord-Friendly
- State Florida
- 87 Strongly Landlord-Friendly · R+3
- County
- — inherits STATE
- City
- — inherits STATE
ZIP-level market 32097
- Home prices YoY
- 19.5%
- Rents YoY
- 2.9%
- Active inventory
- 601
- Price-to-rent
- 11.7×
Monthly cashflow live
- Estimated rent
- $2,759 high interval (Pro) →
- Mortgage (P&I)
- −$2,030
- Tax est. 1.5%
- −$484 /mo · $5,808/yr
- Insurance
- −$161
- HOA
- −$417
- Vacancy / Maint / Mgmt
- −$579
- Net cashflow
- $-913
Break-even live
Sensitivity live
| Price | -10% $-645 | -5% $-779 | +0% $-913 | +5% $-1,047 | +10% $-1,180 |
|---|---|---|---|---|---|
| Rent | -10% $-1,131 | -5% $-1,022 | +0% $-913 | +5% $-804 | +10% $-695 |
| Rate | -1.0pp $-718 | -0.5pp $-814 | base $-913 | +0.5pp $-1,013 | +1.0pp $-1,115 |
UW: 25.0% down · 7.5% · 30yr · 1.5% tax · 5.0% vac · 8.0% maint · 8.0% mgmt
Financing live
Cash to close
- Down payment
- $96,792
- Closing costs
- $11,615
- Reserves months
- —
- Total cash needed
- —
Loan-product check · same deal, 3 products live
Conventional
25% down · 7.5% · 30yr
- Down + closing
- —
- Monthly P&I
- —
- Monthly cashflow
- —
- DSCR
- —
- Eligible?
- —
Personal DTI + credit; lowest rate.
DSCR
20% down · 8.5% · 30yr
- Down + closing
- —
- Monthly P&I
- —
- Monthly cashflow
- —
- DSCR
- —
- Eligible?
- —
No personal income docs; deal must DSCR.
Hard money
10% down · 12.0% · 12mo
- Down + closing
- —
- Monthly P&I
- —
- Monthly cashflow
- —
- DSCR
- —
- Eligible?
- —
Short-term bridge; refi at stabilization.
Rent comps 6 comps
| Address | Beds | Baths | Sqft | Rent | $/sqft | DOM | Units | Dist |
|---|---|---|---|---|---|---|---|---|
| 305 Whitby Dr Yulee, FL | 1.0–3.0 | 1.0–2.5 | 1279 | $2,815 | $2.20 | 3d | 45 | 0.16mi |
| 549 Wildlight Ave Yulee, FL | 1.0–3.0 | 1.0–2.0 | 988 | $2,245 | $2.27 | 3d | 32 | 0.40mi |
| 504 Blue Daze St Yulee, FL | 3.0 | 2.5 | 2038 | $2,595 | $1.27 | 25d | 1 | 0.65mi |
| 722 Cool Breeze Way Yulee, FL | 2.0 | 2.0 | 1541 | $3,100 | $2.01 | 23d | 1 | 0.88mi |
| 719 Cool Breeze Way Yulee, FL | 3.0 | 2.0 | 1575 | $2,995 | $1.90 | 13d | 1 | 0.91mi |
| 213 Daydream Ave Yulee, FL | 3.0 | 2.5 | 1876 | $2,950 | $1.57 | 25d | 1 | 0.92mi |
HOA detail
- Monthly dues
- $417 · $5,004/yr
Listing history 16 events
-
2026-06-21days on market $387,170 Active 103 DOM
-
2026-06-18days on market $387,170 Active 100 DOM
-
2026-06-17days on market $387,170 Active 99 DOM
-
2026-06-16days on market $387,170 Active 98 DOM
-
2026-06-15days on market $387,170 Active 97 DOM
-
2026-06-13days on market $387,170 Active 95 DOM
-
2026-06-13days on market $387,170 Active 94 DOM
-
2026-06-09days on market $387,170 Active 91 DOM
-
2026-06-08days on market $387,170 Active 90 DOM
-
2026-06-07days on market $387,170 Active 89 DOM
-
2026-06-05days on market $387,170 Active 86 DOM
-
2026-06-03days on market $387,170 Active 85 DOM
-
2026-06-02days on market $387,170 Active 84 DOM
-
2026-06-01days on market $387,170 Active 83 DOM
-
2026-05-31days on market $387,170 Active 82 DOM
-
2026-03-10$387,170 Active
ⓘ Source: listings_history table (triggers on properties + properties_extension) + one-shot
backfill from property_details.listing_events for pre-trigger history.
Climate risk First Street
- Flood 1/10 Low FEMA zone X (unshaded) · 0% chance over 30 yrs
- Wildfire 6/10 Major
- Heat 9/10 Extreme 7 d/yr ≥107°F today · 20 d/yr by 30 yrs out
- Wind 9/10 Extreme 99% chance of damaging wind over 30 yrs
- Air quality 5/10 Major 6 unhealthy d/yr today · 7 by 30 yrs out
Nearby sold comps map
Loading sold comps map…
Walkable amenities ~0.75 mi
Loading nearby amenities…
Taxation est. · year 1
- Rental income
- $33,110
- − Mortgage interest
- −$21,688
- − Property taxes
- −$5,808
- − Insurance
- −$1,936
- − Repairs & maintenance
- −$2,649
- − Management
- −$2,649
- − HOA
- −$5,004
- − Depreciation
- −$11,263
- Taxable loss
- −$17,886
- Est. tax savings @ 24.0%
- +$4,293
- After-tax cash flow
- $-6,662/yr
For passive investors: Depreciation is non-cash, so a rental often shows a tax loss while cash-flowing — sheltering income. Rental losses are passive: they offset passive income freely, and up to $25,000/yr can offset ordinary (W-2) income if you actively participate and your MAGI is under $100k (phasing out to $0 by $150k); unused losses carry forward. On sale, claimed depreciation is recaptured at up to 25%, and gains may owe capital-gains tax (a 1031 exchange can defer both). Figures are a year-1 estimate at your 24.0% rate — not tax advice; consult a CPA.
Schools (NCES district)
- District
- Nassau
- NCES district ID
- 1201350
- Math proficiency
- 74% ▼ -2.00%
- Reading proficiency
- 65% ▼ -2.00%
- Median HH income
- $58,267
- Composite
- 59.79/100
- National rank
- #899
- State rank
- #4 of 73 in FL
Livability — Yulee
- Score
- 66/100
- State rank
- #605
- US rank
- #11615
Category grades
Schools grade is shown separately in the Schools card above.
Census & demographics
- County
- Nassau County · 67,729 people
- City population
- 26,700
- Metro
- Jacksonville, FL
- Population (ZIP)
- 26,700
- Household income
- $93,161
- Rent vs Own
- Severe rent burden
- 404.0
Population outlook (Nassau County) Hauer SSP2
- Today (2025)
- 88,419 people
- By 2030
- 92,679 · +4.8%
- By 2040
- 99,257 · +12.3%
- By 2050
- 103,378 · +16.9%
- By 2075
- 109,726 · +24.1%
- By 2100
- 107,006 · +21.0%
Race, ethnicity, and origin ACS 2023
- Neighborhood character
- Predominantly White (75%)
- Race & ethnicity
- White 75% Two or more races 9% Black 9% Hispanic / Latino 8% Asian 1% Native American 1%
- Hispanic origin (detail)
- Mexican 2% Puerto Rican 2%
- Common ancestry
- Lithuanian 4% Italian 3% Romanian 2%
- Foreign-born
- 4% · Canada, Vietnam
- Languages at home
- 93% English-only · Spanish 5% Vietnamese 1%
Political lean MEDSL · Nassau
- 2024 margin
- Solid R (+46.9) · D 26.1% · R 73.1%
- 2008→2024 swing
- -3.1pp toward R · 2008: -43.8pp · 2024: -46.9pp
- All cycles
- 2024: R+46.9 2020: R+45.9 2016: R+50.2 2012: R+48.6 2008: R+43.8
Not yet ingested
- Civics
- —
Market trends
- HPI YoY
- ▲ 49.35%
- Current HPI
- 301.9299
- Rent YoY
- ▲ 2.88%
- Metro
- Jacksonville, FL
- State GDP YoY
- ▲ 3.28%
- F500 in state
- 36
Industry mix (Fortune 500 HQ in FL)
| Industry | F500 HQs | Revenue |
|---|---|---|
| Industrial Technology | 2 | $29B |
|
||
| Insurance | 2 | $17B |
|
||
| Retail | 1 | $60B |
|
||
| Technology Distribution | 1 | $58B |
|
||
| Homebuilding | 1 | $35B |
|
||
| Technology Manufacturing | 1 | $35B |
|
||
Price history
1 event — show timeline
- 2026-03-10 Listed $387,170 AINCAR
Cash-flow waterfall
monthlySold comps — $/sqft
last 12 mo · ≤1 miLoading sold comps…