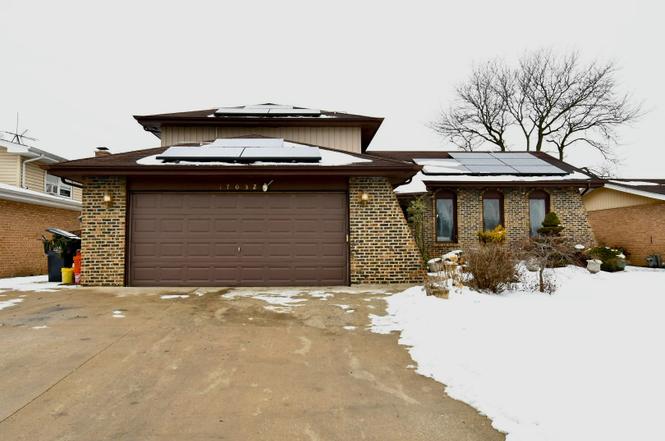
17032 Cregier Ave · South Holland, IL
Flood risk 1/10 · Minimal
- FEMA flood zone
- X (shaded)
- Chance of flooding over 30 yrs
- 0.0%
- Est. flood insurance / yr
- $473 – $860
Fire risk 1/10 · Minimal
- Est. fire insurance / yr
- $804 – $1,492
Heat risk 3/10 · Minor
- Hot days now (above 103°F)
- 7 days/yr
- Hot days in 30 yrs
- 15 days/yr
Wind risk 2/10 · Minimal
- Chance of severe wind over 30 yrs
- —
Air-quality risk 4/10 · Minor
- Unhealthy air days now
- 4 days/yr
- Unhealthy air days in 30 yrs
- 5 days/yr
Risk factors via First Street. Map © Google.
Why this score? — see what drove the B grade
The composite is a weighted blend of 9 inputs, each scored 0–100. Each bar is that input's sub-score; the figure is the points it added to the 100-point composite (weight × sub-score).
- Cash flow +30.0/30.0
- ARV discount +15.0/15.0
- 1% rule +10.0/10.0
- DSCR +10.0/10.0
- Livability +3.9/5.0
- Rent growth +2.5/5.0
- Condition / age +2.5/5.0
- Schools +0.7/10.0
- Appreciation +0.0/10.0
$140,000
🖨 Deal sheet 📄 Offer letter ✓ Due diligence
Listing remarks
This 4 bedroom, 2 bathroom quad-level home offers great potential for buyers ready to add their personal touch. Featuring hardwood floors throughout, a cozy fireplace, and a fully fenced yard, this property provides a solid layout with room to grow. The home is being sold as-is and will require updates and repairs, making it a great opportunity for investors, rehabbers, or homeowners looking to build instant equity. With multiple living levels, generous room sizes, and a desirable floor plan, this property has strong upside potential in the right hands. Bring your vision and make this home shine!
Key facts
- Generous room sizes
- Cozy fireplace
- Desirable floor plan
Tags
Neighborhood map
What this means for you Summary
Snapshot
- This is a 3-bed/1.0-bath single-family listed at $140k.
Deal economics
- At list price, monthly cash flow is $1k ($14k/yr) — positive.
- The deal already cash-flows at list — no discount required.
- Meets the 1% rule at list price ($3k rent vs $140k).
- Recommended offer: $136k (3.0% below list) — sets the bar for market timing.
- Cap rate 16.2% vs local median 8.4% in South Holland — top-decile yield for the area; either an underpriced asset or a hidden risk that comps aren't pricing in. Stress-test before assuming the spread holds.
Location & tenants
- Location reads 77/100 on livability (#167 in IL, #3,071 nationally) — a middle-class / working-renter tenant base. Strengths: commute A+, housing A+, cost of living A; Watch: crime C-, amenities C-, schools D+.
- Thornton Twp Hsd 205 (suburban): math 7% / reading 8% proficiency, ranked #594 of 620 in IL (top 96%) — low school quality limits family demand, transient renter base, plan for 1-2y turnover.
- Market conditions: 135 active listings in the ZIP; 3 comparable units currently listed for rent nearby; rentals leasing fast (median 7d on market — plan ~1-2 weeks tenant-placement turnaround); 6,272 units permitted in Cook County in 2024 (4,658 in 5+ unit buildings).
Forward outlook
- Local home prices are declining (-3.0%/yr); year-one equity from $968 of loan paydown is wiped out by about $4k of value loss. Plan a longer hold.
- At projected returns (-3.0% appreciation + 3.0% rent growth), your $39k cash investment doubles in ~4 years — after that, you're playing with house money.
Negotiation context
- It's been on market 35 days — a 3% lower offer ($136k) is reasonable based on typical stale-listing flexibility.
Questions for the listing agent
- It's been on market 35 days. Have you received any prior offers? Is the seller open to a 3% concession, seller financing, or rate buy-down credit?
- Built in 1971 — when were the roof, HVAC, electrical panel, plumbing, and water heater last replaced?
- Is there a deadline driving the sale (1031 exchange, divorce, estate, relocation)? That informs how much negotiation room exists.
- Schools are D-rated, which usually means shorter tenancies and higher turnover. Who's the typical renter profile here, and what's been the actual vacancy rate?
- What's the average days-on-market for RENTAL listings here right now (not sales)? A rising rental-DOM trend means longer vacancies and softer asking-rent achievability than the comps imply.
- What's the recent tenant-quality profile in this submarket — average credit score on applications, eviction rate, late-payment / NSF rate, and stable-employment percentage? A property-management company in the area should have these aggregated.
- How much new for-sale + rental construction is in the pipeline within 1–3 miles? Heavy new supply typically softens prices + rents 12–24 months out; constrained supply supports both.
Investment metrics
- 1% rule
- 1.92% ✓
- Cap rate
- 16.21%
- Cash-on-cash
- 35.43%
- DSCR
- 2.58
- GRM
- 4.3
CMA / ARV
- ARV (on-the-fly)
- $264,222
- Comps found
- 12
Show comp detail 12 sales within ~0.75 mi
| Address | Dist | Beds/Ba | Sqft | Sold | Price | $/sf | Match |
|---|---|---|---|---|---|---|---|
| 16916 Kimbark Ave | 0.39mi | 4/2.0 (+1) | 1,397 (-0%) | 0mo | $283,000 | $203 | 72 |
| 17104 Kenwood Ave | 0.33mi | 3/2.0 | 1,433 (+2%) | 12mo | $290,000 | $202 | 67 |
| 1241 E 168th St | 0.44mi | 3/3.0 | 1,331 (-5%) | 2mo | $230,000 | $173 | 62 |
| 17125 Cregier Ave | 0.10mi | 4/2.5 (+1) | 1,580 (+13%) | 4mo | $299,000 | $189 | 60 |
| 17032 University Ave | 0.53mi | 3/2.0 | 1,500 (+7%) | 2mo | $242,000 | $161 | 58 |
| 1863 E 172nd St | 0.48mi | 3/2.5 | 1,519 (+9%) | 3mo | $260,850 | $172 | 55 |
| 1970 E 170th St | 0.55mi | 3/1.0 | 1,280 (-8%) | 7mo | $164,700 | $129 | 54 |
| 1103 E 166th Pl | 0.73mi | 3/2.0 | 1,348 (-4%) | 2mo | $210,000 | $156 | 54 |
| 17063 Kimbark Ave | 0.35mi | 3/2.0 | 1,200 (-14%) | 8mo | $225,000 | $188 | 50 |
| 1038 E 167th Pl | 0.73mi | 4/2.5 (+1) | 1,428 (+2%) | 5mo | $339,000 | $237 | 47 |
| 1014 E 171st Pl | 0.66mi | 4/2.0 (+1) | 1,348 (-4%) | 10mo | $340,000 | $252 | 46 |
| 16710 Prince Dr | 0.48mi | 3/2.0 | 1,230 (-12%) | 14mo | $235,000 | $191 | 42 |
Match score weights: distance 35% · size 25% · config 20% · recency 20%. Top-matched comps best support the ARV.
Projected returns pro-forma
-3.0% appreciation · 3.0% rent growth · sell at horizon
- IRR
- 31.1%
- Equity multiple
- 2.30×
- Total profit
- $51,075
- Equity at exit
- $20,874
- IRR
- 38.2%
- Equity multiple
- 4.56×
- Total profit
- $139,566
- Equity at exit
- $12,105
Cash invested: $39,200 (down + closing). Projections, not guarantees.
Landlord ↔ Tenant lean methodology
- Overall (STATE)
- 43 Moderately Tenant-Leaning
- State Illinois
- 43 Moderately Tenant-Leaning · D+7
- County
- — inherits STATE
- City
- — inherits STATE
ZIP-level market 60473
- Active inventory
- 135
- Price-to-rent
- 4.3×
Monthly cashflow live
- Estimated rent
- $2,690 medium interval (Pro) →
- Mortgage (P&I)
- −$734
- Tax est. 1.5%
- −$175 /mo · $2,100/yr
- Insurance
- −$58
- HOA
- −$0
- Vacancy / Maint / Mgmt
- −$565
- Net cashflow
- $1,157
Break-even live
UW: 25.0% down · 7.5% · 30yr · 1.5% tax · 5.0% vac · 8.0% maint · 8.0% mgmt
Financing live
Cash to close
- Down payment
- $35,000
- Closing costs
- $4,200
- Reserves months
- —
- Total cash needed
- —
Loan-product check · same deal, 3 products live
Conventional
25% down · 7.5% · 30yr
- Down + closing
- —
- Monthly P&I
- —
- Monthly cashflow
- —
- DSCR
- —
- Eligible?
- —
Personal DTI + credit; lowest rate.
DSCR
20% down · 8.5% · 30yr
- Down + closing
- —
- Monthly P&I
- —
- Monthly cashflow
- —
- DSCR
- —
- Eligible?
- —
No personal income docs; deal must DSCR.
Hard money
10% down · 12.0% · 12mo
- Down + closing
- —
- Monthly P&I
- —
- Monthly cashflow
- —
- DSCR
- —
- Eligible?
- —
Short-term bridge; refi at stabilization.
Rent comps 3 comps
| Address | Beds | Baths | Sqft | Rent | $/sqft | DOM | Units | Dist |
|---|---|---|---|---|---|---|---|---|
| 17640 Rosewood Dr Unit 2A Lansing, IL | 2.0 | 1.0 | 950 | $1,475 | $1.55 | 17d | 1 | 1.07mi |
| 16246 Dobson Ave South Holland, IL | 3.0 | 2.0 | 1250 | $3,170 | $2.54 | 2d | 1 | 1.14mi |
| 16001 Avalon Ave South Holland, IL | 3.0 | 2.0 | 1136 | $3,330 | $2.93 | 6d | 1 | 1.33mi |
Listing history 3 events
-
2026-03-12status Pending
-
2026-03-07price $140,000
-
2026-02-05$230,000 Active
ⓘ Source: listings_history table (triggers on properties + properties_extension) + one-shot
backfill from property_details.listing_events for pre-trigger history.
Climate risk First Street
- Flood 1/10 Low FEMA zone X (shaded) · 0% chance over 30 yrs
- Wildfire 1/10 Low
- Heat 3/10 Moderate 7 d/yr ≥103°F today · 15 d/yr by 30 yrs out
- Wind 2/10 Low
- Air quality 4/10 Moderate 4 unhealthy d/yr today · 5 by 30 yrs out
Nearby sold comps map
Loading sold comps map…
Walkable amenities ~0.75 mi
Loading nearby amenities…
Taxation est. · year 1
- Rental income
- $32,278
- − Mortgage interest
- −$7,842
- − Property taxes
- −$2,100
- − Insurance
- −$700
- − Repairs & maintenance
- −$2,582
- − Management
- −$2,582
- − Depreciation
- −$4,073
- Taxable income
- $12,399
- Est. tax owed @ 24.0%
- −$2,976
- After-tax cash flow
- $10,914/yr
For passive investors: Depreciation is non-cash, so a rental often shows a tax loss while cash-flowing — sheltering income. Rental losses are passive: they offset passive income freely, and up to $25,000/yr can offset ordinary (W-2) income if you actively participate and your MAGI is under $100k (phasing out to $0 by $150k); unused losses carry forward. On sale, claimed depreciation is recaptured at up to 25%, and gains may owe capital-gains tax (a 1031 exchange can defer both). Figures are a year-1 estimate at your 24.0% rate — not tax advice; consult a CPA.
Schools (NCES district)
- District
- Thornton Twp Hsd 205
- NCES district ID
- 1738970
- Math proficiency
- 7% ▬ 0.00%
- Reading proficiency
- 8% ▼ -2.00%
- Median HH income
- $43,392
- Composite
- 6.92/100
- National rank
- #9976
- State rank
- #594 of 620 in IL
Livability — South Holland
- Score
- 77/100
- State rank
- #167
- US rank
- #3071
Category grades
Schools grade is shown separately in the Schools card above.
Census & demographics
- Census place
- South Holland, IL
- City population
- 21,407
- Population (ZIP)
- 21,407
Population outlook (Cook County) Hauer SSP2
- Today (2025)
- 5,347,519 people
- By 2030
- 5,357,703 · +0.2%
- By 2040
- 5,324,924 · -0.4%
- By 2050
- 5,230,762 · -2.2%
- By 2075
- 4,785,735 · -10.5%
- By 2100
- 4,188,836 · -21.7%
Race, ethnicity, and origin ACS 2023
- Neighborhood character
- Predominantly Black (75%)
- Race & ethnicity
- Black 75% White 10% Hispanic / Latino 10% Two or more races 3% Asian 1%
- Hispanic origin (detail)
- Mexican 9% Puerto Rican 1%
- Common ancestry
- Iranian 3% Romanian 2%
- Foreign-born
- 6% · Canada, China
- Languages at home
- 87% English-only · Spanish 8% Other Asian/Pacific 1% Russian/Polish/Slavic 1%
Political lean MEDSL · Cook
- 2024 margin
- Solid D (+42.0) · D 70.4% · R 28.4% · Other 1.2%
- 2008→2024 swing
- -11.4pp toward R · 2008: 53.4pp · 2024: 42.0pp
- All cycles
- 2024: D+42.0 2020: D+50.3 2016: D+53.0 2012: D+49.4 2008: D+53.4
Not yet ingested
- Civics
- —
Market trends
- HPI YoY
- ▼ -114.36%
- Current HPI
- 201.2479
- Rent YoY
- —
- Metro
- —
- State GDP YoY
- ▲ 1.59%
- F500 in state
- 60
Industry mix (Fortune 500 HQ in IL)
| Industry | F500 HQs | Revenue |
|---|---|---|
| Insurance | 4 | $201B |
|
||
| Consumer Goods | 4 | $87B |
|
||
| Industrial Machinery | 3 | $64B |
|
||
| Healthcare | 2 | $55B |
|
||
| Retail / Pharmacy | 1 | $148B |
|
||
| Agriculture / Food | 1 | $86B |
|
||
Price history
-39.1% since first listed3 events — show timeline
- 2026-03-12 Pending — MRED as Distributed by MLS Grid
- 2026-03-07 Price Changed $140,000 MRED as Distributed by MLS Grid
- 2026-02-05 Listed $230,000 MRED as Distributed by MLS Grid
Property tax history
+4.5%/yrLatest (2023): $8,131 · +25.6% YoY. Source: county tax records.
Cash-flow waterfall
monthlySold comps — $/sqft
last 12 mo · ≤1 miLoading sold comps…