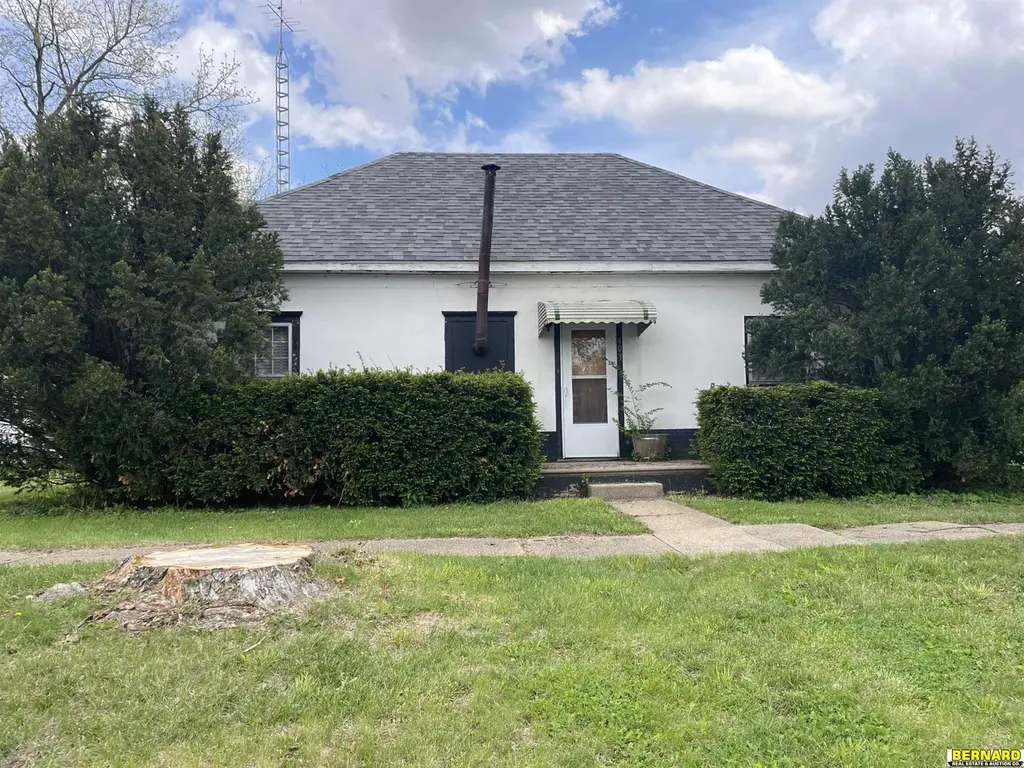
403 Carol St · Talmage, NE
Flood risk 1/10 · Minimal
- FEMA flood zone
- X (unshaded)
- Chance of flooding over 30 yrs
- 0.0%
- Est. flood insurance / yr
- $507 – $1,088
Fire risk 1/10 · Minimal
- Est. fire insurance / yr
- $1,161 – $2,155
Heat risk 3/10 · Minor
- Hot days now (above 107°F)
- 7 days/yr
- Hot days in 30 yrs
- 15 days/yr
Wind risk 2/10 · Minimal
- Chance of severe wind over 30 yrs
- —
Air-quality risk 1/10 · Minimal
- Unhealthy air days now
- 0 days/yr
- Unhealthy air days in 30 yrs
- 0 days/yr
Risk factors via First Street. Map © Google.
Why this score? — see what drove the A- grade
The composite is a weighted blend of 9 inputs, each scored 0–100. Each bar is that input's sub-score; the figure is the points it added to the 100-point composite (weight × sub-score).
- Cash flow +30.0/30.0
- ARV discount +14.6/15.0
- 1% rule +10.0/10.0
- DSCR +10.0/10.0
- Appreciation +5.0/10.0
- Schools +4.0/10.0
- Livability +3.0/5.0
- Rent growth +2.5/5.0
- Condition / age +2.5/5.0
$69,900
🖨 Deal sheet 📄 Offer letter ✓ Due diligence
Listing remarks
Step into a quaint, single-story with a warm, inviting exterior and a layout designed for easy living. This home offers two bedrooms and a full bathroom, with a compact yet functional 842 sq. ft. of living space. The open-plan living area flows seamlessly into the kitchen and bedrooms creating a cozy environment for everyday life. A deck, nice sized back yard and 1 car detached garage complete this cozy home.
Key facts
- 8,712 sq ft lot
- Garage
- Built 1890
Property features AI
Exterior
- Parking: Detached garage (1 covered space, total parking for 1 vehicle)
- Utilities: Public sewer
- Home design: Single-family residence (residential); Not new (built 1890); One or more main-floor living areas
- Construction: Block foundation; Built in 1890
- Exterior features: Deck; Lot approximately 0.2 acre (66 x 107) — up to 1/4 acre
Interior
- Bedrooms: Master bedroom on main floor; Second bedroom on main floor
- Bathrooms: 1 full bathroom on main level
- Heating & cooling: Electric and baseboard heating with wood assist; Window air conditioning unit(s)
- Interior features: Fireplace (1) - wood burning with wood assist
Neighborhood map
What this means for you Summary
Snapshot
- This is a 2-bed/1.0-bath single-family listed at $70k.
Deal economics
- At list price, monthly cash flow is $468 ($6k/yr) — positive.
- The deal already cash-flows at list — no discount required.
- Meets the 1% rule at list price ($1k rent vs $70k).
- Recommended offer: $68k (3.0% below list) — sets the bar for market timing.
Location & tenants
- Location reads 60/100 on livability (#473 in NE) — a middle-class / working-renter tenant base. Strengths: cost of living A+, housing A+; Watch: health & safety C-, crime D+, amenities F.
- Johnson County Central Public Schools (rural): math 47% / reading 48% proficiency, ranked #73 of 111 in NE (top 66%) — families likely to look elsewhere, expect single-tenant / working-renter base with shorter leases.
- Zoned schools: Johnson Co Central Elem-Cook (math 52% / reading 57%, grade C, #161 of 502 statewide, top 38%, 79 students, 40% FRL); Johnson Co Central Middle Sch (math 42% / reading 42%, grade D-, #72 of 128 statewide, top 61%, 119 students, 44% FRL); Johnson Co Central High School (math 24% / reading 44%, grade F, #208 of 261 statewide, top 86%, 153 students, 47% FRL) — zoned schools at 44% FRL track the district average.
- Market conditions: 1 active listings in the ZIP; 29 units permitted in Otoe County in 2024 (0 in 5+ unit buildings).
Forward outlook
- In year one you build about $3k of equity ($483 loan paydown + $2k appreciation (3.0% local appreciation)).
- Otoe County population projected at +4% by 2050 — modest demand growth; plan on rents tracking national, not racing it.
- At projected returns (3.0% appreciation + 3.0% rent growth), your $20k cash investment doubles in ~3 years — after that, you're playing with house money.
Negotiation context
- It's been on market 45 days — a 3% lower offer ($68k) is reasonable based on typical stale-listing flexibility.
- Current owner paid $18k; list at $70k implies a 288% gain — meaningful room to come down on a strong offer.
Risks & watch-outs
- Watch-outs: built in 1890 — expect roof / HVAC / electrical / plumbing capex.
Questions for the listing agent
- It's been on market 45 days. Have you received any prior offers? Is the seller open to a 3% concession, seller financing, or rate buy-down credit?
- Built in 1890 — when were the roof, HVAC, electrical panel, plumbing, and water heater last replaced?
- Is there a deadline driving the sale (1031 exchange, divorce, estate, relocation)? That informs how much negotiation room exists.
- Schools are F-rated, which usually means shorter tenancies and higher turnover. Who's the typical renter profile here, and what's been the actual vacancy rate?
- Crime grade is D in this area — have there been break-ins, vandalism, or insurance claims at this property in the last 3 years? What carrier currently insures it and at what premium?
- What's the average days-on-market for RENTAL listings here right now (not sales)? A rising rental-DOM trend means longer vacancies and softer asking-rent achievability than the comps imply.
- What's the recent tenant-quality profile in this submarket — average credit score on applications, eviction rate, late-payment / NSF rate, and stable-employment percentage? A property-management company in the area should have these aggregated.
- How much new for-sale + rental construction is in the pipeline within 1–3 miles? Heavy new supply typically softens prices + rents 12–24 months out; constrained supply supports both.
Investment metrics
- 1% rule
- 1.63% ✓
- Cap rate
- 14.32%
- Cash-on-cash
- 28.68%
- DSCR
- 2.28
- GRM
- 5.1
CMA / ARV
- ARV (median comp)
- $82,939
- List price
- $69,900
- Delta
- -15.72%
- Verdict
- UNDERPRICED
- Comps
- 4 within 1.0 mi
Show comp detail 2 sales within ~0.75 mi
| Address | Dist | Beds/Ba | Sqft | Sold | Price | $/sf | Match |
|---|---|---|---|---|---|---|---|
| 104 Clark St | 0.24mi | 2/2.0 | 772 (-8%) | 10mo | $100,000 | $130 | 62 |
| 201 5th St | 0.18mi | 2/2.0 | 896 (+6%) | 22mo | $120,000 | $134 | 58 |
Match score weights: distance 35% · size 25% · config 20% · recency 20%. Top-matched comps best support the ARV.
Projected returns pro-forma
3.0% appreciation · 3.0% rent growth · sell at horizon
- IRR
- 34.6%
- Equity multiple
- 2.95×
- Total profit
- $38,200
- Equity at exit
- $31,430
- IRR
- 34.7%
- Equity multiple
- 5.81×
- Total profit
- $94,221
- Equity at exit
- $48,437
Cash invested: $19,572 (down + closing). Projections, not guarantees.
Landlord ↔ Tenant lean methodology
- Overall (STATE)
- 83 Strongly Landlord-Friendly
- State Nebraska
- 83 Strongly Landlord-Friendly · R+13
- County
- — inherits STATE
- City
- — inherits STATE
ZIP-level market 68448-0083
- Active inventory
- 1
- Price-to-rent
- 5.1×
Monthly cashflow live
- Estimated rent
- $1,136 medium interval (Pro) →
- Mortgage (P&I)
- −$367
- Tax from tax record
- −$34 /mo · $412/yr
- Insurance
- −$29
- HOA
- −$0
- Vacancy / Maint / Mgmt
- −$239
- Net cashflow
- $468
Break-even live
UW: 25.0% down · 7.5% · 30yr · 1.5% tax · 5.0% vac · 8.0% maint · 8.0% mgmt
Financing live
Cash to close
- Down payment
- $17,475
- Closing costs
- $2,097
- Reserves months
- —
- Total cash needed
- —
Loan-product check · same deal, 3 products live
Conventional
25% down · 7.5% · 30yr
- Down + closing
- —
- Monthly P&I
- —
- Monthly cashflow
- —
- DSCR
- —
- Eligible?
- —
Personal DTI + credit; lowest rate.
DSCR
20% down · 8.5% · 30yr
- Down + closing
- —
- Monthly P&I
- —
- Monthly cashflow
- —
- DSCR
- —
- Eligible?
- —
No personal income docs; deal must DSCR.
Hard money
10% down · 12.0% · 12mo
- Down + closing
- —
- Monthly P&I
- —
- Monthly cashflow
- —
- DSCR
- —
- Eligible?
- —
Short-term bridge; refi at stabilization.
Listing history 16 events
-
2026-06-18days on market $69,900 Active 45 DOM
-
2026-06-17days on market $69,900 Active 44 DOM
-
2026-06-16days on market $69,900 Active 43 DOM
-
2026-06-15days on market $69,900 Active 42 DOM
-
2026-06-13days on market $69,900 Active 40 DOM
-
2026-06-12days on market $69,900 Active 39 DOM
-
2026-06-09days on market $69,900 Active 36 DOM
-
2026-06-08days on market $69,900 Active 35 DOM
-
2026-06-07days on market $69,900 Active 34 DOM
-
2026-06-07days on market $69,900 Active 33 DOM
-
2026-06-04days on market $69,900 Active 30 DOM
-
2026-06-02days on market $69,900 Active 29 DOM
-
2026-06-01days on market $69,900 Active 28 DOM
-
2026-05-31days on market $69,900 Active 27 DOM
-
2026-05-04$69,900 New 413-char remark
-
2002-09-23soldstatus $18,000
ⓘ Source: listings_history table (triggers on properties + properties_extension) + one-shot
backfill from property_details.listing_events for pre-trigger history.
Tax reassessment forecast NE · Resets to sale price
- Current annual tax
- $412 · $34/mo
- Projected year-2 tax
- $1,209 · $101/mo
- Expected delta
- +$797/yr (+$66/mo · 193.4%)
ⓘ Screening estimate from a state-policy table — verify with the county assessor before closing.
Climate risk First Street
- Flood 1/10 Low FEMA zone X (unshaded) · 0% chance over 30 yrs
- Wildfire 1/10 Low
- Heat 3/10 Moderate 7 d/yr ≥107°F today · 15 d/yr by 30 yrs out
- Wind 2/10 Low
- Air quality 1/10 Low 0 unhealthy d/yr today · 0 by 30 yrs out
Nearby sold comps map
Loading sold comps map…
Walkable amenities ~0.75 mi
Loading nearby amenities…
Taxation est. · year 1
- Rental income
- $13,638
- − Mortgage interest
- −$3,915
- − Property taxes
- −$412
- − Insurance
- −$350
- − Repairs & maintenance
- −$1,091
- − Management
- −$1,091
- − Depreciation
- −$2,033
- Taxable income
- $4,745
- Est. tax owed @ 24.0%
- −$1,139
- After-tax cash flow
- $4,475/yr
For passive investors: Depreciation is non-cash, so a rental often shows a tax loss while cash-flowing — sheltering income. Rental losses are passive: they offset passive income freely, and up to $25,000/yr can offset ordinary (W-2) income if you actively participate and your MAGI is under $100k (phasing out to $0 by $150k); unused losses carry forward. On sale, claimed depreciation is recaptured at up to 25%, and gains may owe capital-gains tax (a 1031 exchange can defer both). Figures are a year-1 estimate at your 24.0% rate — not tax advice; consult a CPA.
Schools (NCES district)
- District
- Johnson County Central Public Schools
- NCES district ID
- 3100176
- Math proficiency
- 47% ▲ 3.00%
- Reading proficiency
- 48% ▲ 1.00%
- Median HH income
- $44,058
- Composite
- 40.15/100
- National rank
- #3795
- State rank
- #73 of 111 in NE
Livability — Talmage
- Score
- 60/100
- State rank
- #473
- US rank
- #19050
Category grades
Schools grade is shown separately in the Schools card above.
Census & demographics
- Census place
- Talmage, NE
Population outlook (Otoe County) Hauer SSP2
- Today (2025)
- 16,475 people
- By 2030
- 16,627 · +0.9%
- By 2040
- 16,911 · +2.6%
- By 2050
- 17,186 · +4.3%
- By 2075
- 18,549 · +12.6%
- By 2100
- 19,590 · +18.9%
Not yet ingested
- Political lean
- —
- Race & ethnicity
- —
- Common origin
- —
- Civics
- —
Market trends
- HPI YoY
- —
- Current HPI
- —
- Rent YoY
- —
- Metro
- —
- State GDP YoY
- ▲ 0.68%
- F500 in state
- 2
Industry mix (Fortune 500 HQ in NE)
| Industry | F500 HQs | Revenue |
|---|---|---|
| Conglomerate | 1 | $371B |
|
||
Price history
+288.3% since first listed2 events — show timeline
- 2026-05-04 Listed $69,900 GPRMLS
- 2002-09-23 Sold (Public Records) $18,000 Public Records
Property tax history
+0.6%/yrLatest (2025): $412 · +3.3% YoY. Source: county tax records.
Cash-flow waterfall
monthlySold comps — $/sqft
last 12 mo · ≤1 miLoading sold comps…