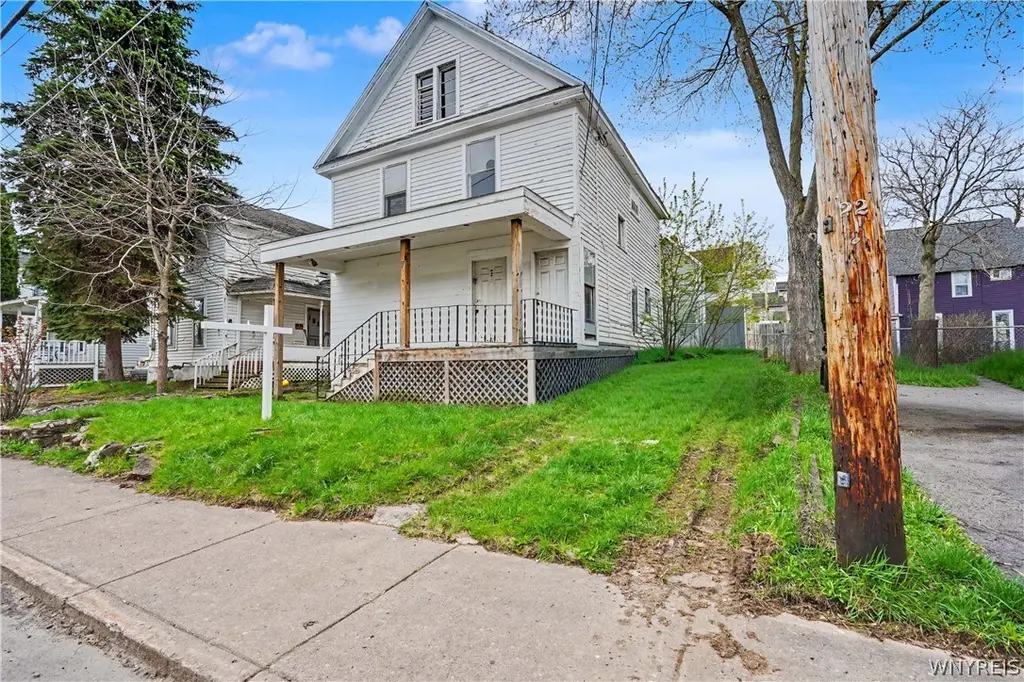
7 Elmwood Ave · Lockport, NY
Flood risk 1/10 · Minimal
- FEMA flood zone
- X (unshaded)
- Chance of flooding over 30 yrs
- 0.0%
- Est. flood insurance / yr
- $473 – $860
Fire risk 2/10 · Minimal
- Est. fire insurance / yr
- $691 – $1,283
Heat risk 2/10 · Minimal
- Hot days now (above 95°F)
- 7 days/yr
- Hot days in 30 yrs
- 15 days/yr
Wind risk 1/10 · Minimal
- Chance of severe wind over 30 yrs
- —
Air-quality risk 2/10 · Minimal
- Unhealthy air days now
- 1 days/yr
- Unhealthy air days in 30 yrs
- 2 days/yr
Risk factors via First Street. Map © Google.
Why this score? — see what drove the B grade
The composite is a weighted blend of 9 inputs, each scored 0–100. Each bar is that input's sub-score; the figure is the points it added to the 100-point composite (weight × sub-score).
- Cash flow +30.0/30.0
- 1% rule +10.0/10.0
- DSCR +10.0/10.0
- ARV discount +7.5/15.0
- Schools +3.9/10.0
- Livability +3.8/5.0
- Rent growth +3.4/5.0
- Condition / age +2.5/5.0
- Appreciation +0.0/10.0
$39,900
🖨 Deal sheet 📄 Offer letter ✓ Due diligence
Listing remarks
Opportunity!! Double or Single Family – Fully Gutted & Ready for Rehab! This 1,750 sq ft property has been completely gutted and taken down to the studs, offering a true blank slate for your vision. The hard work has already been done—making it simple to move forward with all new electrical, plumbing, heating, insulation, drywall, and finishes. Currently zoned single-family but previously set up as a two-family layout (upper/lower), offering potential for conversion with proper approvals. Can also be redesigned as a 4-bedroom, 2-bath single-family home. Full basement provides additional usable space and storage. Upper level/attic allows flexibility for office, rec room, o
Key facts
- 1,742 sq ft lot
- Built 1878
- Listed 22 days
Property features AI
Exterior
- Parking: No garage; No driveway
- Utilities: Public water connected; Sewer connected
- Home design: Two-story home; Resale property; Asphalt roof; Wood siding exterior
- Construction: Stone foundation
- Exterior features: Near public transit; Rectangular residential lot; City street frontage
Interior
- Kitchen: Eat-in kitchen; Kitchen (approx. 20 x 12)
- Bedrooms: Two bedrooms total; One bedroom on the main level; Second-floor bedroom (approx. 14 x 14); Second-floor bedroom (approx. 13 x 10); First-floor bedroom (approx. 11 x 9)
- Flooring: Hardwood flooring; Varied flooring
- Bathrooms: Two full bathrooms; One full bathroom on the main level
- Heating & cooling: Gas forced-air heating
- Interior features: Eat-in kitchen; Bedroom on main level; Full basement
- Laundry & utility: Gas water heater
Neighborhood map
What this means for you Summary
Snapshot
- This is a 2-bed/2.0-bath single-family listed at $40k.
Deal economics
- At list price, monthly cash flow is $668 ($8k/yr) — positive.
- The deal already cash-flows at list — no discount required.
- Meets the 1% rule at list price ($1k rent vs $40k).
- Recommended offer: $39k (1.5% below list) — sets the bar for market timing.
- Cap rate 26.4% vs local median 4.5% in Lockport — top-decile yield for the area; either an underpriced asset or a hidden risk that comps aren't pricing in. Stress-test before assuming the spread holds.
Location & tenants
- Location reads 76/100 on livability (#232 in NY, #3,669 nationally) — a middle-class / working-renter tenant base. Strengths: amenities A+, cost of living A+, housing A+; Watch: commute D+, crime F, employment D-.
- Lockport City School District (town): math 44% / reading 49% proficiency, ranked #452 of 590 in NY (top 77%) — families likely to look elsewhere, expect single-tenant / working-renter base with shorter leases.
- Market conditions: Rents rising (+3.7%/yr); 357 active listings in the ZIP; solid renter incomes; 167 units permitted in Niagara County in 2024 (0 in 5+ unit buildings).
Forward outlook
- Local home prices are declining (-3.0%/yr); year-one equity from $276 of loan paydown is wiped out by about $1k of value loss. Plan a longer hold.
- Niagara County population projected at -19% by 2050 — secular population decline; favor cash flow + early exit over multi-decade hold.
- At projected returns (-3.0% appreciation + 3.7% rent growth), your $11k cash investment doubles in ~2 years — after that, you're playing with house money.
Negotiation context
- It's been on market 22 days — a 2% lower offer ($39k) is reasonable based on typical stale-listing flexibility.
- 2 sale attempts since 7y ago; this cycle's ask has dropped $10k (20%) from the opening price — seller is motivated, your offer sets the floor, not the list.
- Current owner paid $9k; list at $40k implies a 359% gain — meaningful room to come down on a strong offer.
Risks & watch-outs
- Watch-outs: property tax is 3.7% of price; built in 1878 — expect roof / HVAC / electrical / plumbing capex.
Questions for the listing agent
- Built in 1878 — when were the roof, HVAC, electrical panel, plumbing, and water heater last replaced?
- Property tax is high relative to price — has the assessment been appealed recently, and will the sale trigger a re-assessment?
- Is there a deadline driving the sale (1031 exchange, divorce, estate, relocation)? That informs how much negotiation room exists.
- Schools are B-rated — typically a magnet for longer-tenancy family renters. What's the average tenant stay here, and is there a school-zone premium baked into asking?
- Crime grade is F in this area — have there been break-ins, vandalism, or insurance claims at this property in the last 3 years? What carrier currently insures it and at what premium?
- What's the average days-on-market for RENTAL listings here right now (not sales)? A rising rental-DOM trend means longer vacancies and softer asking-rent achievability than the comps imply.
- What's the recent tenant-quality profile in this submarket — average credit score on applications, eviction rate, late-payment / NSF rate, and stable-employment percentage? A property-management company in the area should have these aggregated.
- How much new for-sale + rental construction is in the pipeline within 1–3 miles? Heavy new supply typically softens prices + rents 12–24 months out; constrained supply supports both.
Investment metrics
- 1% rule
- 3.23% ✓
- Cap rate
- 26.38%
- Cash-on-cash
- 71.76%
- DSCR
- 4.19
- GRM
- 2.6
CMA / ARV
- ARV (on-the-fly)
- $225,750
- Comps found
- 12
Show comp detail 12 sales within ~0.75 mi
| Address | Dist | Beds/Ba | Sqft | Sold | Price | $/sf | Match |
|---|---|---|---|---|---|---|---|
| 8 Blackley Ct | 0.11mi | 3/2.0 (+1) | 1,658 (-5%) | 2mo | $135,000 | $81 | 79 |
| 100 Regent St | 0.52mi | 3/2.5 (+1) | 1,795 (+3%) | 0mo | $248,000 | $138 | 64 |
| 94 Morrow Ave | 0.56mi | 3/2.0 (+1) | 1,730 (-1%) | 8mo | $275,000 | $159 | 60 |
| 603 Walnut St | 0.67mi | 3/2.0 (+1) | 1,718 (-2%) | 2mo | $225,000 | $131 | 59 |
| 60 Morrow Ave | 0.54mi | 3/1.5 (+1) | 1,848 (+6%) | 6mo | $250,000 | $135 | 53 |
| 266 Chestnut St | 0.50mi | 3/1.5 (+1) | 1,876 (+7%) | 7mo | $215,000 | $115 | 52 |
| 250 Pine St | 0.45mi | 3/1.5 (+1) | 1,956 (+12%) | 5mo | $260,000 | $133 | 48 |
| 411 Washburn St | 0.36mi | 3/1.0 (+1) | 1,488 (-15%) | 6mo | $96,000 | $65 | 44 |
| 106 Saxton St | 0.56mi | 3/1.0 (+1) | 1,560 (-11%) | 4mo | $75,000 | $48 | 44 |
| 69 Morrow Ave | 0.53mi | 3/1.0 (+1) | 1,510 (-14%) | 1mo | $195,000 | $129 | 43 |
| 17 Beattie Ave | 0.40mi | 3/1.0 (+1) | 1,506 (-14%) | 10mo | $145,000 | $96 | 41 |
| 62 Grand St | 0.56mi | 3/1.0 (+1) | 1,505 (-14%) | 4mo | $45,000 | $30 | 39 |
Match score weights: distance 35% · size 25% · config 20% · recency 20%. Top-matched comps best support the ARV.
Projected returns pro-forma
-3.0% appreciation · 3.67% rent growth · sell at horizon
- IRR
- 72.3%
- Equity multiple
- 4.31×
- Total profit
- $37,022
- Equity at exit
- $5,949
- IRR
- 76.4%
- Equity multiple
- 9.14×
- Total profit
- $90,926
- Equity at exit
- $3,450
Cash invested: $11,172 (down + closing). Projections, not guarantees.
Landlord ↔ Tenant lean methodology
- Overall (STATE)
- 15 Strongly Tenant-Friendly
- State New York
- 15 Strongly Tenant-Friendly · D+10
- County
- — inherits STATE
- City
- — inherits STATE
ZIP-level market 14094
- Rents YoY
- 3.7%
- Active inventory
- 357
- Price-to-rent
- 2.6×
Monthly cashflow live
- Estimated rent
- $1,288 medium interval (Pro) →
- Mortgage (P&I)
- −$209
- Tax from tax record
- −$124 /mo · $1,487/yr
- Insurance
- −$17
- HOA
- −$0
- Vacancy / Maint / Mgmt
- −$271
- Net cashflow
- $668
Break-even live
UW: 25.0% down · 7.5% · 30yr · 1.5% tax · 5.0% vac · 8.0% maint · 8.0% mgmt
Financing live
Cash to close
- Down payment
- $9,975
- Closing costs
- $1,197
- Reserves months
- —
- Total cash needed
- —
Loan-product check · same deal, 3 products live
Conventional
25% down · 7.5% · 30yr
- Down + closing
- —
- Monthly P&I
- —
- Monthly cashflow
- —
- DSCR
- —
- Eligible?
- —
Personal DTI + credit; lowest rate.
DSCR
20% down · 8.5% · 30yr
- Down + closing
- —
- Monthly P&I
- —
- Monthly cashflow
- —
- DSCR
- —
- Eligible?
- —
No personal income docs; deal must DSCR.
Hard money
10% down · 12.0% · 12mo
- Down + closing
- —
- Monthly P&I
- —
- Monthly cashflow
- —
- DSCR
- —
- Eligible?
- —
Short-term bridge; refi at stabilization.
Listing history 7 events
-
2026-05-18status Pending
-
2026-05-03price $39,900
-
2026-04-25$49,900 Active
-
2020-04-15historical
-
2019-12-31price $25,000
-
2019-10-30$30,000 Active
-
2006-11-28soldstatus $8,700
ⓘ Source: listings_history table (triggers on properties + properties_extension) + one-shot
backfill from property_details.listing_events for pre-trigger history.
Tax reassessment forecast NY · Partial reset (capped growth)
- Current annual tax
- $1,487 · $124/mo
- Projected year-2 tax
- $1,487 · $124/mo
- Expected delta
- $0/yr ($0/mo · 0.0%)
ⓘ Screening estimate from a state-policy table — verify with the county assessor before closing.
Climate risk First Street
- Flood 1/10 Low FEMA zone X (unshaded) · 0% chance over 30 yrs
- Wildfire 2/10 Low
- Heat 2/10 Low 7 d/yr ≥95°F today · 15 d/yr by 30 yrs out
- Wind 1/10 Low
- Air quality 2/10 Low 1 unhealthy d/yr today · 2 by 30 yrs out
Nearby sold comps map
Loading sold comps map…
Walkable amenities ~0.75 mi
Loading nearby amenities…
Taxation est. · year 1
- Rental income
- $15,461
- − Mortgage interest
- −$2,235
- − Property taxes
- −$1,487
- − Insurance
- −$200
- − Repairs & maintenance
- −$1,237
- − Management
- −$1,237
- − Depreciation
- −$1,161
- Taxable income
- $7,905
- Est. tax owed @ 24.0%
- −$1,897
- After-tax cash flow
- $6,119/yr
For passive investors: Depreciation is non-cash, so a rental often shows a tax loss while cash-flowing — sheltering income. Rental losses are passive: they offset passive income freely, and up to $25,000/yr can offset ordinary (W-2) income if you actively participate and your MAGI is under $100k (phasing out to $0 by $150k); unused losses carry forward. On sale, claimed depreciation is recaptured at up to 25%, and gains may owe capital-gains tax (a 1031 exchange can defer both). Figures are a year-1 estimate at your 24.0% rate — not tax advice; consult a CPA.
Schools (NCES district)
- District
- Lockport City School District
- NCES district ID
- 3617670
- Math proficiency
- 44% ▼ -7.00%
- Reading proficiency
- 49% ▲ 3.00%
- Median HH income
- $43,793
- Composite
- 39.28/100
- National rank
- #3997
- State rank
- #452 of 590 in NY
Livability — Lockport
- Score
- 76/100
- State rank
- #232
- US rank
- #3669
Category grades
Schools grade is shown separately in the Schools card above.
Census & demographics
- Census place
- Lockport, NY
- County
- Niagara County · 157,377 people
- City population
- 50,153
- Metro
- Buffalo-Cheektowaga, NY
- Population (ZIP)
- 50,153
- Household income
- $75,427
- Rent vs Own
- Severe rent burden
- 1112.0
Population outlook (Niagara County) Hauer SSP2
- Today (2025)
- 204,149 people
- By 2030
- 197,900 · -3.1%
- By 2040
- 182,239 · -10.7%
- By 2050
- 165,198 · -19.1%
- By 2075
- 129,416 · -36.6%
- By 2100
- 96,222 · -52.9%
Race, ethnicity, and origin ACS 2023
- Neighborhood character
- Predominantly White (84%)
- Race & ethnicity
- White 84% Two or more races 6% Black 6% Hispanic / Latino 3%
- Common ancestry
- Romanian 9% Slovak 2% Lithuanian 2%
- Foreign-born
- 3% · Canada
- Languages at home
- 96% English-only · Spanish 1% Russian/Polish/Slavic 1% Other Indo-European 1%
Political lean MEDSL · Niagara
- 2024 margin
- R (+14.9) · D 42.5% · R 57.5%
- 2008→2024 swing
- -15.9pp toward R · 2008: 1.0pp · 2024: -14.9pp
- All cycles
- 2024: R+14.9 2020: R+9.7 2016: R+19.0 2012: D+0.6 2008: D+1.0
Not yet ingested
- Civics
- —
Market trends
- HPI YoY
- ▼ -262.57%
- Current HPI
- 303.6109
- Rent YoY
- ▲ 3.67%
- Metro
- Buffalo-Cheektowaga, NY
- State GDP YoY
- ▲ 2.60%
- F500 in state
- 92
Industry mix (Fortune 500 HQ in NY)
| Industry | F500 HQs | Revenue |
|---|---|---|
| Financial Services | 10 | $950B |
|
||
| Consumer Goods | 9 | $162B |
|
||
| Insurance | 4 | $225B |
|
||
| Telecommunications | 2 | $144B |
|
||
| Pharmaceuticals | 2 | $112B |
|
||
| Media / Entertainment | 2 | $69B |
|
||
Price history
+358.6% since first listed7 events — show timeline
- 2026-05-18 Pending — WNYREIS
- 2026-05-03 Price Changed $39,900 WNYREIS
- 2026-04-25 Listed $49,900 WNYREIS
- 2020-04-15 Listing Removed — WNYREIS
- 2019-12-31 Price Changed $25,000 WNYREIS
- 2019-10-30 Listed $30,000 WNYREIS
- 2006-11-28 Sold (Public Records) $8,700 Public Records
Property tax history
+3.6%/yrLatest (2025): $1,487 · -46.2% YoY. Source: county tax records.
Cash-flow waterfall
monthlySold comps — $/sqft
last 12 mo · ≤1 miLoading sold comps…