1304 N Beeline Hwy #34 · Payson, AZ
Flood risk 1/10 · Minimal
- FEMA flood zone
- X (unshaded)
- Chance of flooding over 30 yrs
- 0.0%
- Est. flood insurance / yr
- $507 – $1,088
Fire risk 9/10 · Severe
- Est. fire insurance / yr
- $610 – $1,132
Heat risk 4/10 · Minor
- Hot days now (above 96°F)
- 7 days/yr
- Hot days in 30 yrs
- 16 days/yr
Wind risk 1/10 · Minimal
- Chance of severe wind over 30 yrs
- —
Air-quality risk 1/10 · Minimal
- Unhealthy air days now
- 0 days/yr
- Unhealthy air days in 30 yrs
- 0 days/yr
Risk factors via First Street. Map © Google.
Why this score? — see what drove the D grade
The composite is a weighted blend of 9 inputs, each scored 0–100. Each bar is that input's sub-score; the figure is the points it added to the 100-point composite (weight × sub-score).
- Cash flow +15.0/30.0
- ARV discount +7.5/15.0
- 1% rule +5.0/10.0
- DSCR +5.0/10.0
- Livability +3.5/5.0
- Rent growth +2.5/5.0
- Schools +2.2/10.0
- Condition / age +1.0/5.0
- Appreciation +0.0/10.0
$32,500
🖨 Deal sheet 📄 Offer letter ✓ Due diligence
Listing remarks MLS
This older manufactured home has undergone renovations and updates, making it a comfortable and move-in-ready property. Recent improvements include fresh interior and exterior paint, along with repairs that have enhanced the home's overall condition and livability. A covered front porch adds charm to the exterior and provides a welcoming space to relax and enjoy the outdoors. This property offers an affordable opportunity for homeownership with many of the major cosmetic updates already completed. All-ages mobile home park!
Key facts
- Covered front porch
- Fresh interior paint
- Fresh exterior paint
Tags
Property features AI
Finance
- Other:
- Financial info:
- HOA & community: Land lease of $535 monthly; No association fees
Exterior
- Parking:
- Security:
- Utilities: City water; Sewer connected
- Home design: Manufactured/mobile home; Leasehold ownership
- Construction: Aluminum siding; Wood frame construction; Painted exterior; Metal roof; Building area reported by owner
- Exterior features: Gravel/stone front; Fencing: Other or none
Interior
- Kitchen: Refrigerator
- Bedrooms: 2 possible bedrooms
- Flooring: Laminate flooring
- Bathrooms: 1 full bathroom
- Heating & cooling: Window/wall cooling unit; No central heating
- Interior features: High-speed internet; Eat-in kitchen; Tankless hot water heater
- Laundry & utility: No laundry hookups
Neighborhood map
What this means for you Summary
Snapshot
- This is a 2-bed/1.0-bath manufactured listed at $32k. Condition is rated poor.
Deal economics
- At list price, monthly cash flow is $989 ($12k/yr) — positive.
- The deal already cash-flows at list — no discount required.
- Meets the 1% rule at list price ($2k rent vs $32k).
- Recommended offer: $32k (1.5% below list) — sets the bar for market timing.
- Cap rate 42.8% vs local median 3.3% in Payson — top-decile yield for the area; either an underpriced asset or a hidden risk that comps aren't pricing in. Stress-test before assuming the spread holds.
Location & tenants
- Location reads 69/100 on livability (#44 in AZ) — a middle-class / working-renter tenant base. Strengths: housing A, crime B, cost of living B; Watch: amenities D-, commute F, health & safety F.
- Payson Unified District (4209) (town): math 20% / reading 32% proficiency, ranked #138 of 249 in AZ (top 55%) — low school quality limits family demand, transient renter base, plan for 1-2y turnover.
- Zoned schools: Payson Elementary School (432 students, 60% FRL); Rim Country Middle School (math 21% / reading 31%, grade F, #100 of 218 statewide, top 47%, 493 students, 53% FRL); Payson High School (math 22% / reading 32%, grade F, #141 of 381 statewide, top 38%, 790 students, 40% FRL) — zoned schools at 51% FRL track the district average.
- Market conditions: 695 active listings in the ZIP; 217 units permitted in Gila County in 2024 (0 in 5+ unit buildings).
Forward outlook
- Local home prices are declining (-3.0%/yr); year-one equity from $225 of loan paydown is wiped out by about $975 of value loss. Plan a longer hold.
- Gila County population projected at -18% by 2050 — secular population decline; favor cash flow + early exit over multi-decade hold.
- At projected returns (-3.0% appreciation + 3.0% rent growth), your $9k cash investment doubles in ~1 year — after that, you're playing with house money.
Negotiation context
- It's been on market 19 days — a 2% lower offer ($32k) is reasonable based on typical stale-listing flexibility.
- 4 sale attempts since 19y ago with the ask held roughly flat each time — persistent listings suggest the price (not the market) is what's stuck; bring a comps-based counter.
Risks & watch-outs
- Climate carrying-cost: severe wildfire risk — expect insurance premiums to compound above CPI over the hold.
Questions for the listing agent
- Have any recent inspections been done? Can we get a copy of the seller's disclosures and any deferred-maintenance estimates?
- Built in 1972 — when were the roof, HVAC, electrical panel, plumbing, and water heater last replaced?
- Is there a deadline driving the sale (1031 exchange, divorce, estate, relocation)? That informs how much negotiation room exists.
- The area grade is low — what's the realistic commute time and amenity access for the typical tenant pool here? Any planned neighborhood developments (good or bad) we should know about?
- What's the average days-on-market for RENTAL listings here right now (not sales)? A rising rental-DOM trend means longer vacancies and softer asking-rent achievability than the comps imply.
- What's the recent tenant-quality profile in this submarket — average credit score on applications, eviction rate, late-payment / NSF rate, and stable-employment percentage? A property-management company in the area should have these aggregated.
- How much new for-sale + rental construction is in the pipeline within 1–3 miles? Heavy new supply typically softens prices + rents 12–24 months out; constrained supply supports both.
Investment metrics
- 1% rule
- 4.73% ✓
- Cap rate
- 42.80%
- Cash-on-cash
- 130.38%
- DSCR
- 6.80
- GRM
- 1.8
CMA / ARV
- ARV (on-the-fly)
- $130,320
- Comps found
- 2
Show comp detail 2 sales within ~0.75 mi
| Address | Dist | Beds/Ba | Sqft | Sold | Price | $/sf | Match |
|---|---|---|---|---|---|---|---|
| 306 E Forest Dr | 0.61mi | 2/1.0 | 728 (+1%) | 16mo | $132,000 | $181 | 56 |
| 908 N William Tell Cir | 0.57mi | 2/2.0 | 652 (-9%) | 24mo | $93,500 | $143 | 34 |
Match score weights: distance 35% · size 25% · config 20% · recency 20%. Top-matched comps best support the ARV.
Projected returns pro-forma
-3.0% appreciation · 3.0% rent growth · sell at horizon
- IRR
- —
- Equity multiple
- 7.34×
- Total profit
- $57,727
- Equity at exit
- $4,846
- IRR
- —
- Equity multiple
- 15.44×
- Total profit
- $131,446
- Equity at exit
- $2,810
Cash invested: $9,100 (down + closing). Projections, not guarantees.
Landlord ↔ Tenant lean methodology
- Overall (STATE)
- 87 Strongly Landlord-Friendly
- State Arizona
- 87 Strongly Landlord-Friendly · R+3
- County
- — inherits STATE
- City
- — inherits STATE
ZIP-level market 85541
- Home prices YoY
- -6.6%
- Active inventory
- 695
- Price-to-rent
- 1.8×
Monthly cashflow live
- Estimated rent
- $1,536 medium interval (Pro) →
- Mortgage (P&I)
- −$170
- Tax est. 1.5%
- −$41 /mo · $488/yr
- Insurance
- −$14
- HOA
- −$0
- Vacancy / Maint / Mgmt
- −$323
- Net cashflow
- $989
Break-even live
UW: 25.0% down · 7.5% · 30yr · 1.5% tax · 5.0% vac · 8.0% maint · 8.0% mgmt
Financing live
Cash to close
- Down payment
- $8,125
- Closing costs
- $975
- Reserves months
- —
- Total cash needed
- —
Loan-product check · same deal, 3 products live
Conventional
25% down · 7.5% · 30yr
- Down + closing
- —
- Monthly P&I
- —
- Monthly cashflow
- —
- DSCR
- —
- Eligible?
- —
Personal DTI + credit; lowest rate.
DSCR
20% down · 8.5% · 30yr
- Down + closing
- —
- Monthly P&I
- —
- Monthly cashflow
- —
- DSCR
- —
- Eligible?
- —
No personal income docs; deal must DSCR.
Hard money
10% down · 12.0% · 12mo
- Down + closing
- —
- Monthly P&I
- —
- Monthly cashflow
- —
- DSCR
- —
- Eligible?
- —
Short-term bridge; refi at stabilization.
Listing history 15 events
-
2026-06-19days on market $32,500 Active 19 DOM
-
2026-06-18days on market $32,500 Active 18 DOM
-
2026-06-17days on market $32,500 Active 17 DOM
-
2026-06-16days on market $32,500 Active 16 DOM
-
2026-06-15days on market $32,500 Active 15 DOM
-
2026-06-14days on market $32,500 Active 13 DOM
-
2026-06-12days on market $32,500 Active 12 DOM
-
2026-06-09days on market $32,500 Active 9 DOM
-
2026-06-08days on market $32,500 Active 8 DOM
-
2026-06-07days on market $32,500 Active 7 DOM
-
2026-06-03days on market $32,500 Active 3 DOM
-
2026-06-02days on market $32,500 Active 2 DOM
-
2026-06-01pricedays on market $32,500 Active 1 DOM
-
2026-05-31days on market $139,000 Active 90 DOM
-
2026-05-31days on market $139,000 Active 89 DOM
ⓘ Source: listings_history table (triggers on properties + properties_extension) + one-shot
backfill from property_details.listing_events for pre-trigger history.
Climate risk First Street
- Flood 1/10 Low FEMA zone X (unshaded) · 0% chance over 30 yrs
- Wildfire 9/10 Extreme
- Heat 4/10 Moderate 7 d/yr ≥96°F today · 16 d/yr by 30 yrs out
- Wind 1/10 Low
- Air quality 1/10 Low 0 unhealthy d/yr today · 0 by 30 yrs out
Nearby sold comps map
Loading sold comps map…
Walkable amenities ~0.75 mi
Loading nearby amenities…
Taxation est. · year 1
- Rental income
- $18,430
- − Mortgage interest
- −$1,821
- − Property taxes
- −$488
- − Insurance
- −$162
- − Repairs & maintenance
- −$1,474
- − Management
- −$1,474
- − Depreciation
- −$945
- Taxable income
- $12,065
- Est. tax owed @ 24.0%
- −$2,896
- After-tax cash flow
- $8,969/yr
For passive investors: Depreciation is non-cash, so a rental often shows a tax loss while cash-flowing — sheltering income. Rental losses are passive: they offset passive income freely, and up to $25,000/yr can offset ordinary (W-2) income if you actively participate and your MAGI is under $100k (phasing out to $0 by $150k); unused losses carry forward. On sale, claimed depreciation is recaptured at up to 25%, and gains may owe capital-gains tax (a 1031 exchange can defer both). Figures are a year-1 estimate at your 24.0% rate — not tax advice; consult a CPA.
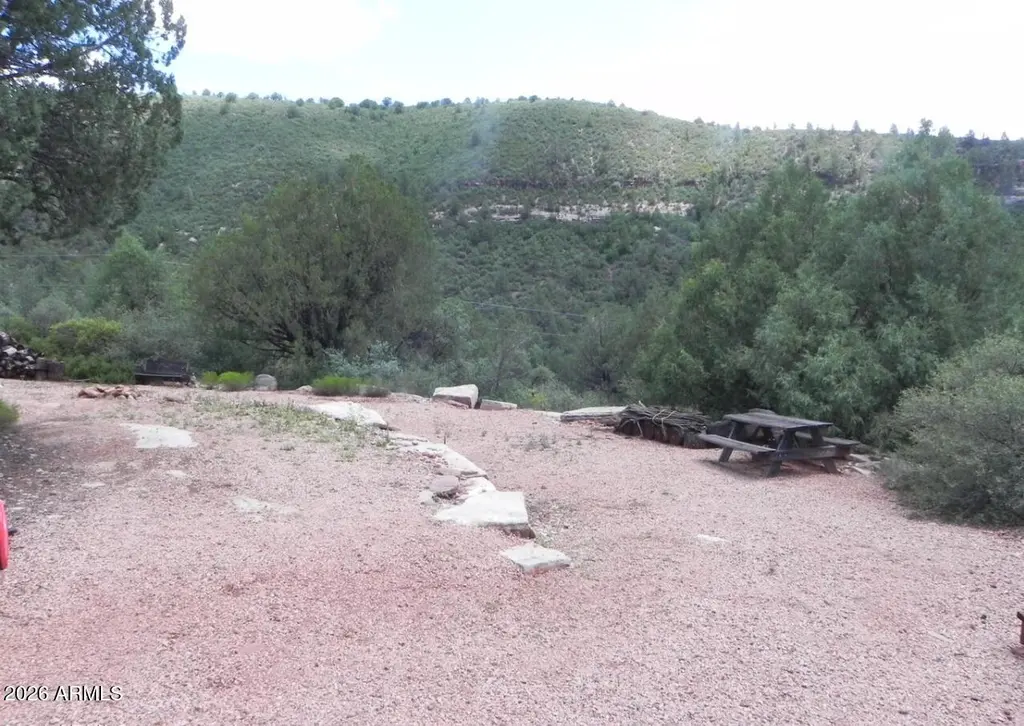
Condition & rehab AI · 1 photo
This property is in poor condition and requires extensive repairs and updates to become move-in ready. Significant improvements are needed in the exterior, flooring, interior walls, roof, windows, foundation, structure, HVAC, and landscaping to increase its value for resale and rental.
Repairs flagged
- Major exterior walls and siding — The property is surrounded by natural vegetation and appears to be in a remote location, indicating the need for extensive repairs.
- Major flooring — The ground is covered with gravel and dirt, indicating the need for extensive repairs.
- Major interior walls and paint — No interior walls or paint are visible in the photos, indicating the need for extensive repairs.
- Major roof — No roof is visible in the photos, indicating the need for extensive repairs.
- Major windows — No windows are visible in the photos, indicating the need for extensive repairs.
- Major foundation and structure — No foundation or structure is visible in the photos, indicating the need for extensive repairs.
- Major HVAC and mechanical systems — No HVAC or mechanical systems are visible in the photos, indicating the need for extensive repairs.
- Major landscaping and curb appeal — The property is surrounded by natural vegetation and appears to be in a remote location, indicating the need for extensive repairs.
Value-add opportunities
- Both landscaping and curb appeal — Improving the landscaping and curb appeal would enhance the property's visual appeal and increase its value for both resale and rental.
- Both exterior walls and siding — Repairing the exterior walls and siding would improve the property's appearance and increase its value for both resale and rental.
- Both flooring — Installing flooring would improve the property's appearance and increase its value for both resale and rental.
- Both interior walls and paint — Painting the interior walls would improve the property's appearance and increase its value for both resale and rental.
- Both roof — Repairing the roof would improve the property's appearance and increase its value for both resale and rental.
- Both windows — Replacing the windows would improve the property's appearance and increase its value for both resale and rental.
- Both foundation and structure — Repairing the foundation and structure would improve the property's appearance and increase its value for both resale and rental.
- Both HVAC and mechanical systems — Upgrading the HVAC and mechanical systems would improve the property's appearance and increase its value for both resale and rental.
- Both landscaping and curb appeal — Improving the landscaping and curb appeal would enhance the property's visual appeal and increase its value for both resale and rental.
Renovation cost estimate screening
| Repair item | Severity | Est. cost |
|---|---|---|
| exterior walls and siding · The property is surrounded by natural vegetation and appears to be in a remote location, indicating the need for extensive repairs. | Major | $15,000–50,000 |
| flooring · The ground is covered with gravel and dirt, indicating the need for extensive repairs. | Major | $15,000–50,000 |
| interior walls and paint · No interior walls or paint are visible in the photos, indicating the need for extensive repairs. | Major | $15,000–50,000 |
| roof · No roof is visible in the photos, indicating the need for extensive repairs. | Major | $15,000–50,000 |
| windows · No windows are visible in the photos, indicating the need for extensive repairs. | Major | $15,000–50,000 |
| foundation and structure · No foundation or structure is visible in the photos, indicating the need for extensive repairs. | Major | $15,000–50,000 |
| HVAC and mechanical systems · No HVAC or mechanical systems are visible in the photos, indicating the need for extensive repairs. | Major | $15,000–50,000 |
| landscaping and curb appeal · The property is surrounded by natural vegetation and appears to be in a remote location, indicating the need for extensive repairs. | Major | $15,000–50,000 |
| Total estimated repair cost · 8 items | $120,000–400,000 |
Value-add ROI direction
- Both landscaping and curb appeal — Improving the landscaping and curb appeal would enhance the property's visual appeal and increase its value for both resale and rental. ↑
- Both exterior walls and siding — Repairing the exterior walls and siding would improve the property's appearance and increase its value for both resale and rental. ↑
- Both flooring — Installing flooring would improve the property's appearance and increase its value for both resale and rental. ↑
- Both interior walls and paint — Painting the interior walls would improve the property's appearance and increase its value for both resale and rental. ↑
- Both roof — Repairing the roof would improve the property's appearance and increase its value for both resale and rental. ↑
- Both windows — Replacing the windows would improve the property's appearance and increase its value for both resale and rental. ↑
- Both foundation and structure — Repairing the foundation and structure would improve the property's appearance and increase its value for both resale and rental. ↑
- Both HVAC and mechanical systems — Upgrading the HVAC and mechanical systems would improve the property's appearance and increase its value for both resale and rental. ↑
- Both landscaping and curb appeal — Improving the landscaping and curb appeal would enhance the property's visual appeal and increase its value for both resale and rental. ↑
ⓘ Cost ranges are severity-bucket heuristics (US national rule-of-thumb). Get contractor quotes + a written scope before underwriting a rehab budget.
Schools (NCES district)
- District
- Payson Unified District (4209)
- NCES district ID
- 0406070
- Math proficiency
- 20% ▼ -21.00%
- Reading proficiency
- 32% ▼ -16.00%
- Median HH income
- $41,440
- Composite
- 22.03/100
- National rank
- #8200
- State rank
- #138 of 249 in AZ
Livability — Payson
- Score
- 69/100
- State rank
- #44
- US rank
- #8740
Category grades
Schools grade is shown separately in the Schools card above.
Census & demographics
- Census place
- Payson, AZ
- County
- Gila County · 23,382 people
- City population
- 23,382
- Metro
- Payson, AZ
- Population (ZIP)
- 23,382
- Household income
- $66,383
- Rent vs Own
- Severe rent burden
- 523.0
Population outlook (Gila County) Hauer SSP2
- Today (2025)
- 50,229 people
- By 2030
- 48,202 · -4.0%
- By 2040
- 44,101 · -12.2%
- By 2050
- 41,041 · -18.3%
- By 2075
- 37,536 · -25.3%
- By 2100
- 32,485 · -35.3%
Race, ethnicity, and origin ACS 2023
- Neighborhood character
- Predominantly White (84%)
- Race & ethnicity
- White 84% Hispanic / Latino 11% Two or more races 8% Native American 1%
- Hispanic origin (detail)
- Mexican 9%
- Common ancestry
- Portuguese 3% Lithuanian 2% Iranian 2%
- Foreign-born
- 3% · Canada
- Languages at home
- 93% English-only · Spanish 5% German/W. Germanic 1%
Political lean MEDSL · Gila
- 2024 margin
- Solid R (+37.6) · D 30.8% · R 68.4%
- 2008→2024 swing
- -9.8pp toward R · 2008: -27.8pp · 2024: -37.6pp
- All cycles
- 2024: R+37.6 2020: R+34.1 2016: R+32.4 2012: R+26.4 2008: R+27.8
Not yet ingested
- Civics
- —
Market trends
- HPI YoY
- ▼ -29.47%
- Current HPI
- 416.4005
- Rent YoY
- —
- Metro
- Payson, AZ
- State GDP YoY
- ▲ 4.54%
- F500 in state
- 20
Industry mix (Fortune 500 HQ in AZ)
| Industry | F500 HQs | Revenue |
|---|---|---|
| Technology | 2 | $13B |
|
||
| Mining / Metals | 1 | $23B |
|
||
| Environmental Services | 1 | $16B |
|
||
| Metals / Steel | 1 | $14B |
|
||
| Technology Distribution | 1 | $9B |
|
||
| Homebuilding | 1 | $8B |
|
||
Price history
+16.1% since first listed6 events — show timeline
- 2026-05-30 Listed $32,500 CAAR
- 2026-05-30 Listed $32,500 ARMLS
- 2026-03-29 Price Changed $139,000 ARMLS
- 2026-03-02 Listed $169,000 ARMLS
- 2007-09-21 Listing Removed — ARMLS
- 2007-03-21 Listed $28,000 ARMLS
Cash-flow waterfall
monthlySold comps — $/sqft
last 12 mo · ≤1 miLoading sold comps…