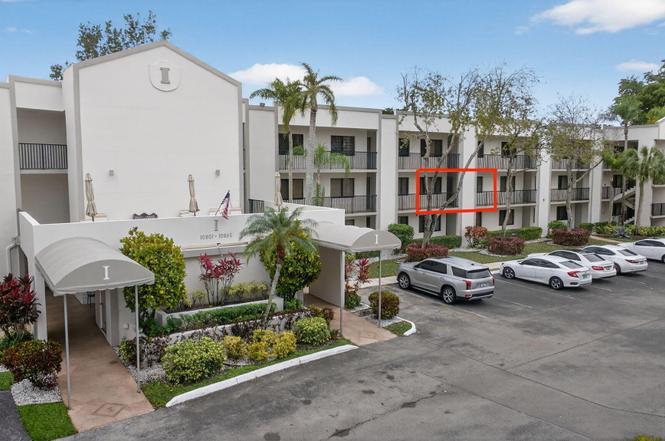
10837 W Clairmont Cir #208 · Tamarac, FL
Flood risk 1/10 · Minimal
- FEMA flood zone
- AH
- Chance of flooding over 30 yrs
- 0.0%
- Est. flood insurance / yr
- $1,142 – $2,507
Fire risk 6/10 · Moderate
- Est. fire insurance / yr
- $947 – $1,759
Heat risk 9/10 · Severe
- Hot days now (above 106°F)
- 6 days/yr
- Hot days in 30 yrs
- 23 days/yr
Wind risk 10/10 · Severe
- Chance of severe wind over 30 yrs
- 99.0%
Air-quality risk 3/10 · Minor
- Unhealthy air days now
- 2 days/yr
- Unhealthy air days in 30 yrs
- 3 days/yr
Risk factors via First Street. Map © Google.
Why this score? — see what drove the C grade
The composite is a weighted blend of 9 inputs, each scored 0–100. Each bar is that input's sub-score; the figure is the points it added to the 100-point composite (weight × sub-score).
- Cash flow +21.5/30.0
- 1% rule +10.0/10.0
- ARV discount +7.5/15.0
- DSCR +6.9/10.0
- Schools +4.1/10.0
- Livability +3.8/5.0
- Condition / age +2.5/5.0
- Rent growth +2.0/5.0
- Appreciation +0.0/10.0
$139,999
🖨 Deal sheet 📄 Offer letter ✓ Due diligence
Listing remarks
Welcome home to this 2BD/2BA condo in the 55+ Kings Point community. This 2nd-floor residence offers an open floor plan with eat-in kitchen, BRAND NEW granite countertops with pass-thru to the living/dining area, and split bedrooms for privacy. Enjoy serene garden views through the extended living space with oversized windows that flood the home with natural light. Primary suite includes walk-in closet and en-suite bath. Spacious laundry room with built-in cabinetry provides excellent storage. Water and basic cable included in monthly HOA. Kings Point delivers unmatched amenities including clubhouse, pools, fitness centers, tennis, theater, social activities, and courtesy bus transportation
Key facts
- $599 HOA
- Built 1990
- Listed 140 days
Property features AI
Finance
- Other: Living area reported as 1,228 (public records)
- Financial info: Pets not allowed; Is a senior community
- HOA & community: Monthly association fee; Association amenities include clubhouse, elevators, shuffleboard court, spa/hot tub, courtesy bus; HOA fee covers cable TV, grounds maintenance, security, sewer, trash, water, common areas, and recreation facility
Exterior
- Parking: Assigned parking; Guest parking
- Security: Gated community with guard
- Utilities: Public water; Public sewer; Three-phase electric; Cable available; Water available; Sewer available
- Home design: Condominium; 3 total stories; Faces east; Resale condition
- Construction: CBS construction
- Exterior features: Non-waterfront
Interior
- Kitchen: Dishwasher; Electric range; Microwave; Refrigerator
- Bedrooms: 2 bedrooms on the main level
- Flooring: Laminate
- Bathrooms: 2 full bathrooms on the main level
- Heating & cooling: Central heating; Central air conditioning
- Interior features: Built-in features; Walk-in closet(s)
- Laundry & utility: Inside laundry
Neighborhood map
What this means for you Summary
Snapshot
- This is a 2-bed/2.0-bath condo listed at $140k.
Deal economics
- At list price, monthly cash flow is $58 ($694/yr) — positive.
- The deal already cash-flows at list — no discount required.
- Meets the 1% rule at list price ($2k rent vs $140k).
- Recommended offer: $123k (12.0% below list) — sets the bar for market timing.
- Cap rate 8.1% vs local median 3.9% in Tamarac — top-decile yield for the area; either an underpriced asset or a hidden risk that comps aren't pricing in. Stress-test before assuming the spread holds.
Location & tenants
- Location reads 76/100 on livability (#239 in FL, #3,785 nationally) — a middle-class / working-renter tenant base. Strengths: housing A+, health & safety A+, cost of living A-; Watch: employment C-, amenities F, commute F.
- Broward (suburban): math 42% / reading 53% proficiency, ranked #46 of 73 in FL (top 63%) — families likely to look elsewhere, expect single-tenant / working-renter base with shorter leases.
- Zoned schools: Challenger Elementary School (math 37% / reading 53%, grade D-, #1,271 of 2,144 statewide, top 60%, 909 students, 62% FRL); J. P. Taravella High School (math 19% / reading 45%, grade F, #415 of 667 statewide, top 63%, 2,586 students, 54% FRL).
- Market conditions: Rents soft (-1.9%/yr); 588 active listings in the ZIP; 40 comparable units currently listed for rent nearby; rentals at typical pace (median 25d on market — plan ~3-4 weeks tenant-placement turnaround); 2,111 units permitted in Broward County in 2024 (1,265 in 5+ unit buildings).
- This rent runs 41% of the median local income ($62k/yr) — at the standard rent-burdened threshold; future hikes will face affordability resistance.
Forward outlook
- Local home prices are declining (-3.0%/yr); year-one equity from $968 of loan paydown is wiped out by about $4k of value loss. Plan a longer hold.
- Broward County population projected at +34% by 2050 — long-run rental-demand tailwind backs the buy-and-hold thesis.
Negotiation context
- It's been on market 140 days — a 12% lower offer ($123k) is reasonable based on typical stale-listing flexibility.
Risks & watch-outs
- Watch-outs: flood insurance adds $152/mo; HOA is 28% of rent.
- Climate carrying-cost: in FEMA flood zone AH (mandatory federal flood insurance); severe wind risk, 99% chance of damaging wind over 30y; major wildfire risk; extreme-heat days projected 6→23/yr by 2055 (HVAC capex compounding) — expect insurance premiums to compound above CPI over the hold.
Questions for the listing agent
- It's been on market 140 days. Have you received any prior offers? Is the seller open to a 12% concession, seller financing, or rate buy-down credit?
- What's the actual annual flood-insurance premium (NFIP or private), and is the property in a SFHA with mandatory coverage?
- What does the HOA fee cover, when was the last increase, and are there any pending special assessments or reserve-fund shortfalls?
- Any open or pending special assessments — roof, HVAC, plumbing, elevator, façade? What's the per-unit balance and payoff schedule, and is the seller paying it off at close or rolling it to the buyer?
- Why hasn't it sold? Are there any deal-killer items the seller is aware of (foundation, flood, title, zoning, code violations)?
- Is there a deadline driving the sale (1031 exchange, divorce, estate, relocation)? That informs how much negotiation room exists.
- Schools are B-rated — typically a magnet for longer-tenancy family renters. What's the average tenant stay here, and is there a school-zone premium baked into asking?
- What's the average days-on-market for RENTAL listings here right now (not sales)? A rising rental-DOM trend means longer vacancies and softer asking-rent achievability than the comps imply.
- What's the recent tenant-quality profile in this submarket — average credit score on applications, eviction rate, late-payment / NSF rate, and stable-employment percentage? A property-management company in the area should have these aggregated.
- How much new apartment / multifamily construction is in the pipeline within 1–3 miles? Heavy new supply (>2% of stock underway) typically softens rents 12–24 months out; light construction supports rent growth.
Investment metrics
- 1% rule
- 1.50% ✓
- Cap rate
- 8.09%
- Cash-on-cash
- 6.42%
- DSCR
- 1.29
- GRM
- 5.5
CMA / ARV
No comps found within radius.
Projected returns pro-forma
-3.0% appreciation · 0.0% rent growth · sell at horizon
- IRR
- -18.8%
- Equity multiple
- 0.37×
- Total profit
- $-24,748
- Equity at exit
- $20,874
- IRR
- -27.3%
- Equity multiple
- 0.01×
- Total profit
- $-38,926
- Equity at exit
- $12,105
Cash invested: $39,200 (down + closing). Projections, not guarantees.
Landlord ↔ Tenant lean methodology
- Overall (STATE)
- 87 Strongly Landlord-Friendly
- State Florida
- 87 Strongly Landlord-Friendly · R+3
- County
- — inherits STATE
- City
- — inherits STATE
ZIP-level market 33321
- Home prices YoY
- -30.4%
- Rents YoY
- -1.9%
- Active inventory
- 588
- Price-to-rent
- 5.5×
Monthly cashflow live
- Estimated rent
- $2,105 high interval (Pro) →
- Mortgage (P&I)
- −$734
- Tax from tax record
- −$61 /mo · $737/yr
- Insurance
- −$58
- Flood insurance flood zone
- −$152 /mo · $1,824/yr
- HOA
- −$599
- Vacancy / Maint / Mgmt
- −$442
- Net cashflow
- $58
Break-even live
UW: 25.0% down · 7.5% · 30yr · 1.5% tax · 5.0% vac · 8.0% maint · 8.0% mgmt
Financing live
Cash to close
- Down payment
- $35,000
- Closing costs
- $4,200
- Reserves months
- —
- Total cash needed
- —
Loan-product check · same deal, 3 products live
Conventional
25% down · 7.5% · 30yr
- Down + closing
- —
- Monthly P&I
- —
- Monthly cashflow
- —
- DSCR
- —
- Eligible?
- —
Personal DTI + credit; lowest rate.
DSCR
20% down · 8.5% · 30yr
- Down + closing
- —
- Monthly P&I
- —
- Monthly cashflow
- —
- DSCR
- —
- Eligible?
- —
No personal income docs; deal must DSCR.
Hard money
10% down · 12.0% · 12mo
- Down + closing
- —
- Monthly P&I
- —
- Monthly cashflow
- —
- DSCR
- —
- Eligible?
- —
Short-term bridge; refi at stabilization.
Rent comps 40 comps
| Address | Beds | Baths | Sqft | Rent | $/sqft | DOM | Units | Dist |
|---|---|---|---|---|---|---|---|---|
| 10959 W Clairmont Cir #211 Tamarac, FL | 2.0 | 2.0 | 1163 | $2,100 | $1.81 | 24d | 1 | 0.06mi |
| 10419 E Clairmont Cir #205 Tamarac, FL | 2.0 | 2.0 | 827 | $2,000 | $2.42 | 8d | 1 | 0.15mi |
| 10425 E Clairmont Cir #107 Tamarac, FL | 2.0 | 2.0 | 827 | $1,850 | $2.24 | 24d | 1 | 0.15mi |
| 10419 E Clairmont Cir #205 Tamarac, FL | 2.0 | 2.0 | 827 | $2,000 | $2.42 | 24d | 1 | 0.15mi |
| 7214 S Devon Dr #211 Tamarac, FL | 2.0 | 2.0 | 1292 | $2,400 | $1.86 | 24d | 1 | 0.19mi |
| 10350 E Clairmont Cir #312 Tamarac, FL | 2.0 | 2.0 | 1294 | $2,300 | $1.78 | 24d | 1 | 0.20mi |
| 10426 E Clairmont Cir #212 Tamarac, FL | 2.0 | 2.0 | 1294 | $2,100 | $1.62 | 24d | 1 | 0.22mi |
| 7271 S Devon Dr #101 Tamarac, FL | 2.0 | 2.0 | 1187 | $2,200 | $1.85 | 22d | 1 | 0.24mi |
| 9978 N Belfort Cir #206 Fort Lauderdale, FL | 1.0 | 2.0 | 827 | $2,400 | $2.90 | 24d | 1 | 0.49mi |
| 9909 Westwood Dr Unit 23-1 Tamarac, FL | 2.0 | 1.0 | 939 | $1,870 | $1.99 | 5d | 1 | 0.58mi |
| 9909 Westwood Dr Unit 23-1 Tamarac, FL | 2.0 | 1.0 | 939 | $1,880 | $2.00 | 24d | 1 | 0.58mi |
| 9907 Westwood Dr Unit 24-2 Tamarac, FL | 2.0 | 1.0 | 939 | $2,000 | $2.13 | 24d | 1 | 0.59mi |
| 7737 Trent Dr #204 Tamarac, FL | 2.0 | 2.0 | 1080 | $2,000 | $1.85 | 21d | 1 | 0.70mi |
| 7878 Trent Dr #308 Tamarac, FL | 2.0 | 2.0 | 1215 | $2,000 | $1.65 | 13d | 1 | 0.75mi |
| 7878 Trent Dr #308 Tamarac, FL | 2.0 | 2.0 | 1215 | $2,300 | $1.89 | 24d | 1 | 0.75mi |
| 9920 NW 68th Pl Tamarac, FL | 2.0 | 2.0 | 890 | $1,975 | $2.22 | 24d | 2 | 0.76mi |
| 9485 N Belfort Cir #308 Tamarac, FL | 2.0 | 2.0 | 1228 | $2,100 | $1.71 | 14d | 1 | 0.82mi |
| 7755 Yardley Dr #112 Fort Lauderdale, FL | 2.0 | 2.0 | 1229 | $2,400 | $1.95 | 24d | 1 | 0.88mi |
| 7940 N Nob Hill Rd #108 Tamarac, FL | 2.0 | 2.0 | 981 | $2,150 | $2.19 | 24d | 1 | 0.89mi |
| 7950 N Nob Hill Rd #203 Tamarac, FL | 3.0 | 2.0 | 981 | $2,700 | $2.75 | 24d | 1 | 0.89mi |
| 8000 N Nob Hill Rd #206 Tamarac, FL | 2.0 | 2.0 | 981 | $2,190 | $2.23 | 8d | 1 | 0.91mi |
| 8000 N Nob Hill Rd #206 Tamarac, FL | 2.0 | 2.0 | 981 | $2,000 | $2.04 | 5d | 1 | 0.91mi |
| 8000 N Nob Hill Rd #106 Tamarac, FL | 2.0 | 2.0 | 981 | $2,000 | $2.04 | 4d | 1 | 0.91mi |
| 9608 W McNab Rd #103 Tamarac, FL | 2.0 | 2.0 | 820 | $1,750 | $2.13 | 22d | 1 | 0.91mi |
| 7970 N Nob Hill Rd Tamarac, FL | 1.0–3.0 | 1.0–2.0 | 1137 | $2,195 | $1.93 | 21d | 2 | 0.92mi |
| 7970 N Nob Hill Rd Tamarac, FL | 3.0 | 2.0 | 1137 | $2,475 | $2.18 | 24d | 2 | 0.92mi |
| 7765 Yardley Dr #107 Fort Lauderdale, FL | 2.0 | 2.0 | 1469 | $2,200 | $1.50 | 13d | 1 | 0.93mi |
| 7980 N Nob Hill Rd #205 Tamarac, FL | 2.0 | 2.0 | 981 | $2,050 | $2.09 | 24d | 1 | 0.94mi |
| 7980 N Nob Hill Rd Tamarac, FL | 1.0–2.0 | 1.0–2.0 | 836 | $2,050 | $2.45 | 17d | 2 | 0.94mi |
| 8030 N Nob Hill Rd #105 Tamarac, FL | 2.0 | 2.0 | 981 | $2,100 | $2.14 | 24d | 1 | 0.96mi |
| 8020 N Nob Hill Rd Tamarac, FL | 1.0–2.0 | 1.0–2.0 | 981 | $2,180 | $2.22 | 15d | 3 | 0.97mi |
| 7670 Westwood Dr #703 Tamarac, FL | 2.0 | 2.0 | 984 | $1,850 | $1.88 | 24d | 1 | 0.98mi |
| 9511 Weldon Cir Unit 412 Tamarac, FL | 2.0 | 2.0 | 1080 | $1,875 | $1.74 | 8d | 1 | 0.99mi |
| 9511 Weldon Cir Tamarac, FL | 2.0 | 2.0 | 1116 | $1,850 | $1.66 | 24d | 2 | 0.99mi |
| 7610 Westwood Dr Tamarac, FL | 2.0–3.0 | 2.0 | 1017 | $1,980 | $1.95 | 17d | 1 | 0.99mi |
| 8060 N Nob Hill Rd #203 Tamarac, FL | 2.0 | 2.0 | 981 | $2,200 | $2.24 | 24d | 1 | 1.00mi |
| 7630 Westwood Dr #327 Tamarac, FL | 1.0 | 1.0 | 741 | $1,550 | $2.09 | 15d | 1 | 1.00mi |
| 7630 Westwood Dr #327 Tamarac, FL | 1.0 | 1.0 | 741 | $1,550 | $2.09 | 2d | 1 | 1.00mi |
| 8070 N Nob Hill Rd #205 Tamarac, FL | 2.0 | 2.0 | 981 | $1,990 | $2.03 | 24d | 1 | 1.02mi |
| 10000 S Nob Hill Cir #10163 Tamarac, FL | 2.0 | 1.0 | 900 | $1,767 | $1.96 | 3d | 1 | 1.02mi |
HOA detail condo
- Monthly dues
- $599 · $7,188/yr
- Likely covers
- watercablepoolgym
- Assessments
- None detected in remarks — confirm with the listing agent.
Listing history 18 events
-
2026-06-18days on market $139,999 Active 140 DOM
-
2026-06-17days on market $139,999 Active 139 DOM
-
2026-06-16days on market $139,999 Active 138 DOM
-
2026-06-15days on market $139,999 Active 137 DOM
-
2026-06-13days on market $139,999 Active 135 DOM
-
2026-06-09days on market $139,999 Active 131 DOM
-
2026-06-07days on market $139,999 Active 129 DOM
-
2026-06-04days on market $139,999 Active 126 DOM
-
2026-06-03days on market $139,999 Active 125 DOM
-
2026-06-02days on market $139,999 Active 124 DOM
-
2026-06-01days on market $139,999 Active 123 DOM
-
2026-05-31days on market $139,999 Active 122 DOM
-
2026-05-18price $139,999
-
2026-02-22price $149,900
-
2026-02-16price $154,900
-
2026-02-16price $154,999
-
2026-01-29$159,999 Active
-
2026-01-27historical $159,999
ⓘ Source: listings_history table (triggers on properties + properties_extension) + one-shot
backfill from property_details.listing_events for pre-trigger history.
Tax reassessment forecast FL · Resets to sale price
- Current annual tax
- $737 · $61/mo
- Projected year-2 tax
- $1,162 · $97/mo
- Expected delta
- +$425/yr (+$35/mo · 57.6%)
ⓘ Screening estimate from a state-policy table — verify with the county assessor before closing.
Climate risk First Street
- Flood 1/10 Low FEMA zone AH · 0% chance over 30 yrs
- Wildfire 6/10 Major
- Heat 9/10 Extreme 6 d/yr ≥106°F today · 23 d/yr by 30 yrs out
- Wind 10/10 Extreme 99% chance of damaging wind over 30 yrs
- Air quality 3/10 Moderate 2 unhealthy d/yr today · 3 by 30 yrs out
Nearby sold comps map
Loading sold comps map…
Walkable amenities ~0.75 mi
Loading nearby amenities…
Taxation est. · year 1
- Rental income
- $25,258
- − Mortgage interest
- −$7,842
- − Property taxes
- −$737
- − Insurance
- −$2,524
- − Repairs & maintenance
- −$2,021
- − Management
- −$2,021
- − HOA
- −$7,188
- − Depreciation
- −$4,073
- Taxable loss
- −$1,148
- Est. tax savings @ 24.0%
- +$276
- After-tax cash flow
- $969/yr
For passive investors: Depreciation is non-cash, so a rental often shows a tax loss while cash-flowing — sheltering income. Rental losses are passive: they offset passive income freely, and up to $25,000/yr can offset ordinary (W-2) income if you actively participate and your MAGI is under $100k (phasing out to $0 by $150k); unused losses carry forward. On sale, claimed depreciation is recaptured at up to 25%, and gains may owe capital-gains tax (a 1031 exchange can defer both). Figures are a year-1 estimate at your 24.0% rate — not tax advice; consult a CPA.
Schools (NCES district)
- District
- Broward
- NCES district ID
- 1200180
- Math proficiency
- 42% ▼ -18.00%
- Reading proficiency
- 53% ▼ -5.00%
- Median HH income
- $52,139
- Composite
- 40.88/100
- National rank
- #3621
- State rank
- #46 of 73 in FL
Livability — Tamarac
- Score
- 76/100
- State rank
- #239
- US rank
- #3785
Category grades
Schools grade is shown separately in the Schools card above.
Census & demographics
- Census place
- Tamarac, FL
- County
- Broward County · 1,963,430 people
- City population
- 105,666
- Metro
- Miami-Fort Lauderdale-Pompano Beach, FL
- Population (ZIP)
- 51,216
- Household income
- $62,066
- Rent vs Own
- Severe rent burden
- 1394.0
Population outlook (Broward County) Hauer SSP2
- Today (2025)
- 2,207,033 people
- By 2030
- 2,360,704 · +7.0%
- By 2040
- 2,661,208 · +20.6%
- By 2050
- 2,946,698 · +33.5%
- By 2075
- 3,602,273 · +63.2%
- By 2100
- 3,970,984 · +79.9%
Race, ethnicity, and origin ACS 2023
- Neighborhood character
- Highly diverse neighborhood (Simpson 0.70)
- Race & ethnicity
- Hispanic / Latino 34% White 33% Black 27% Two or more races 20% Asian 3%
- Hispanic origin (detail)
- Mexican 2% Puerto Rican 5% Cuban 5% Dominican 3%
- Common ancestry
- Romanian 3% Hispanic 3% Scotch-Irish 2%
- Foreign-born
- 38% · Canada, Jamaica, Dominican Republic
- Languages at home
- 63% English-only · Spanish 29% French/Haitian/Cajun 4% Other Indo-European 1%
Political lean MEDSL · Broward
- 2024 margin
- D (+17.0) · D 58.0% · R 41.0%
- 2008→2024 swing
- -17.8pp toward R · 2008: 34.7pp · 2024: 17.0pp
- All cycles
- 2024: D+17.0 2020: D+29.8 2016: D+35.0 2012: D+34.9 2008: D+34.7
Not yet ingested
- Civics
- —
Market trends
- HPI YoY
- ▼ -158.63%
- Current HPI
- 362.2989
- Rent YoY
- ▼ -1.86%
- Metro
- Miami-Fort Lauderdale-Pompano Beach, FL
- State GDP YoY
- ▲ 3.28%
- F500 in state
- 36
Industry mix (Fortune 500 HQ in FL)
| Industry | F500 HQs | Revenue |
|---|---|---|
| Industrial Technology | 2 | $29B |
|
||
| Insurance | 2 | $17B |
|
||
| Retail | 1 | $60B |
|
||
| Technology Distribution | 1 | $58B |
|
||
| Homebuilding | 1 | $35B |
|
||
| Technology Manufacturing | 1 | $35B |
|
||
Price history
-12.5% since first listed6 events — show timeline
- 2026-05-18 Price Changed $139,999 Beaches MLS
- 2026-02-22 Price Changed $149,900 Beaches MLS
- 2026-02-16 Price Changed $154,900 Beaches MLS
- 2026-02-16 Price Changed $154,999 Beaches MLS
- 2026-01-29 Listed $159,999 Beaches MLS
- 2026-01-27 Coming Soon $159,999 Beaches MLS
Property tax history
+0.9%/yrLatest (2025): $737 · +6.4% YoY. Source: county tax records.
Cash-flow waterfall
monthlySold comps — $/sqft
last 12 mo · ≤1 miLoading sold comps…