15 Vly Rd · Colonie, NY
Flood risk 4/10 · Minor
- FEMA flood zone
- X (unshaded)
- Chance of flooding over 30 yrs
- 0.22%
- Est. flood insurance / yr
- $473 – $860
Fire risk 3/10 · Minor
- Est. fire insurance / yr
- $691 – $1,283
Heat risk 4/10 · Minor
- Hot days now (above 96°F)
- 7 days/yr
- Hot days in 30 yrs
- 16 days/yr
Wind risk 3/10 · Minor
- Chance of severe wind over 30 yrs
- 5.0%
Air-quality risk 1/10 · Minimal
- Unhealthy air days now
- 0 days/yr
- Unhealthy air days in 30 yrs
- 0 days/yr
Risk factors via First Street. Map © Google.
Why this score? — see what drove the D+ grade
The composite is a weighted blend of 9 inputs, each scored 0–100. Each bar is that input's sub-score; the figure is the points it added to the 100-point composite (weight × sub-score).
- Cash flow +13.0/30.0
- ARV discount +11.6/15.0
- Schools +5.3/10.0
- Livability +4.2/5.0
- DSCR +3.9/10.0
- 1% rule +3.5/10.0
- Rent growth +2.5/5.0
- Condition / age +2.5/5.0
- Appreciation +0.0/10.0
$215,000
🖨 Deal sheet 📄 Offer letter ✓ Due diligence
Listing remarks
Sold before Print
Key facts
- 0.23 acre lot
- 4 parking spots
- Built 1920
Property features AI
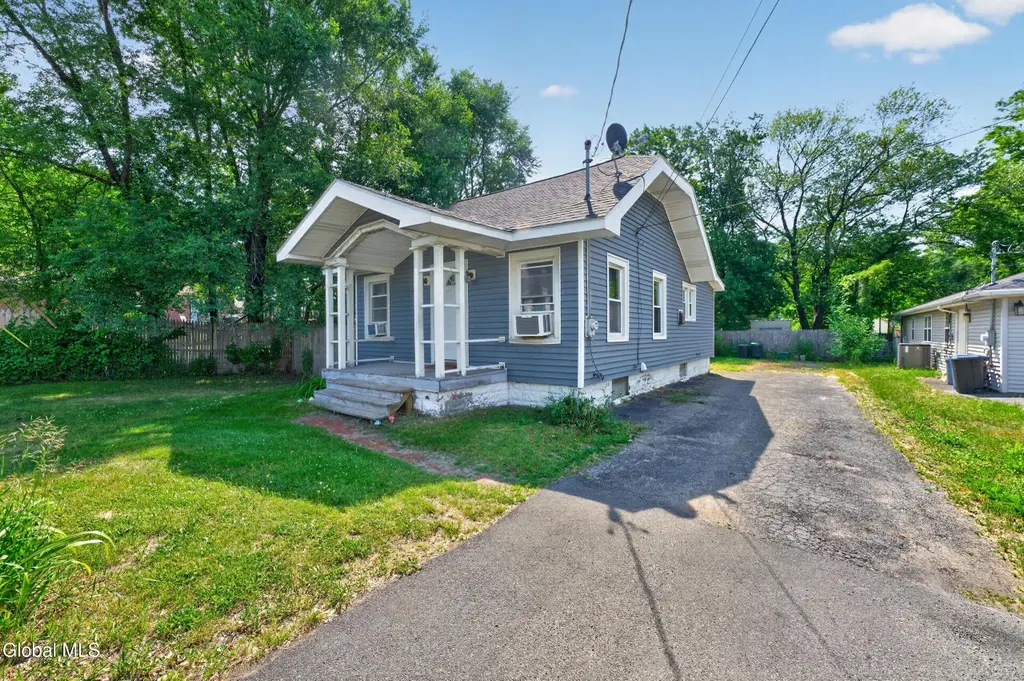
Exterior
- Parking: Four off-street paved parking spaces
- Utilities: Public water; Public sewer; 150 amp electric service; Cable connected
- Home design: Single-family residence; Listed as fixer condition; Vinyl siding construction; Block foundation; Asphalt roof
- Construction: Vinyl siding; Block foundation; Asphalt roof
- Exterior features: Front and covered rear porch; Rear porch; Exterior lighting; Yard with wood and chain-link fencing and gated access; On-site shed
Interior
- Kitchen: Gas oven; Refrigerator
- Bedrooms: Two bedrooms on the first floor
- Flooring: Tile; Wood; Laminate
- Bathrooms: One full bathroom on the first floor
- Heating & cooling: Baseboard hot water heating (natural gas); Window air conditioning units
- Interior features: Ceiling paddle fan; Double-pane windows; Full basement
- Laundry & utility: Washer and dryer (in basement); Gas water heater
Neighborhood map
What this means for you Summary
Snapshot
- This is a 2-bed/1.0-bath single-family listed at $215k.
Deal economics
- At list price, monthly cash flow is $-11 ($-137/yr) — negative.
- To cash-flow at today's rent, offer at most $213k (0.9% below list).
- To meet the 1% rule (rent ≥ 1% of price), the offer needs to be $183k (14.7% below list).
- Recommended offer: $183k (14.7% below list) — sets the bar for 1% rule.
- Cap rate 6.2% vs local median 4.8% in Colonie — top-decile yield for the area; either an underpriced asset or a hidden risk that comps aren't pricing in. Stress-test before assuming the spread holds.
Location & tenants
- Location reads 85/100 on livability (#37 in NY, #572 nationally) — a professional / high-income tenant draw. Strengths: commute A+, employment A+, housing A+; Watch: crime C-, amenities C-, cost of living D.
- South Colonie Central School District (suburban): math 63% / reading 57% proficiency, ranked #215 of 590 in NY (top 36%) — acceptable for families but not a draw, mixed tenant base, ~2y average lease; only 19% free/reduced lunch — higher-income household profile.
- Zoned schools: Saddlewood Elementary School (math 67% / reading 72%, grade A-, #447 of 2,108 statewide, top 24%, 417 students, 33% FRL); Colonie Central High School (math 96% / reading 72%, grade A, #404 of 1,100 statewide, top 37%, 1,538 students, 39% FRL) — zoned schools average 36% FRL vs 19% district-wide (17 pts higher); higher-poverty schools than district average — tighter screening recommended.
- Zoned-school proficiency averages 77% at this address vs 60% district-wide (+17 pts) — the actual schools serving this property are materially stronger than the South Colonie Central School District average implies; a family-tenant draw the district grade alone would hide.
- Market conditions: 105 active listings in the ZIP; solid renter incomes; 675 units permitted in Albany County in 2024 (451 in 5+ unit buildings).
Forward outlook
- Local home prices are declining (-3.0%/yr); year-one equity from $1k of loan paydown is wiped out by about $6k of value loss. Plan a longer hold.
- Albany County population projected at +9% by 2050 — modest demand growth; plan on rents tracking national, not racing it.
Negotiation context
- Only 1 days on market — expect competitive offers; lowballing is unlikely to land.
Risks & watch-outs
- Watch-outs: built in 1920 — expect roof / HVAC / electrical / plumbing capex.
Questions for the listing agent
- What do current leases actually rent for vs. the listed asking? Can we see a recent rent roll and the last 12 months of T-12 income?
- Built in 1920 — when were the roof, HVAC, electrical panel, plumbing, and water heater last replaced?
- Is there a deadline driving the sale (1031 exchange, divorce, estate, relocation)? That informs how much negotiation room exists.
- The area grade is low — what's the realistic commute time and amenity access for the typical tenant pool here? Any planned neighborhood developments (good or bad) we should know about?
- What's the average days-on-market for RENTAL listings here right now (not sales)? A rising rental-DOM trend means longer vacancies and softer asking-rent achievability than the comps imply.
- What's the recent tenant-quality profile in this submarket — average credit score on applications, eviction rate, late-payment / NSF rate, and stable-employment percentage? A property-management company in the area should have these aggregated.
- How much new for-sale + rental construction is in the pipeline within 1–3 miles? Heavy new supply typically softens prices + rents 12–24 months out; constrained supply supports both.
Investment metrics
- 1% rule
- 0.85% ✗
- Cap rate
- 6.23%
- Cash-on-cash
- -0.23%
- DSCR
- 0.99
- GRM
- 9.8
CMA / ARV
- ARV (on-the-fly)
- $236,544
- Comps found
- 2
Show comp detail 2 sales within ~0.75 mi
| Address | Dist | Beds/Ba | Sqft | Sold | Price | $/sf | Match |
|---|---|---|---|---|---|---|---|
| 12 Birch Ave | 0.47mi | 2/1.0 | 672 (-4%) | 10mo | $210,000 | $313 | 62 |
| 45 Fuller Ter | 0.72mi | 2/1.0 | 759 (+8%) | 1mo | $255,000 | $336 | 52 |
Match score weights: distance 35% · size 25% · config 20% · recency 20%. Top-matched comps best support the ARV.
Projected returns pro-forma
-3.0% appreciation · 3.0% rent growth · sell at horizon
- IRR
- -16.7%
- Equity multiple
- 0.41×
- Total profit
- $-35,554
- Equity at exit
- $32,057
- IRR
- -8.5%
- Equity multiple
- 0.47×
- Total profit
- $-31,849
- Equity at exit
- $18,589
Cash invested: $60,200 (down + closing). Projections, not guarantees.
Landlord ↔ Tenant lean methodology
- Overall (STATE)
- 15 Strongly Tenant-Friendly
- State New York
- 15 Strongly Tenant-Friendly · D+10
- County
- — inherits STATE
- City
- — inherits STATE
ZIP-level market 12205
- Active inventory
- 105
- Price-to-rent
- 9.8×
Monthly cashflow live
- Estimated rent
- $1,833 medium interval (Pro) →
- Mortgage (P&I)
- −$1,127
- Tax from tax record
- −$242 /mo · $2,908/yr
- Insurance
- −$90
- HOA
- −$0
- Vacancy / Maint / Mgmt
- −$385
- Net cashflow
- $-11
Break-even live
UW: 25.0% down · 7.5% · 30yr · 1.5% tax · 5.0% vac · 8.0% maint · 8.0% mgmt
Financing live
Cash to close
- Down payment
- $53,750
- Closing costs
- $6,450
- Reserves months
- —
- Total cash needed
- —
Loan-product check · same deal, 3 products live
Conventional
25% down · 7.5% · 30yr
- Down + closing
- —
- Monthly P&I
- —
- Monthly cashflow
- —
- DSCR
- —
- Eligible?
- —
Personal DTI + credit; lowest rate.
DSCR
20% down · 8.5% · 30yr
- Down + closing
- —
- Monthly P&I
- —
- Monthly cashflow
- —
- DSCR
- —
- Eligible?
- —
No personal income docs; deal must DSCR.
Hard money
10% down · 12.0% · 12mo
- Down + closing
- —
- Monthly P&I
- —
- Monthly cashflow
- —
- DSCR
- —
- Eligible?
- —
Short-term bridge; refi at stabilization.
Listing history 2 events
-
2026-06-13remarks 17-char remark
-
2026-06-13$215,000 Pending 1 DOM
ⓘ Source: listings_history table (triggers on properties + properties_extension) + one-shot
backfill from property_details.listing_events for pre-trigger history.
Tax reassessment forecast NY · Partial reset (capped growth)
- Current annual tax
- $2,908 · $242/mo
- Projected year-2 tax
- $3,271 · $273/mo
- Expected delta
- +$363/yr (+$30/mo · 12.5%)
ⓘ Screening estimate from a state-policy table — verify with the county assessor before closing.
Climate risk First Street
- Flood 4/10 Moderate FEMA zone X (unshaded) · 22% chance over 30 yrs
- Wildfire 3/10 Moderate
- Heat 4/10 Moderate 7 d/yr ≥96°F today · 16 d/yr by 30 yrs out
- Wind 3/10 Moderate 5% chance of damaging wind over 30 yrs
- Air quality 1/10 Low 0 unhealthy d/yr today · 0 by 30 yrs out
Nearby sold comps map
Loading sold comps map…
Walkable amenities ~0.75 mi
Loading nearby amenities…
Taxation est. · year 1
- Rental income
- $21,995
- − Mortgage interest
- −$12,043
- − Property taxes
- −$2,908
- − Insurance
- −$1,075
- − Repairs & maintenance
- −$1,760
- − Management
- −$1,760
- − Depreciation
- −$6,255
- Taxable loss
- −$3,805
- Est. tax savings @ 24.0%
- +$913
- After-tax cash flow
- $776/yr
For passive investors: Depreciation is non-cash, so a rental often shows a tax loss while cash-flowing — sheltering income. Rental losses are passive: they offset passive income freely, and up to $25,000/yr can offset ordinary (W-2) income if you actively participate and your MAGI is under $100k (phasing out to $0 by $150k); unused losses carry forward. On sale, claimed depreciation is recaptured at up to 25%, and gains may owe capital-gains tax (a 1031 exchange can defer both). Figures are a year-1 estimate at your 24.0% rate — not tax advice; consult a CPA.
Schools (NCES district)
- District
- South Colonie Central School District
- NCES district ID
- 3627210
- Math proficiency
- 63% ▼ -1.00%
- Reading proficiency
- 57% ▲ 4.00%
- Median HH income
- $69,499
- Composite
- 52.97/100
- National rank
- #1527
- State rank
- #215 of 590 in NY
Livability — Colonie
- Score
- 85/100
- State rank
- #37
- US rank
- #572
Category grades
Schools grade is shown separately in the Schools card above.
Census & demographics
- Census place
- Colonie, NY
- County
- Albany County · 196,626 people
- City population
- 25,912
- Metro
- Albany-Schenectady-Troy, NY
- Population (ZIP)
- 25,838
- Household income
- $91,020
- Rent vs Own
- Severe rent burden
- 530.0
Population outlook (Albany County) Hauer SSP2
- Today (2025)
- 320,794 people
- By 2030
- 327,401 · +2.1%
- By 2040
- 338,218 · +5.4%
- By 2050
- 348,467 · +8.6%
- By 2075
- 381,693 · +19.0%
- By 2100
- 393,809 · +22.8%
Race, ethnicity, and origin ACS 2023
- Neighborhood character
- Predominantly White (73%)
- Race & ethnicity
- White 73% Asian 8% Black 8% Two or more races 6% Hispanic / Latino 5%
- Hispanic origin (detail)
- Puerto Rican 3%
- Common ancestry
- Romanian 6% Lithuanian 3% Iranian 2%
- Foreign-born
- 13% · Canada, China, Vietnam
- Languages at home
- 84% English-only · Other Indo-European 4% Russian/Polish/Slavic 3% Tagalog/Filipino 2%
Political lean MEDSL · Albany
- 2024 margin
- Strong D (+25.8) · D 62.9% · R 37.1%
- 2008→2024 swing
- -3.6pp toward R · 2008: 29.4pp · 2024: 25.8pp
- All cycles
- 2024: D+25.8 2020: D+31.4 2016: D+24.3 2012: D+31.0 2008: D+29.4
Not yet ingested
- Civics
- —
Market trends
- HPI YoY
- ▼ -182.10%
- Current HPI
- 302.9752
- Rent YoY
- —
- Metro
- Albany-Schenectady-Troy, NY
- State GDP YoY
- ▲ 2.60%
- F500 in state
- 92
Industry mix (Fortune 500 HQ in NY)
| Industry | F500 HQs | Revenue |
|---|---|---|
| Financial Services | 10 | $950B |
|
||
| Consumer Goods | 9 | $162B |
|
||
| Insurance | 4 | $225B |
|
||
| Telecommunications | 2 | $144B |
|
||
| Pharmaceuticals | 2 | $112B |
|
||
| Media / Entertainment | 2 | $69B |
|
||
Price history
2 events — show timeline
- 2026-06-11 Pending — Global MLS
- 2026-06-10 Listed $215,000 Global MLS
Property tax history
+3.4%/yrLatest (2025): $2,908 · +3.4% YoY. Source: county tax records.
Cash-flow waterfall
monthlySold comps — $/sqft
last 12 mo · ≤1 miLoading sold comps…