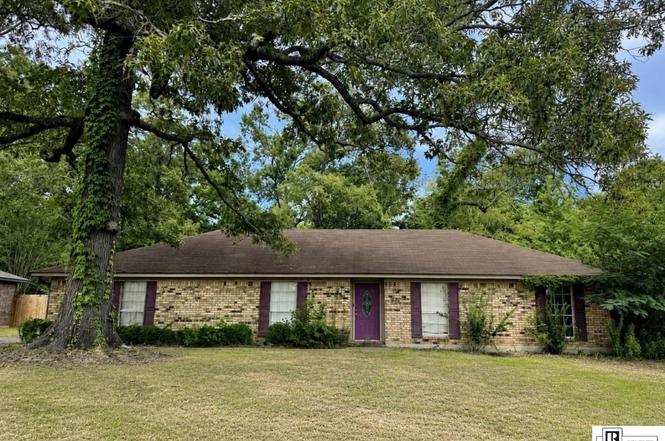
100 Lakeview Park Dr · Swartz, LA
Flood risk 1/10 · Minimal
- FEMA flood zone
- X (unshaded)
- Chance of flooding over 30 yrs
- 0.0%
- Est. flood insurance / yr
- $507 – $1,088
Fire risk 2/10 · Minimal
- Est. fire insurance / yr
- $1,269 – $2,357
Heat risk 7/10 · Major
- Hot days now (above 111°F)
- 7 days/yr
- Hot days in 30 yrs
- 20 days/yr
Wind risk 6/10 · Moderate
- Chance of severe wind over 30 yrs
- 74.0%
Air-quality risk 2/10 · Minimal
- Unhealthy air days now
- 0 days/yr
- Unhealthy air days in 30 yrs
- 1 days/yr
Risk factors via First Street. Map © Google.
Why this score? — see what drove the B+ grade
The composite is a weighted blend of 9 inputs, each scored 0–100. Each bar is that input's sub-score; the figure is the points it added to the 100-point composite (weight × sub-score).
- Cash flow +30.0/30.0
- ARV discount +15.0/15.0
- DSCR +10.0/10.0
- 1% rule +9.3/10.0
- Schools +3.2/10.0
- Livability +3.2/5.0
- Rent growth +2.5/5.0
- Condition / age +2.5/5.0
- Appreciation +0.0/10.0
$150,000
🖨 Deal sheet 📄 Offer letter ✓ Due diligence
Listing remarks
This 3-bedroom, 2-bath home at is an exceptional investment opportunity or the perfect canvas to create your dream home. The property offers 1,615 square feet of living space and features a cozy fireplace, spacious living areas, and a large backyard with ample room to entertain, garden, or expand. While the home needs a little tender loving care, it is full of possibilities for an investor looking for their next project or a buyer ready to add a personal touch. This property is conveniently located in Monroe and is ready for its next chapter. Schedule your private showing today!
Key facts
- 0.32 acre lot
- Built 1975
- Listed 3 days
Property features AI
Finance
- Other: Subdivision: LAKEVIEW PARK
- HOA & community: No association amenities
Exterior
- Parking: Carport; Open parking
- Utilities: Public water; Public sewer; Natural gas not available
- Home design: Single-family residence (site built); One-level home; Entry level: 1; Facing direction not specified
- Construction: Brick veneer construction; Asphalt roof; Slab foundation; Built year not specified
- Exterior features: Covered patio/porch; Wood fencing; Cleared lot; Paved road access
Interior
- Kitchen: Refrigerator; Microwave
- Bedrooms: 3 bedrooms on the main level
- Bathrooms: 2 full bathrooms (both on the main level)
- Heating & cooling: Central heating (electric); Central electric cooling
- Interior features: Plantation shutters; Fireplace in the living room; Other interior features
- Laundry & utility: Washer; Dryer; Electric water heater
Neighborhood map
What this means for you Summary
Snapshot
- This is a 3-bed/2.0-bath single-family listed at $150k.
Deal economics
- At list price, monthly cash flow is $674 ($8k/yr) — positive.
- The deal already cash-flows at list — no discount required.
- Meets the 1% rule at list price ($2k rent vs $150k).
- Cap rate 11.7% vs local median 6.2% in Swartz — top-decile yield for the area; either an underpriced asset or a hidden risk that comps aren't pricing in. Stress-test before assuming the spread holds.
Location & tenants
- Location reads 64/100 on livability (#184 in LA) — a middle-class / working-renter tenant base. Strengths: cost of living A+, housing A+; Watch: crime C-, health & safety D, amenities F.
- Ouachita Parish (suburban): math 31% / reading 45% proficiency, ranked #26 of 98 in LA (top 26%) — families likely to look elsewhere, expect single-tenant / working-renter base with shorter leases.
- Zoned schools: Lakeshore School (math 15% / reading 31%, grade F, #408 of 646 statewide, top 64%, 570 students, 75% FRL) — zoned schools average 75% FRL vs 52% district-wide (24 pts higher); higher-poverty schools than district average — tighter screening recommended.
- Zoned-school proficiency averages 23% at this address vs 38% district-wide (-15 pts) — the specific schools serving this property underperform the Ouachita Parish average; the district grade overstates school quality for this exact location.
- Market conditions: 437 active listings in the ZIP; 2 comparable units currently listed for rent nearby; 345 units permitted in Ouachita Parish in 2024 (0 in 5+ unit buildings).
- At $2,151/mo this rent would consume 49% of the median local household income ($52k/yr) (locally 2085% of renters already pay >50% of income on rent) — very limited rent-growth headroom before tenants either downsize or default.
Forward outlook
- Local home prices are declining (-3.0%/yr); year-one equity from $1k of loan paydown is wiped out by about $4k of value loss. Plan a longer hold.
- At projected returns (-3.0% appreciation + 3.0% rent growth), your $42k cash investment doubles in ~7 years — after that, you're playing with house money.
Negotiation context
- Only 4 days on market — expect competitive offers; lowballing is unlikely to land.
Risks & watch-outs
- Climate carrying-cost: major wind risk, 74% chance of damaging wind over 30y; extreme-heat days projected 7→20/yr by 2055 (HVAC capex compounding) — expect insurance premiums to compound above CPI over the hold.
Questions for the listing agent
- Built in 1975 — when were the roof, HVAC, electrical panel, plumbing, and water heater last replaced?
- Is there a deadline driving the sale (1031 exchange, divorce, estate, relocation)? That informs how much negotiation room exists.
- What's the average days-on-market for RENTAL listings here right now (not sales)? A rising rental-DOM trend means longer vacancies and softer asking-rent achievability than the comps imply.
- What's the recent tenant-quality profile in this submarket — average credit score on applications, eviction rate, late-payment / NSF rate, and stable-employment percentage? A property-management company in the area should have these aggregated.
- How much new for-sale + rental construction is in the pipeline within 1–3 miles? Heavy new supply typically softens prices + rents 12–24 months out; constrained supply supports both.
Investment metrics
- 1% rule
- 1.43% ✓
- Cap rate
- 11.68%
- Cash-on-cash
- 19.24%
- DSCR
- 1.86
- GRM
- 5.8
CMA / ARV
- ARV (on-the-fly)
- $203,490
- Comps found
- 12
Show comp detail 12 sales within ~0.75 mi
| Address | Dist | Beds/Ba | Sqft | Sold | Price | $/sf | Match |
|---|---|---|---|---|---|---|---|
| 310 Lakewood Dr | 0.08mi | 3/2.0 | 1,655 (+2%) | 9mo | $225,000 | $136 | 84 |
| 219 Briar Trce | 0.46mi | 3/2.0 | 1,576 (-2%) | 3mo | $240,000 | $152 | 72 |
| 204 Briar Patch Dr | 0.60mi | 3/2.0 | 1,642 (+2%) | 2mo | $256,000 | $156 | 67 |
| 114 Ashlawn Ln | 0.54mi | 4/2.0 (+1) | 1,665 (+3%) | 2mo | $175,000 | $105 | 63 |
| 120 Luke Dr | 0.46mi | 3/2.0 | 1,754 (+9%) | 6mo | $289,000 | $165 | 60 |
| 36 Winchester Cir | 0.61mi | 3/2.0 | 1,663 (+3%) | 9mo | $189,900 | $114 | 59 |
| 140 Joe White Rd | 0.60mi | 3/2.0 | 1,744 (+8%) | 6mo | $209,900 | $120 | 54 |
| 42 Winchester Cir | 0.63mi | 3/2.0 | 1,670 (+3%) | 14mo | $200,000 | $120 | 54 |
| 204 Cedarbrook Dr | 0.53mi | 3/2.0 | 1,376 (-15%) | 3mo | $159,900 | $116 | 48 |
| 529 Lakeside Dr | 0.52mi | 3/2.0 | 1,429 (-12%) | 12mo | $180,000 | $126 | 46 |
| 419 Bayou Oaks Dr | 0.58mi | 3/2.0 | 1,840 (+14%) | 10mo | $220,000 | $120 | 42 |
| 401 Bayou Oaks Dr | 0.60mi | 3/1.0 | 1,400 (-13%) | 7mo | $180,000 | $129 | 40 |
Match score weights: distance 35% · size 25% · config 20% · recency 20%. Top-matched comps best support the ARV.
Projected returns pro-forma
-3.0% appreciation · 3.0% rent growth · sell at horizon
- IRR
- 11.2%
- Equity multiple
- 1.44×
- Total profit
- $18,619
- Equity at exit
- $22,365
- IRR
- 20.2%
- Equity multiple
- 2.70×
- Total profit
- $71,558
- Equity at exit
- $12,969
Cash invested: $42,000 (down + closing). Projections, not guarantees.
Landlord ↔ Tenant lean methodology
- Overall (STATE)
- 90 Strongly Landlord-Friendly
- State Louisiana
- 90 Strongly Landlord-Friendly · R+12
- County
- — inherits STATE
- City
- — inherits STATE
ZIP-level market 71203
- Home prices YoY
- -32.4%
- Active inventory
- 437
- Price-to-rent
- 5.8×
Monthly cashflow live
- Estimated rent
- $2,151 medium interval (Pro) →
- Mortgage (P&I)
- −$787
- Tax from tax record
- −$177 /mo · $2,123/yr
- Insurance
- −$62
- HOA
- −$0
- Vacancy / Maint / Mgmt
- −$452
- Net cashflow
- $674
Break-even live
UW: 25.0% down · 7.5% · 30yr · 1.5% tax · 5.0% vac · 8.0% maint · 8.0% mgmt
Financing live
Cash to close
- Down payment
- $37,500
- Closing costs
- $4,500
- Reserves months
- —
- Total cash needed
- —
Loan-product check · same deal, 3 products live
Conventional
25% down · 7.5% · 30yr
- Down + closing
- —
- Monthly P&I
- —
- Monthly cashflow
- —
- DSCR
- —
- Eligible?
- —
Personal DTI + credit; lowest rate.
DSCR
20% down · 8.5% · 30yr
- Down + closing
- —
- Monthly P&I
- —
- Monthly cashflow
- —
- DSCR
- —
- Eligible?
- —
No personal income docs; deal must DSCR.
Hard money
10% down · 12.0% · 12mo
- Down + closing
- —
- Monthly P&I
- —
- Monthly cashflow
- —
- DSCR
- —
- Eligible?
- —
Short-term bridge; refi at stabilization.
Rent comps 2 comps
| Address | Beds | Baths | Sqft | Rent | $/sqft | DOM | Units | Dist |
|---|---|---|---|---|---|---|---|---|
| 396 Rowland Rd Monroe, LA | 4.0 | 2.5 | 2226 | $2,500 | $1.12 | 43d | 1 | 1.11mi |
| 182 Leisure Dr Monroe, LA | 3.0 | 2.0 | 1472 | $2,500 | $1.70 | 21d | 1 | 1.13mi |
Listing history 5 events
-
2026-06-19days on market $150,000 Active 4 DOM
-
2026-06-18days on market $150,000 Active 3 DOM
-
2026-06-17days on market $150,000 Active 2 DOM
-
2026-06-15remarks 585-char remark
-
2026-06-15$150,000 Active 1 DOM
ⓘ Source: listings_history table (triggers on properties + properties_extension) + one-shot
backfill from property_details.listing_events for pre-trigger history.
Tax reassessment forecast LA · Resets to sale price
- Current annual tax
- $2,123 · $177/mo
- Projected year-2 tax
- $2,123 · $177/mo
- Expected delta
- $0/yr ($0/mo · 0.0%)
ⓘ Screening estimate from a state-policy table — verify with the county assessor before closing.
Climate risk First Street
- Flood 1/10 Low FEMA zone X (unshaded) · 0% chance over 30 yrs
- Wildfire 2/10 Low
- Heat 7/10 Severe 7 d/yr ≥111°F today · 20 d/yr by 30 yrs out
- Wind 6/10 Major 74% chance of damaging wind over 30 yrs
- Air quality 2/10 Low 0 unhealthy d/yr today · 1 by 30 yrs out
Nearby sold comps map
Loading sold comps map…
Walkable amenities ~0.75 mi
Loading nearby amenities…
Taxation est. · year 1
- Rental income
- $25,816
- − Mortgage interest
- −$8,402
- − Property taxes
- −$2,123
- − Insurance
- −$750
- − Repairs & maintenance
- −$2,065
- − Management
- −$2,065
- − Depreciation
- −$4,364
- Taxable income
- $6,047
- Est. tax owed @ 24.0%
- −$1,451
- After-tax cash flow
- $6,631/yr
For passive investors: Depreciation is non-cash, so a rental often shows a tax loss while cash-flowing — sheltering income. Rental losses are passive: they offset passive income freely, and up to $25,000/yr can offset ordinary (W-2) income if you actively participate and your MAGI is under $100k (phasing out to $0 by $150k); unused losses carry forward. On sale, claimed depreciation is recaptured at up to 25%, and gains may owe capital-gains tax (a 1031 exchange can defer both). Figures are a year-1 estimate at your 24.0% rate — not tax advice; consult a CPA.
Schools (NCES district)
- District
- Ouachita Parish
- NCES district ID
- 2201200
- Math proficiency
- 31% ▼ -38.00%
- Reading proficiency
- 45% ▼ -31.00%
- Median HH income
- $43,316
- Composite
- 32.14/100
- National rank
- #5791
- State rank
- #26 of 98 in LA
Livability — Swartz
- Score
- 64/100
- State rank
- #184
- US rank
- #14862
Category grades
Schools grade is shown separately in the Schools card above.
Census & demographics
- County
- Ouachita Parish · 118,340 people
- City population
- 60,136
- Metro
- Monroe, LA
- Population (ZIP)
- 38,354
- Household income
- $52,326
- Rent vs Own
- Severe rent burden
- 2085.0
Population outlook (Ouachita County) Hauer SSP2
- Today (2025)
- 163,370 people
- By 2030
- 165,520 · +1.3%
- By 2040
- 167,652 · +2.6%
- By 2050
- 166,699 · +2.0%
- By 2075
- 156,348 · -4.3%
- By 2100
- 134,102 · -17.9%
Race, ethnicity, and origin ACS 2023
- Neighborhood character
- Diverse neighborhood (Simpson 0.57)
- Race & ethnicity
- Black 48% White 45% Two or more races 4% Hispanic / Latino 3% Asian 1%
- Common ancestry
- Lithuanian 3% Slovak 1% Serbian 1%
- Foreign-born
- 3% · Canada
- Languages at home
- 96% English-only · Spanish 2% Other Indo-European 1%
Political lean MEDSL · Ouachita
- 2024 margin
- Strong R (+27.9) · D 35.5% · R 63.3% · Other 1.2%
- 2008→2024 swing
- -2.7pp toward R · 2008: -25.2pp · 2024: -27.9pp
- All cycles
- 2024: R+27.9 2020: R+23.6 2016: R+25.4 2012: R+20.9 2008: R+25.2
Not yet ingested
- Civics
- —
Market trends
- HPI YoY
- ▼ -99.01%
- Current HPI
- 206.1948
- Rent YoY
- —
- Metro
- Monroe, LA
- State GDP YoY
- ▲ 3.29%
- F500 in state
- 10
Industry mix (Fortune 500 HQ in LA)
| Industry | F500 HQs | Revenue |
|---|---|---|
| Telecommunications | 2 | $23B |
|
||
| Utilities | 1 | $12B |
|
||
| Wholesale / Distribution | 1 | $5B |
|
||
| Advertising | 1 | $2B |
|
||
Price history
+3.4% since first listed3 events — show timeline
- 2026-06-15 Listed $150,000 NELABOR
- 2015-02-13 Sold (Public Records) $145,000 Public Records
- 2006-02-01 Sold (Public Records) — Public Records
Property tax history
+5.2%/yrLatest (2025): $2,123 · -0.7% YoY. Source: county tax records.
Cash-flow waterfall
monthlySold comps — $/sqft
last 12 mo · ≤1 miLoading sold comps…