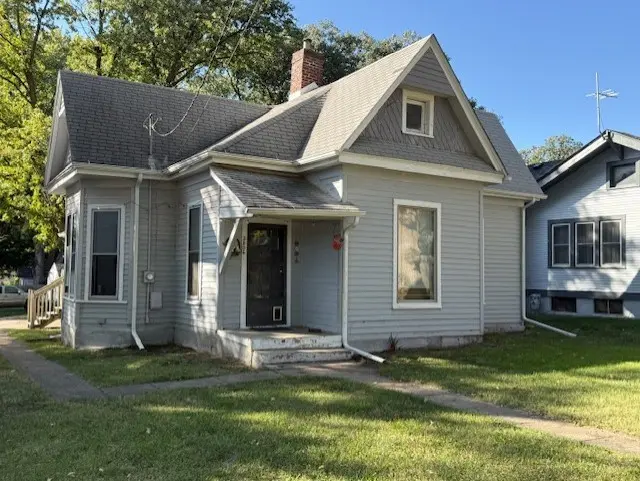
3806 12th St · Des Moines, IA
Flood risk 1/10 · Minimal
- FEMA flood zone
- X (unshaded)
- Chance of flooding over 30 yrs
- 0.0%
- Est. flood insurance / yr
- $473 – $860
Fire risk 3/10 · Minor
- Est. fire insurance / yr
- $902 – $1,676
Heat risk 3/10 · Minor
- Hot days now (above 103°F)
- 7 days/yr
- Hot days in 30 yrs
- 15 days/yr
Wind risk 2/10 · Minimal
- Chance of severe wind over 30 yrs
- —
Air-quality risk 2/10 · Minimal
- Unhealthy air days now
- 1 days/yr
- Unhealthy air days in 30 yrs
- 2 days/yr
Risk factors via First Street. Map © Google.
Why this score? — see what drove the D grade
The composite is a weighted blend of 9 inputs, each scored 0–100. Each bar is that input's sub-score; the figure is the points it added to the 100-point composite (weight × sub-score).
- ARV discount +15.0/15.0
- Cash flow +7.7/30.0
- Rent growth +5.0/5.0
- Livability +4.0/5.0
- Schools +3.8/10.0
- 1% rule +2.9/10.0
- Condition / age +2.5/5.0
- DSCR +1.8/10.0
- Appreciation +0.0/10.0
$129,000
🖨 Deal sheet 📄 Offer letter ✓ Due diligence
Listing remarks MLS
Rental property opportunity! Positive rental income of $1050 with a rental certificate good through June 2027. This would also make a great home for someone looking to add equity to their investment. Seller has a large portfolio. Ask for more info!
Key facts
- 6,600 sq ft lot
- 2 garage spots
- Built 1890
Neighborhood map
What this means for you Summary
Snapshot
- This is a 2-bed/1.0-bath single-family listed at $129k.
Deal economics
- At list price, monthly cash flow is $-149 ($-2k/yr) — negative.
- To cash-flow at today's rent, offer at most $103k (20.4% below list).
- To meet the 1% rule (rent ≥ 1% of price), the offer needs to be $102k (21.2% below list).
- Recommended offer: $102k (21.2% below list) — sets the bar for 1% rule.
- Cap rate 4.9% vs local median 3.1% in Des Moines — top-decile yield for the area; either an underpriced asset or a hidden risk that comps aren't pricing in. Stress-test before assuming the spread holds.
Location & tenants
- Location reads 81/100 on livability (#63 in IA, #1,432 nationally) — a professional / high-income tenant draw. Strengths: commute A+, cost of living A+, housing A+; Watch: employment C-, schools D+, crime F.
- Des Moines Independent Community School District (urban): math 43% / reading 46% proficiency, ranked #289 of 289 in IA (top 100%) — families likely to look elsewhere, expect single-tenant / working-renter base with shorter leases; 63% free/reduced lunch — lower-income household profile, screen leases tightly.
- Market conditions: Rents rising fast (+13.1%/yr); 154 active listings in the ZIP; 23 comparable units currently listed for rent nearby; rentals at typical pace (median 24d on market — plan ~3-4 weeks tenant-placement turnaround); 43% of comp listings sitting > 30 days — soft ceiling on asking rent; 2,953 units permitted in Polk County in 2024 (540 in 5+ unit buildings).
- This rent is only 18% of the median local income ($68k/yr) — well below the 30% rent-burden line; pricing power to push rent on renewal without tenant pushback.
Forward outlook
- Local home prices are declining (-3.0%/yr); year-one equity from $892 of loan paydown is wiped out by about $4k of value loss. Plan a longer hold.
- Polk County population projected at +37% by 2050 — long-run rental-demand tailwind backs the buy-and-hold thesis.
Negotiation context
- It's been on market 249 days — a 12% lower offer ($114k) is reasonable based on typical stale-listing flexibility.
- 10 sale attempts since 15y ago; this cycle's ask has dropped $44k (26%) from the opening price — seller is motivated, your offer sets the floor, not the list.
- Current owner paid $80k; list at $129k implies a 62% gain — meaningful room to come down on a strong offer.
Risks & watch-outs
- Watch-outs: built in 1890 — expect roof / HVAC / electrical / plumbing capex.
Questions for the listing agent
- What do current leases actually rent for vs. the listed asking? Can we see a recent rent roll and the last 12 months of T-12 income?
- It's been on market 249 days. Have you received any prior offers? Is the seller open to a 21% concession, seller financing, or rate buy-down credit?
- Built in 1890 — when were the roof, HVAC, electrical panel, plumbing, and water heater last replaced?
- Why hasn't it sold? Are there any deal-killer items the seller is aware of (foundation, flood, title, zoning, code violations)?
- Is there a deadline driving the sale (1031 exchange, divorce, estate, relocation)? That informs how much negotiation room exists.
- Schools are D-rated, which usually means shorter tenancies and higher turnover. Who's the typical renter profile here, and what's been the actual vacancy rate?
- Crime grade is F in this area — have there been break-ins, vandalism, or insurance claims at this property in the last 3 years? What carrier currently insures it and at what premium?
- The area grade is low — what's the realistic commute time and amenity access for the typical tenant pool here? Any planned neighborhood developments (good or bad) we should know about?
- What's the average days-on-market for RENTAL listings here right now (not sales)? A rising rental-DOM trend means longer vacancies and softer asking-rent achievability than the comps imply.
- What's the recent tenant-quality profile in this submarket — average credit score on applications, eviction rate, late-payment / NSF rate, and stable-employment percentage? A property-management company in the area should have these aggregated.
- How much new for-sale + rental construction is in the pipeline within 1–3 miles? Heavy new supply typically softens prices + rents 12–24 months out; constrained supply supports both.
Investment metrics
- 1% rule
- 0.79% ✗
- Cap rate
- 4.91%
- Cash-on-cash
- -4.95%
- DSCR
- 0.78
- GRM
- 10.6
CMA / ARV
- ARV (median comp)
- $188,664
- List price
- $129,000
- Delta
- -31.62%
- Verdict
- UNDERPRICED
- Comps
- 20 within 1.0 mi
Show comp detail 12 sales within ~0.75 mi
| Address | Dist | Beds/Ba | Sqft | Sold | Price | $/sf | Match |
|---|---|---|---|---|---|---|---|
| 1126 Seneca Ave | 0.11mi | 2/1.0 | 918 (-2%) | 1mo | $204,900 | $223 | 91 |
| 1300 Oak Park | 0.23mi | 2/1.0 | 892 (-4%) | 0mo | $165,000 | $185 | 82 |
| 1106 Douglas Ave | 0.12mi | 2/2.0 | 884 (-5%) | 0mo | $226,685 | $256 | 81 |
| 1125 Euclid Ave | 0.15mi | 2/2.0 | 880 (-6%) | 1mo | $118,000 | $134 | 79 |
| 3809 11th St | 0.16mi | 3/1.5 (+1) | 857 (-8%) | 1mo | $239,900 | $280 | 71 |
| 1424 Douglas Ave | 0.17mi | 2/1.0 | 816 (-13%) | 1mo | $77,000 | $94 | 70 |
| 4104 15th St | 0.42mi | 3/1.0 (+1) | 902 (-3%) | 3mo | $185,000 | $205 | 67 |
| 4104 14th St | 0.40mi | 2/1.5 | 1,008 (+8%) | 3mo | $220,000 | $218 | 64 |
| 3913 10th St | 0.26mi | 2/1.0 | 795 (-15%) | 2mo | $85,000 | $107 | 61 |
| 4030 8th Pl | 0.44mi | 3/1.5 (+1) | 842 (-10%) | 1mo | $171,000 | $203 | 55 |
| 4120 10th St | 0.45mi | 2/1.0 | 800 (-14%) | 4mo | $160,000 | $200 | 51 |
| 4129 5th Ave | 0.73mi | 2/1.0 | 1,032 (+10%) | 5mo | $177,500 | $172 | 44 |
Match score weights: distance 35% · size 25% · config 20% · recency 20%. Top-matched comps best support the ARV.
Projected returns pro-forma
-3.0% appreciation · 8.0% rent growth · sell at horizon
- IRR
- -18.8%
- Equity multiple
- 0.31×
- Total profit
- $-24,964
- Equity at exit
- $19,234
- IRR
- -3.1%
- Equity multiple
- 0.74×
- Total profit
- $-9,286
- Equity at exit
- $11,154
Cash invested: $36,120 (down + closing). Projections, not guarantees.
Landlord ↔ Tenant lean methodology
- Overall (STATE)
- 83 Strongly Landlord-Friendly
- State Iowa
- 83 Strongly Landlord-Friendly · R+6
- County
- — inherits STATE
- City
- — inherits STATE
ZIP-level market 50313
- Rents YoY
- 13.1%
- Active inventory
- 154
- Price-to-rent
- 10.6×
Monthly cashflow live
- Estimated rent
- $1,017 high interval (Pro) →
- Mortgage (P&I)
- −$676
- Tax from tax record
- −$222 /mo · $2,662/yr
- Insurance
- −$54
- HOA
- −$0
- Vacancy / Maint / Mgmt
- −$213
- Net cashflow
- $-149
Break-even live
UW: 25.0% down · 7.5% · 30yr · 1.5% tax · 5.0% vac · 8.0% maint · 8.0% mgmt
Financing live
Cash to close
- Down payment
- $32,250
- Closing costs
- $3,870
- Reserves months
- —
- Total cash needed
- —
Loan-product check · same deal, 3 products live
Conventional
25% down · 7.5% · 30yr
- Down + closing
- —
- Monthly P&I
- —
- Monthly cashflow
- —
- DSCR
- —
- Eligible?
- —
Personal DTI + credit; lowest rate.
DSCR
20% down · 8.5% · 30yr
- Down + closing
- —
- Monthly P&I
- —
- Monthly cashflow
- —
- DSCR
- —
- Eligible?
- —
No personal income docs; deal must DSCR.
Hard money
10% down · 12.0% · 12mo
- Down + closing
- —
- Monthly P&I
- —
- Monthly cashflow
- —
- DSCR
- —
- Eligible?
- —
Short-term bridge; refi at stabilization.
Rent comps 23 comps
| Address | Beds | Baths | Sqft | Rent | $/sqft | DOM | Units | Dist |
|---|---|---|---|---|---|---|---|---|
| 3905 8th St Des Moines, IA | 1.0 | 1.0 | 675 | $895 | $1.33 | 23d | 1 | 0.43mi |
| 4124 3rd St Des Moines, IA | 3.0 | 1.0 | 996 | $1,595 | $1.60 | 14d | 1 | 0.81mi |
| 3700 Martin Luther King Junior Pkwy Unit 18 Des Moines, IA | 2.0 | 1.0 | 730 | $750 | $1.03 | 43d | 1 | 0.88mi |
| 3419 1st St Unit 2 Des Moines, IA | 1.0 | 1.0 | 546 | $650 | $1.19 | 43d | 1 | 0.89mi |
| 2411 Welbeck Rd #11 Des Moines, IA | 2.0 | 1.0 | 750 | $745 | $0.99 | 43d | 1 | 0.89mi |
| 2411 Welbeck Rd #7 Des Moines, IA | 2.0 | 1.0 | 750 | $845 | $1.13 | 43d | 1 | 0.89mi |
| 2533 Lynner Dr Des Moines, IA | 2.0 | 1.0 | 800 | $900 | $1.12 | 43d | 1 | 0.94mi |
| 2525 Clarkson Ave Unit 04 Des Moines, IA | 2.0 | 1.0 | 775 | $895 | $1.15 | 43d | 1 | 0.95mi |
| 3623 Cambridge St Des Moines, IA | 2.0 | 1.0 | 732 | $1,145 | $1.56 | 19d | 1 | 0.99mi |
| 2715 Douglas Ave Des Moines, IA | 3.0 | 2.0 | 1109 | $1,408 | $1.27 | 14d | 1 | 1.01mi |
| 2501 24th St Unit 101 Des Moines, IA | 2.0 | 1.0 | 750 | $725 | $0.97 | 23d | 1 | 1.20mi |
| 2501 24th St Unit 111 Des Moines, IA | 2.0 | 1.0 | 750 | $760 | $1.01 | 23d | 1 | 1.20mi |
| 2501 24th St Apt 107 Des Moines, IA | 3.0 | 2.0 | 950 | $1,045 | $1.10 | 14d | 1 | 1.20mi |
| 2501 24th St Unit 113 Des Moines, IA | 2.0 | 1.0 | 750 | $945 | $1.26 | 43d | 1 | 1.20mi |
| 2501 24th St Des Moines, IA | 2.0 | 1.0 | 910 | $795 | $0.87 | 23d | 1 | 1.20mi |
| 2501 24th St Unit 121 Des Moines, IA | 3.0 | 2.0 | 950 | $995 | $1.05 | 23d | 1 | 1.20mi |
| 2413 24th St Unit 3 Des Moines, IA | 2.0 | 1.0 | 600 | $725 | $1.21 | 43d | 1 | 1.22mi |
| 2901 Boston Ave Des Moines, IA | 1.0–2.0 | 1.0–1.5 | 707 | $1,300 | $1.84 | 14d | 7 | 1.26mi |
| 1914 10th St Des Moines, IA | 2.0 | 1.0 | 740 | $1,050 | $1.42 | 23d | 1 | 1.27mi |
| 1914 10th St Des Moines, IA | 2.0 | 1.0 | 740 | $1,050 | $1.42 | 43d | 1 | 1.27mi |
| 3120 Douglas Ave Des Moines, IA | 2.0 | 1.0 | 850 | $970 | $1.14 | 14d | 3 | 1.33mi |
| 3103 E 7th St Des Moines, IA | 2.0 | 1.0 | 960 | $1,200 | $1.25 | 43d | 1 | 1.40mi |
| 2110 26th St Apt 11 Des Moines, IA | 2.0 | 1.0 | 628 | $925 | $1.47 | 19d | 1 | 1.41mi |
Listing history 45 events
-
2026-06-18days on market $129,000 Active 249 DOM
-
2026-06-17days on market $129,000 Active 248 DOM
-
2026-06-16days on market $129,000 Active 247 DOM
-
2026-06-15days on market $129,000 Active 246 DOM
-
2026-06-14days on market $129,000 Active 244 DOM
-
2026-06-13days on market $129,000 Active 243 DOM
-
2026-06-10days on market $129,000 Active 241 DOM
-
2026-06-09days on market $129,000 Active 240 DOM
-
2026-06-08days on market $129,000 Active 239 DOM
-
2026-06-07days on market $129,000 Active 238 DOM
-
2026-06-05days on market $129,000 Active 235 DOM
-
2026-06-03days on market $129,000 Active 234 DOM
-
2026-06-02days on market $129,000 Active 233 DOM
-
2026-06-01days on market $129,000 Active 232 DOM
-
2026-05-31days on market $129,000 Active 231 DOM
-
2026-05-31days on market $129,000 Active 230 DOM
-
2026-04-10price $129,000 248-char remark
Show marketing remark (252 chars)
Rental property opportunity! Positive rental income of $1050 with a rental certificate good through June 2027. This would also make a great home for someone looking to add equity to their investment. The seller has a large portfolio. Ask for more info!
-
2026-04-10status Active 248-char remark
Show marketing remark (252 chars)
Rental property opportunity! Positive rental income of $1050 with a rental certificate good through June 2027. This would also make a great home for someone looking to add equity to their investment. The seller has a large portfolio. Ask for more info!
-
2026-04-10status Active 252-char remark
Show marketing remark (252 chars)
Rental property opportunity! Positive rental income of $1050 with a rental certificate good through June 2027. This would also make a great home for someone looking to add equity to their investment. The seller has a large portfolio. Ask for more info!
-
2026-04-10price $129,000 252-char remark
Show marketing remark (252 chars)
Rental property opportunity! Positive rental income of $1050 with a rental certificate good through June 2027. This would also make a great home for someone looking to add equity to their investment. The seller has a large portfolio. Ask for more info!
-
2026-04-08historical 248-char remark
Show marketing remark (248 chars)
Rental property opportunity! Positive rental income of $1050 with a rental certificate good through June 2027. This would also make a great home for someone looking to add equity to their investment. Seller has a large portfolio. Ask for more info!
-
2026-04-07historical 252-char remark
Show marketing remark (252 chars)
Rental property opportunity! Positive rental income of $1050 with a rental certificate good through June 2027. This would also make a great home for someone looking to add equity to their investment. The seller has a large portfolio. Ask for more info!
-
2026-02-25price $150,000 252-char remark
Show marketing remark (252 chars)
Rental property opportunity! Positive rental income of $1050 with a rental certificate good through June 2027. This would also make a great home for someone looking to add equity to their investment. The seller has a large portfolio. Ask for more info!
-
2025-11-15price $160,000 252-char remark
Show marketing remark (252 chars)
Rental property opportunity! Positive rental income of $1050 with a rental certificate good through June 2027. This would also make a great home for someone looking to add equity to their investment. The seller has a large portfolio. Ask for more info!
-
2025-10-09$150,000 Active 248-char remark
Show marketing remark (252 chars)
Rental property opportunity! Positive rental income of $1050 with a rental certificate good through June 2027. This would also make a great home for someone looking to add equity to their investment. The seller has a large portfolio. Ask for more info!
-
2025-10-09$173,500 Active 252-char remark
Show marketing remark (252 chars)
Rental property opportunity! Positive rental income of $1050 with a rental certificate good through June 2027. This would also make a great home for someone looking to add equity to their investment. The seller has a large portfolio. Ask for more info!
-
2025-10-01historical
-
2025-08-14$185,000 Active
-
2019-12-06soldstatus $79,500
-
2019-12-04soldstatus $79,500 Closed
-
2019-12-03status Pending
-
2019-11-18status Pending
-
2019-10-10price $87,400
-
2019-09-11status Active
-
2019-09-08historical
-
2019-06-07price $93,500
-
2019-04-11price $94,900
-
2019-01-21status Active
-
2019-01-16historical
-
2018-11-27status Active
-
2018-10-23status Pending
-
2018-10-01price $99,500
-
2018-09-07$104,900 Active
-
2012-09-06historical
-
2011-11-03$64,900
ⓘ Source: listings_history table (triggers on properties + properties_extension) + one-shot
backfill from property_details.listing_events for pre-trigger history.
Tax reassessment forecast IA · Partial reset (capped growth)
- Current annual tax
- $2,662 · $222/mo
- Projected year-2 tax
- $2,662 · $222/mo
- Expected delta
- $0/yr ($0/mo · 0.0%)
ⓘ Screening estimate from a state-policy table — verify with the county assessor before closing.
Climate risk First Street
- Flood 1/10 Low FEMA zone X (unshaded) · 0% chance over 30 yrs
- Wildfire 3/10 Moderate
- Heat 3/10 Moderate 7 d/yr ≥103°F today · 15 d/yr by 30 yrs out
- Wind 2/10 Low
- Air quality 2/10 Low 1 unhealthy d/yr today · 2 by 30 yrs out
Nearby sold comps map
Loading sold comps map…
Walkable amenities ~0.75 mi
Loading nearby amenities…
Taxation est. · year 1
- Rental income
- $12,200
- − Mortgage interest
- −$7,226
- − Property taxes
- −$2,662
- − Insurance
- −$645
- − Repairs & maintenance
- −$976
- − Management
- −$976
- − Depreciation
- −$3,753
- Taxable loss
- −$4,038
- Est. tax savings @ 24.0%
- +$969
- After-tax cash flow
- $-818/yr
For passive investors: Depreciation is non-cash, so a rental often shows a tax loss while cash-flowing — sheltering income. Rental losses are passive: they offset passive income freely, and up to $25,000/yr can offset ordinary (W-2) income if you actively participate and your MAGI is under $100k (phasing out to $0 by $150k); unused losses carry forward. On sale, claimed depreciation is recaptured at up to 25%, and gains may owe capital-gains tax (a 1031 exchange can defer both). Figures are a year-1 estimate at your 24.0% rate — not tax advice; consult a CPA.
Schools (NCES district)
- District
- Des Moines Independent Community School District
- NCES district ID
- 1908970
- Math proficiency
- 43% ▼ -6.00%
- Reading proficiency
- 46% ▼ -1.00%
- Median HH income
- $45,905
- Composite
- 37.83/100
- National rank
- #4331
- State rank
- #289 of 289 in IA
Livability — Des Moines
- Score
- 81/100
- State rank
- #63
- US rank
- #1432
Category grades
Schools grade is shown separately in the Schools card above.
Census & demographics
- Census place
- Des Moines, IA
- County
- Polk County · 453,298 people
- City population
- 203,612
- Metro
- Des Moines-West Des Moines, IA
- Population (ZIP)
- 17,440
- Household income
- $68,361
- Rent vs Own
- Severe rent burden
- 454.0
Population outlook (Polk County) Hauer SSP2
- Today (2025)
- 548,042 people
- By 2030
- 588,557 · +7.4%
- By 2040
- 670,629 · +22.4%
- By 2050
- 752,830 · +37.4%
- By 2075
- 955,069 · +74.3%
- By 2100
- 1,115,436 · +103.5%
Race, ethnicity, and origin ACS 2023
- Neighborhood character
- Diverse neighborhood (Simpson 0.58)
- Race & ethnicity
- White 61% Hispanic / Latino 17% Black 11% Two or more races 8% Asian 6%
- Hispanic origin (detail)
- Mexican 11%
- Common ancestry
- Iranian 3% Portuguese 2% Scotch-Irish 2%
- Foreign-born
- 16% · Canada, Philippines, Vietnam
- Languages at home
- 75% English-only · Spanish 14% Other Asian/Pacific 4% Russian/Polish/Slavic 1%
Political lean MEDSL · Polk
- 2024 margin
- D (+10.9) · D 54.8% · R 43.9% · Other 1.3%
- 2008→2024 swing
- -3.7pp toward R · 2008: 14.6pp · 2024: 10.9pp
- All cycles
- 2024: D+10.9 2020: D+15.2 2016: D+11.5 2012: D+14.2 2008: D+14.6
Not yet ingested
- Civics
- —
Market trends
- HPI YoY
- ▼ -162.17%
- Current HPI
- 285.5708
- Rent YoY
- ▲ 13.11%
- Metro
- Des Moines-West Des Moines, IA
- State GDP YoY
- ▲ 2.48%
- F500 in state
- 4
Industry mix (Fortune 500 HQ in IA)
| Industry | F500 HQs | Revenue |
|---|---|---|
| Financial Services | 1 | $16B |
|
||
| Retail / Convenience | 1 | $15B |
|
||
Price history
+98.8% since first listed29 events — show timeline
- 2026-04-10 Price Changed $129,000 CIBOR
- 2026-04-10 Relisted — CIBOR
- 2026-04-10 Relisted — DMMLS
- 2026-04-10 Price Changed $129,000 DMMLS
- 2026-04-08 Delisted — CIBOR
- 2026-04-07 Listing Removed — DMMLS
- 2026-02-25 Price Changed $150,000 DMMLS
- 2025-11-15 Price Changed $160,000 DMMLS
- 2025-10-09 Listed $173,500 DMMLS
- 2025-10-09 Listed $150,000 CIBOR
- 2025-10-01 Listing Removed — DMMLS
- 2025-08-14 Listed $185,000 DMMLS
- 2019-12-06 Sold (Public Records) $79,500 Public Records
- 2019-12-04 Sold (MLS) $79,500 DMMLS
- 2019-12-03 Pending — DMMLS
- 2019-11-18 Pending — DMMLS
- 2019-10-10 Price Changed $87,400 DMMLS
- 2019-09-11 Relisted — DMMLS
- 2019-09-08 Listing Removed — DMMLS
- 2019-06-07 Price Changed $93,500 DMMLS
- 2019-04-11 Price Changed $94,900 DMMLS
- 2019-01-21 Relisted — DMMLS
- 2019-01-16 Listing Removed — DMMLS
- 2018-11-27 Relisted — DMMLS
- 2018-10-23 Pending — DMMLS
- 2018-10-01 Price Changed $99,500 DMMLS
- 2018-09-07 Listed $104,900 DMMLS
- 2012-09-06 Listing Removed — DMMLS
- 2011-11-03 Listed $64,900 DMMLS
Property tax history
+3.6%/yrLatest (2025): $2,662 · +2.1% YoY. Source: county tax records.
Cash-flow waterfall
monthlySold comps — $/sqft
last 12 mo · ≤1 miLoading sold comps…