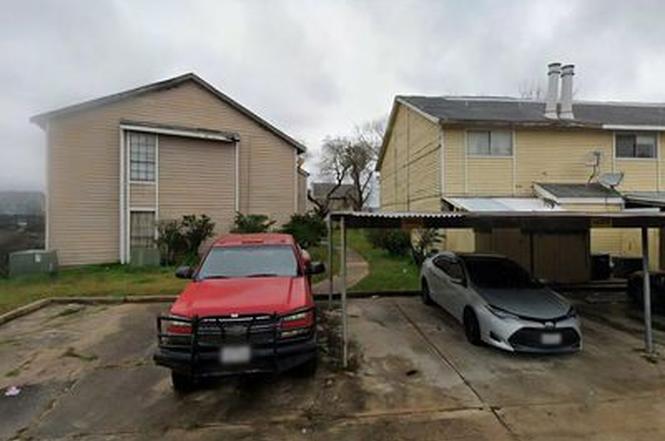
8323 Wilcrest Dr · Houston, TX
Flood risk 7/10 · Major
- FEMA flood zone
- AE
- Chance of flooding over 30 yrs
- 0.95%
- Est. flood insurance / yr
- $1,737 – $8,500
Fire risk 1/10 · Minimal
- Est. fire insurance / yr
- $1,222 – $2,270
Heat risk 9/10 · Severe
- Hot days now (above 111°F)
- 7 days/yr
- Hot days in 30 yrs
- 23 days/yr
Wind risk 9/10 · Severe
- Chance of severe wind over 30 yrs
- 99.0%
Air-quality risk 2/10 · Minimal
- Unhealthy air days now
- 2 days/yr
- Unhealthy air days in 30 yrs
- 2 days/yr
Risk factors via First Street. Map © Google.
Why this score? — see what drove the B- grade
The composite is a weighted blend of 9 inputs, each scored 0–100. Each bar is that input's sub-score; the figure is the points it added to the 100-point composite (weight × sub-score).
- Cash flow +30.0/30.0
- 1% rule +10.0/10.0
- DSCR +10.0/10.0
- ARV discount +7.5/15.0
- Livability +3.7/5.0
- Rent growth +2.5/5.0
- Condition / age +2.5/5.0
- Schools +2.1/10.0
- Appreciation +0.0/10.0
$49,000
🖨 Deal sheet 📄 Offer letter ✓ Due diligence
Listing remarks MLS
Nice 2 bedroom, 1.5 bath!! Great location close to Beltway 8 and Westpark tollway. Very well maintained with ceramic tile downstaris and a new carpet upstairs, fesh paint.
Key facts
- Built 1978
- Listed 4 days
Property features AI
Exterior
- Home design: Built in 1978
- Construction: Living area approximately 888
- Exterior features: Located in the Alief subdivision
Neighborhood map
What this means for you Summary
Snapshot
- This is a 2-bed/1.0-bath land listed at $49k.
Deal economics
- At list price, monthly cash flow is $100 ($1k/yr) — positive.
- The deal already cash-flows at list — no discount required.
- Meets the 1% rule at list price ($1k rent vs $49k).
- Cap rate 19.2% vs local median 3.2% in Houston — top-decile yield for the area; either an underpriced asset or a hidden risk that comps aren't pricing in. Stress-test before assuming the spread holds.
Location & tenants
- Location reads 74/100 on livability (#184 in TX, #4,771 nationally) — a middle-class / working-renter tenant base. Strengths: amenities A+, cost of living A+, housing A+; Watch: schools D, crime F.
- Alief ISD (urban): math 23% / reading 28% proficiency, ranked #717 of 826 in TX (top 87%) — low school quality limits family demand, transient renter base, plan for 1-2y turnover; 74% free/reduced lunch — lower-income household profile, screen leases tightly.
- Market conditions: Rents flat; 204 active listings in the ZIP; 40 comparable units currently listed for rent nearby; rentals leasing fast (median 13d on market — plan ~1-2 weeks tenant-placement turnaround); 29,883 units permitted in Harris County in 2024 (8,621 in 5+ unit buildings).
Forward outlook
- Local home prices are declining (-3.0%/yr); year-one equity from $339 of loan paydown is wiped out by about $1k of value loss. Plan a longer hold.
- Harris County population projected at +47% by 2050 — long-run rental-demand tailwind backs the buy-and-hold thesis.
Negotiation context
- Only 5 days on market — expect competitive offers; lowballing is unlikely to land.
- 14 sale attempts since 22y ago with the ask held roughly flat each time — persistent listings suggest the price (not the market) is what's stuck; bring a comps-based counter.
Risks & watch-outs
- Watch-outs: flood insurance adds $427/mo.
- Climate carrying-cost: in FEMA flood zone AE (mandatory federal flood insurance); severe wind risk, 99% chance of damaging wind over 30y; extreme-heat days projected 7→23/yr by 2055 (HVAC capex compounding) — expect insurance premiums to compound above CPI over the hold.
Questions for the listing agent
- Built in 1978 — when were the roof, HVAC, electrical panel, plumbing, and water heater last replaced?
- What's the actual annual flood-insurance premium (NFIP or private), and is the property in a SFHA with mandatory coverage?
- Is there a deadline driving the sale (1031 exchange, divorce, estate, relocation)? That informs how much negotiation room exists.
- Schools are D-rated, which usually means shorter tenancies and higher turnover. Who's the typical renter profile here, and what's been the actual vacancy rate?
- Crime grade is F in this area — have there been break-ins, vandalism, or insurance claims at this property in the last 3 years? What carrier currently insures it and at what premium?
- What's the average days-on-market for RENTAL listings here right now (not sales)? A rising rental-DOM trend means longer vacancies and softer asking-rent achievability than the comps imply.
- What's the recent tenant-quality profile in this submarket — average credit score on applications, eviction rate, late-payment / NSF rate, and stable-employment percentage? A property-management company in the area should have these aggregated.
- How much new for-sale + rental construction is in the pipeline within 1–3 miles? Heavy new supply typically softens prices + rents 12–24 months out; constrained supply supports both.
Investment metrics
- 1% rule
- 2.23% ✓
- Cap rate
- 19.18%
- Cash-on-cash
- 46.02%
- DSCR
- 3.05
- GRM
- 3.7
CMA / ARV
No comps found within radius.
Projected returns pro-forma
-3.0% appreciation · 0.05% rent growth · sell at horizon
- IRR
- -9.4%
- Equity multiple
- 0.67×
- Total profit
- $-4,471
- Equity at exit
- $7,306
- IRR
- -11.5%
- Equity multiple
- 0.50×
- Total profit
- $-6,799
- Equity at exit
- $4,237
Cash invested: $13,720 (down + closing). Projections, not guarantees.
Landlord ↔ Tenant lean methodology
- Overall (STATE)
- 87 Strongly Landlord-Friendly
- State Texas
- 87 Strongly Landlord-Friendly · R+5
- County
- — inherits STATE
- City
- — inherits STATE
ZIP-level market 77072
- Home prices YoY
- -26.4%
- Rents YoY
- 0.1%
- Active inventory
- 204
- Price-to-rent
- 3.7×
Monthly cashflow live
- Estimated rent
- $1,095 high interval (Pro) →
- Mortgage (P&I)
- −$257
- Tax est. 1.5%
- −$61 /mo · $735/yr
- Insurance
- −$20
- Flood insurance flood zone
- −$427 /mo · $5,118/yr
- HOA
- −$0
- Vacancy / Maint / Mgmt
- −$230
- Net cashflow
- $100
Break-even live
UW: 25.0% down · 7.5% · 30yr · 1.5% tax · 5.0% vac · 8.0% maint · 8.0% mgmt
Financing live
Cash to close
- Down payment
- $12,250
- Closing costs
- $1,470
- Reserves months
- —
- Total cash needed
- —
Loan-product check · same deal, 3 products live
Conventional
25% down · 7.5% · 30yr
- Down + closing
- —
- Monthly P&I
- —
- Monthly cashflow
- —
- DSCR
- —
- Eligible?
- —
Personal DTI + credit; lowest rate.
DSCR
20% down · 8.5% · 30yr
- Down + closing
- —
- Monthly P&I
- —
- Monthly cashflow
- —
- DSCR
- —
- Eligible?
- —
No personal income docs; deal must DSCR.
Hard money
10% down · 12.0% · 12mo
- Down + closing
- —
- Monthly P&I
- —
- Monthly cashflow
- —
- DSCR
- —
- Eligible?
- —
Short-term bridge; refi at stabilization.
Rent comps 40 comps
| Address | Beds | Baths | Sqft | Rent | $/sqft | DOM | Units | Dist |
|---|---|---|---|---|---|---|---|---|
| 10615 Beechnut St Houston, TX | 1.0–3.0 | 1.0–2.0 | 940 | $972 | $1.03 | 2d | 16 | 0.09mi |
| 8323 Cinnamon Ln Houston, TX | 1.0–3.0 | 1.0–2.0 | 937 | $1,000 | $1.07 | 12d | 1 | 0.19mi |
| 10555 Spice Ln Houston, TX | 1.0–3.0 | 1.0–2.0 | 937 | $985 | $1.05 | 1d | 16 | 0.20mi |
| 8310 S Course Dr Houston, TX | 2.0 | 2.0 | 918 | $965 | $1.05 | 43d | 1 | 0.26mi |
| 10522 Beechnut St Houston, TX | 1.0–3.0 | 1.0–2.5 | 1015 | $1,024 | $1.01 | 2d | 14 | 0.32mi |
| 10215 Beechnut St Unit 1047 Houston, TX | 1.0 | 1.0 | 705 | $809 | $1.15 | 11d | 1 | 0.36mi |
| 10215 Beechnut St Unit 10236 Houston, TX | 1.0 | 1.0 | 705 | $859 | $1.22 | 12d | 1 | 0.36mi |
| 10215 Beechnut St Unit 10266 Houston, TX | 1.0 | 1.0 | 705 | $758 | $1.08 | 12d | 1 | 0.36mi |
| 10215 Beechnut St Unit 1162 Houston, TX | 1.0 | 1.0 | 705 | $769 | $1.09 | 7d | 1 | 0.36mi |
| 10215 Beechnut St Unit 10289 Houston, TX | 1.0 | 1.0 | 705 | $766 | $1.09 | 2d | 1 | 0.36mi |
| 10215 Beechnut St Houston, TX | 1.0 | 1.0 | 705 | $854 | $1.21 | 12d | 1 | 0.38mi |
| 8039 Boone Rd Houston, TX | 1.0–3.0 | 1.0–2.5 | 938 | $1,262 | $1.35 | 12d | 18 | 0.39mi |
| 8600 S Course Dr Houston, TX | 1.0–2.0 | 1.0–2.0 | 706 | $1,218 | $1.72 | 1d | 31 | 0.45mi |
| 8606 S Course Dr Houston, TX | 2.0 | 2.0 | 913 | $1,050 | $1.15 | 43d | 1 | 0.51mi |
| 10027 Spice Ln Houston, TX | 2.0 | 1.0–2.0 | 1097 | $1,180 | $1.08 | 7d | 12 | 0.55mi |
| 9255 W Sam Houston Pkwy S Houston, TX | 1.0 | 1.0 | 750 | $1,049 | $1.40 | 43d | 1 | 0.67mi |
| 14 W Sam Houston Pkwy S Houston, TX | 1.0 | 1.0 | 619 | $779 | $1.26 | 43d | 1 | 0.80mi |
| 14 W Sam Houston Pkwy S Houston, TX | 2.0 | 2.0 | 1000 | $1,054 | $1.05 | 24d | 1 | 0.80mi |
| 14 W Sam Houston Pkwy S Houston, TX | 1.0 | 1.0 | 619 | $779 | $1.26 | 22d | 1 | 0.80mi |
| 9475 W Sam Houston Pkwy S Houston, TX | 1.0–2.0 | 1.0–2.0 | 725 | $1,284 | $1.77 | 5d | 18 | 0.85mi |
| 9430 Concourse Dr Houston, TX | 1.0 | 1.0 | 719 | $842 | $1.17 | 12d | 1 | 0.92mi |
| 9445 Concourse Dr Houston, TX | 1.0–2.0 | 1.0–2.0 | 715 | $1,104 | $1.54 | 1d | 21 | 0.96mi |
| 10000 Club Creek Dr Houston, TX | 2.0 | 1.0–2.0 | 670 | $1,015 | $1.51 | 10d | 1 | 1.05mi |
| 9501 Beechnut St Unit 216 Houston, TX | 1.0 | 1.0 | 660 | $775 | $1.17 | 22d | 1 | 1.07mi |
| 9501 Beechnut St Unit 811 Houston, TX | 2.0 | 2.0 | 850 | $1,010 | $1.19 | 22d | 1 | 1.07mi |
| 9501 Beechnut St Unit 803 Houston, TX | 2.0 | 2.0 | 850 | $1,010 | $1.19 | 24d | 1 | 1.07mi |
| 9501 Beechnut St Unit 707 Houston, TX | 1.0 | 1.0 | 660 | $775 | $1.17 | 24d | 1 | 1.07mi |
| 9901 Club Creek Dr Houston, TX | 1.0–3.0 | 1.0–2.0 | 855 | $992 | $1.16 | 1d | 13 | 1.08mi |
| 9502 Woodfair Dr Houston, TX | 1.0–2.0 | 1.0 | 636 | $950 | $1.49 | 43d | 31 | 1.14mi |
| 9502 Woodfair Dr Houston, TX | 1.0–2.0 | 1.0–2.0 | 711 | $1,093 | $1.54 | 3d | 31 | 1.14mi |
| 9303 Woodfair Dr Houston, TX | 1.0–2.0 | 1.0–2.0 | 791 | $1,045 | $1.32 | 43d | 42 | 1.15mi |
| 9797 Leawood Blvd Houston, TX | 2.0 | 2.0 | 1095 | $1,175 | $1.07 | 43d | 2 | 1.18mi |
| 8181 Colony St Unit 422 Houston, TX | 2.0 | 2.0 | 796 | $940 | $1.18 | 7d | 1 | 1.20mi |
| 10225 Bissonnet St Houston, TX | 1.0–2.0 | 1.0–2.5 | 992 | $1,480 | $1.49 | 1d | 49 | 1.21mi |
| 9700 Leawood Blvd Houston, TX | 1.0–2.0 | 1.0–2.0 | 776 | $1,400 | $1.80 | 3d | 5 | 1.21mi |
| 9700 Leawood Blvd Houston, TX | 1.0–2.0 | 1.0–2.0 | 776 | $1,400 | $1.80 | 43d | 7 | 1.21mi |
| 8181 Colony Dr Unit 8255 Houston, TX | 1.0 | 1.0 | 602 | $692 | $1.15 | 2d | 1 | 1.21mi |
| 8181 Colony Dr Unit 8232 Houston, TX | 1.0 | 1.0 | 602 | $684 | $1.14 | 12d | 1 | 1.21mi |
| 8181 Colony Dr Unit 1162 Houston, TX | 1.0 | 1.0 | 602 | $695 | $1.15 | 7d | 1 | 1.21mi |
| 8181 Colony Dr Unit 8255 Houston, TX | 1.0 | 1.0 | 602 | $730 | $1.21 | 12d | 1 | 1.21mi |
Listing history 5 events
-
2026-06-18days on market $49,000 Active 5 DOM
-
2026-06-17days on market $49,000 Active 4 DOM
-
2026-06-16days on market $49,000 Active 3 DOM
-
2026-06-15remarks 122-char remark
-
2026-06-15$49,000 Active 2 DOM
ⓘ Source: listings_history table (triggers on properties + properties_extension) + one-shot
backfill from property_details.listing_events for pre-trigger history.
Climate risk First Street
- Flood 7/10 Severe FEMA zone AE · 95% chance over 30 yrs
- Wildfire 1/10 Low
- Heat 9/10 Extreme 7 d/yr ≥111°F today · 23 d/yr by 30 yrs out
- Wind 9/10 Extreme 99% chance of damaging wind over 30 yrs
- Air quality 2/10 Low 2 unhealthy d/yr today · 2 by 30 yrs out
Nearby sold comps map
Loading sold comps map…
Walkable amenities ~0.75 mi
Loading nearby amenities…
Taxation est. · year 1
- Rental income
- $13,136
- − Mortgage interest
- −$2,745
- − Property taxes
- −$735
- − Insurance
- −$5,364
- − Repairs & maintenance
- −$1,051
- − Management
- −$1,051
- − Depreciation
- −$1,425
- Taxable income
- $766
- Est. tax owed @ 24.0%
- −$184
- After-tax cash flow
- $1,012/yr
For passive investors: Depreciation is non-cash, so a rental often shows a tax loss while cash-flowing — sheltering income. Rental losses are passive: they offset passive income freely, and up to $25,000/yr can offset ordinary (W-2) income if you actively participate and your MAGI is under $100k (phasing out to $0 by $150k); unused losses carry forward. On sale, claimed depreciation is recaptured at up to 25%, and gains may owe capital-gains tax (a 1031 exchange can defer both). Figures are a year-1 estimate at your 24.0% rate — not tax advice; consult a CPA.
Schools (NCES district)
- District
- Alief ISD
- NCES district ID
- 4807830
- Math proficiency
- 23% ▼ -19.00%
- Reading proficiency
- 28% ▼ -8.00%
- Median HH income
- $37,775
- Composite
- 21.29/100
- National rank
- #8391
- State rank
- #717 of 826 in TX
Livability — Houston
- Score
- 74/100
- State rank
- #184
- US rank
- #4771
Category grades
Schools grade is shown separately in the Schools card above.
Census & demographics
- Census place
- Houston, TX
- County
- Harris County · 4,702,590 people
- City population
- 3,226,434
- Metro
- Houston-The Woodlands-Sugar Land, TX
- Population (ZIP)
- 57,108
- Household income
- $51,070
- Rent vs Own
- Severe rent burden
- 3500.0
Population outlook (Harris County) Hauer SSP2
- Today (2025)
- 5,571,493 people
- By 2030
- 6,089,821 · +9.3%
- By 2040
- 7,142,806 · +28.2%
- By 2050
- 8,185,864 · +46.9%
- By 2075
- 10,574,329 · +89.8%
- By 2100
- 12,109,958 · +117.4%
Race, ethnicity, and origin ACS 2023
- Neighborhood character
- Diverse neighborhood (Simpson 0.68)
- Race & ethnicity
- Hispanic / Latino 45% Asian 24% Black 23% Two or more races 19% White 5% Native American 2%
- Hispanic origin (detail)
- Mexican 24% Puerto Rican 2%
- Foreign-born
- 52% · Canada, Vietnam, China
- Languages at home
- 30% English-only · Spanish 40% Vietnamese 16% Chinese 3%
Political lean MEDSL · Harris
- 2024 margin
- Lean D (+5.5) · D 52.0% · R 46.4% · Other 1.6%
- 2008→2024 swing
- +3.9pp toward D · 2008: 1.6pp · 2024: 5.5pp
- All cycles
- 2024: D+5.5 2020: D+13.3 2016: D+12.4 2012: D+0.1 2008: D+1.6
Not yet ingested
- Civics
- —
Market trends
- HPI YoY
- ▼ -130.12%
- Current HPI
- 362.1985
- Rent YoY
- ▬ 0.05%
- Metro
- Houston-The Woodlands-Sugar Land, TX
- State GDP YoY
- ▲ 3.95%
- F500 in state
- 110
Industry mix (Fortune 500 HQ in TX)
| Industry | F500 HQs | Revenue |
|---|---|---|
| Energy | 16 | $1,198B |
|
||
| Technology | 5 | $198B |
|
||
| Engineering / Construction | 4 | $72B |
|
||
| Energy Services | 3 | $60B |
|
||
| Utilities | 3 | $41B |
|
||
| Healthcare | 2 | $330B |
|
||
Price history
+9.1% since first listed30 events — show timeline
- 2026-06-14 Listed $49,000 FSBO.com
- 2025-01-16 Rental Removed $989 HARMLS
- 2024-10-20 Price Changed $989 HARMLS
- 2024-10-08 Listed for Rent $1,450 HARMLS
- 2024-09-25 Rental Removed $600 RENTALBEAST
- 2024-09-21 Rental Removed $600 SHOWMOJO
- 2024-09-21 Listed for Rent $600 RENTALBEAST
- 2024-09-19 Listed for Rent $600 SHOWMOJO
- 2014-06-05 Listing Removed — HARMLS
- 2014-06-05 Sold (MLS) — HARMLS
- 2014-04-01 Listed $35,000 HARMLS
- 2013-05-04 Listing Removed — HARMLS
- 2013-03-27 Listed $33,000 HARMLS
- 2012-05-09 Listing Removed — HARMLS
- 2012-03-16 Listed $25,000 HARMLS
- 2010-05-14 Sold (MLS) — HARMLS
- 2010-04-22 Listing Removed — HARMLS
- 2010-04-02 Listed $11,000 HARMLS
- 2007-03-30 Listing Removed — HARMLS
- 2006-08-15 Listed $34,000 HARMLS
- 2006-02-02 Listing Removed — HARMLS
- 2006-02-01 Listed $25,000 HARMLS
- 2004-11-10 Listing Removed — HARMLS
- 2004-10-20 Listed $29,900 HARMLS
- 2004-09-12 Listing Removed — HARMLS
- 2004-06-07 Listed $36,000 HARMLS
- 2004-04-20 Listing Removed — HARMLS
- 2004-04-07 Listed $650 HARMLS
- 2004-01-16 Listing Removed — HARMLS
- 2004-01-13 Listed $44,900 HARMLS
Cash-flow waterfall
monthlySold comps — $/sqft
last 12 mo · ≤1 miLoading sold comps…