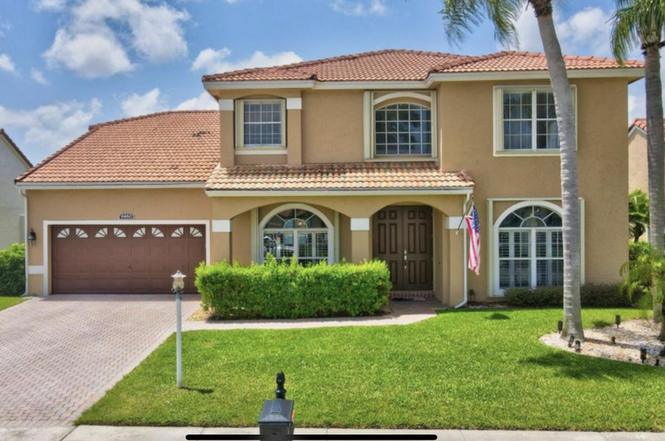
9460 Lake Serena Dr · Boca Raton, FL
Flood risk 1/10 · Minimal
- FEMA flood zone
- X (unshaded)
- Chance of flooding over 30 yrs
- 0.0%
- Est. flood insurance / yr
- $507 – $1,088
Fire risk 4/10 · Minor
- Est. fire insurance / yr
- $947 – $1,759
Heat risk 9/10 · Severe
- Hot days now (above 107°F)
- 7 days/yr
- Hot days in 30 yrs
- 25 days/yr
Wind risk 10/10 · Severe
- Chance of severe wind over 30 yrs
- 99.0%
Air-quality risk 2/10 · Minimal
- Unhealthy air days now
- 2 days/yr
- Unhealthy air days in 30 yrs
- 2 days/yr
Risk factors via First Street. Map © Google.
Why this score? — see what drove the D- grade
The composite is a weighted blend of 9 inputs, each scored 0–100. Each bar is that input's sub-score; the figure is the points it added to the 100-point composite (weight × sub-score).
- Appreciation +10.0/10.0
- ARV discount +7.5/15.0
- Schools +4.3/10.0
- Cash flow +4.1/30.0
- Livability +3.9/5.0
- Rent growth +3.1/5.0
- Condition / age +2.5/5.0
- 1% rule +0.3/10.0
- DSCR +0.0/10.0
$925,000
🖨 Deal sheet (PDF) 📄 Offer letter ✓ Due diligence
Listing remarks
Welcome to this beautiful home located at 9460 Lake Serena Dr, Boca Raton, FL. This spacious maintained home offers a great layout with 5 bedrooms and 3 bathrooms, a modern kitchen with high-end finishes, and a welcoming living area. Enjoy the serene outdoor space, complete with a enclosed patio and big private pool. Situated in a desirable community, this property provides convenient access to local amenities, shopping, and dining options. Close to A rated Boca schools. A must-see gem!
Key facts
- Private pool
- Convenient access
- Desirable community
Tags
Property features AI
Finance
- Other: Pets allowed
- HOA & community: Community amenities include pool, tennis courts, basketball court, playground, jogging path, picnic area and sidewalks; Internet included in association; HOA fee approximately $200 per month
Exterior
- Parking: Two-car garage with garage door opener; Two covered parking spaces
- Security: Smoke detectors
- Utilities: Public water; Public sewer; Water and sewer available
- Home design: Single-family residence; Two stories; Resale property; Faces east
- Construction: Stucco and CBS construction
- Exterior features: Private pool; Not waterfront
Interior
- Kitchen: Dishwasher; Electric range; Microwave; Refrigerator
- Bedrooms: No main-level bedrooms
- Flooring: Wood flooring
- Bathrooms: Two full bathrooms and one half bathroom (three total); One bathroom on the main level
- Heating & cooling: Central heating; Central air conditioning; Ceiling fans
- Interior features: Walk-in closets; Unfurnished
- Laundry & utility: Laundry inside
Neighborhood map
What this means for you Summary
Snapshot
- This is a 5-bed/2.5-bath single-family listed at $925k.
Deal economics
- At list price, monthly cash flow is $-3k ($-31k/yr) — negative.
- To cash-flow at today's rent, offer at most $473k (48.9% below list).
- To meet the 1% rule (rent ≥ 1% of price), the offer needs to be $493k (46.7% below list).
- Recommended offer: $473k (48.9% below list) — sets the bar for cash-flow.
Location & tenants
- Location reads 77/100 on livability (#192 in FL, #3,070 nationally) — a middle-class / working-renter tenant base. Strengths: employment A+, health & safety A+, crime B+; Watch: amenities D, cost of living F.
- Palm Beach (suburban): math 46% / reading 53% proficiency, ranked #34 of 73 in FL (top 47%) — families likely to look elsewhere, expect single-tenant / working-renter base with shorter leases.
- Zoned schools: Whispering Pines Elementary School (math 62% / reading 69%, grade B+, #500 of 2,144 statewide, top 24%, 1,015 students, 25% FRL); Omni Middle School (math 66% / reading 66%, grade A-, #93 of 571 statewide, top 16%, 1,128 students, 29% FRL); Olympic Heights Community High (math 52% / reading 64%, grade C, #120 of 667 statewide, top 18%, 2,602 students, 30% FRL) — zoned schools average 28% FRL vs 52% district-wide (24 pts lower); this property's tenant base skews higher-income than the district average.
- Zoned-school proficiency averages 63% at this address vs 50% district-wide (+14 pts) — the actual schools serving this property are materially stronger than the Palm Beach average implies; a family-tenant draw the district grade alone would hide.
- Market conditions: Rents rising (+2.3%/yr); 332 active listings in the ZIP; 9 comparable units currently listed for rent nearby; rentals at typical pace (median 27d on market — plan ~3-4 weeks tenant-placement turnaround); high-income renter base; 3,974 units permitted in Palm Beach County in 2024 (1,012 in 5+ unit buildings).
- At $4,934/mo this rent would consume 52% of the median local household income ($115k/yr) (locally 464% of renters already pay >50% of income on rent) — very limited rent-growth headroom before tenants either downsize or default.
Forward outlook
- In year one you build about $99k of equity ($6k loan paydown + $92k appreciation (10.0% local appreciation)).
- Palm Beach County population projected at +30% by 2050 — long-run rental-demand tailwind backs the buy-and-hold thesis.
- By year 2, paydown + projected appreciation supports a ~$159k cash-out refi (75% LTV) — recoverable capital for the next deal without selling this one.
Negotiation context
- It's been on market 229 days — a 12% lower offer ($814k) is reasonable based on typical stale-listing flexibility.
- 11 sale attempts since 23y ago with the ask held roughly flat each time — persistent listings suggest the price (not the market) is what's stuck; bring a comps-based counter.
- Current owner paid $508k; list at $925k implies a 82% gain — meaningful room to come down on a strong offer.
Risks & watch-outs
- Climate carrying-cost: severe wind risk, 99% chance of damaging wind over 30y; extreme-heat days projected 7→25/yr by 2055 (HVAC capex compounding) — expect insurance premiums to compound above CPI over the hold.
Questions for the listing agent
- What do current leases actually rent for vs. the listed asking? Can we see a recent rent roll and the last 12 months of T-12 income?
- It's been on market 229 days. Have you received any prior offers? Is the seller open to a 49% concession, seller financing, or rate buy-down credit?
- What does the HOA fee cover, when was the last increase, and are there any pending special assessments or reserve-fund shortfalls?
- Why hasn't it sold? Are there any deal-killer items the seller is aware of (foundation, flood, title, zoning, code violations)?
- Is there a deadline driving the sale (1031 exchange, divorce, estate, relocation)? That informs how much negotiation room exists.
- Schools are A-rated — typically a magnet for longer-tenancy family renters. What's the average tenant stay here, and is there a school-zone premium baked into asking?
- The area grade is low — what's the realistic commute time and amenity access for the typical tenant pool here? Any planned neighborhood developments (good or bad) we should know about?
- What's the average days-on-market for RENTAL listings here right now (not sales)? A rising rental-DOM trend means longer vacancies and softer asking-rent achievability than the comps imply.
- What's the recent tenant-quality profile in this submarket — average credit score on applications, eviction rate, late-payment / NSF rate, and stable-employment percentage? A property-management company in the area should have these aggregated.
- How much new for-sale + rental construction is in the pipeline within 1–3 miles? Heavy new supply typically softens prices + rents 12–24 months out; constrained supply supports both.
Investment metrics
- 1% rule
- 0.53% ✗
- Cap rate
- 2.97%
- Cash-on-cash
- -11.86%
- DSCR
- 0.47
- GRM
- 15.6
CMA / ARV
No comps found within radius.
Projected returns pro-forma
10.0% appreciation · 2.31% rent growth · sell at horizon
- IRR
- 15.9%
- Equity multiple
- 2.30×
- Total profit
- $337,477
- Equity at exit
- $833,313
- IRR
- 15.2%
- Equity multiple
- 5.31×
- Total profit
- $1,115,523
- Equity at exit
- $1,797,072
Cash invested: $259,000 (down + closing). Projections, not guarantees.
Landlord ↔ Tenant lean methodology
- Overall (STATE)
- 87 Strongly Landlord-Friendly
- State Florida
- 87 Strongly Landlord-Friendly · R+3
- County
- — inherits STATE
- City
- — inherits STATE
ZIP-level market 33496
- Home prices YoY
- 3.5%
- Rents YoY
- 2.3%
- Active inventory
- 332
- Price-to-rent
- 15.6×
Monthly cashflow live
- Estimated rent
- $4,934 high interval (Pro) →
- Mortgage (P&I)
- −$4,851
- Tax from tax record
- −$1,021 /mo · $12,249/yr
- Insurance
- −$385
- HOA
- −$200
- Lot rent
- −$0
- Vacancy / Maint / Mgmt
- −$1,036
- Net cashflow
- $-2,559
Break-even live
Sensitivity live
| Price | -10% $-2,036 | -5% $-2,298 | +0% $-2,559 | +5% $-2,821 | +10% $-3,083 |
|---|---|---|---|---|---|
| Rent | -10% $-2,949 | -5% $-2,754 | +0% $-2,559 | +5% $-2,365 | +10% $-2,170 |
| Rate | -1.0pp $-2,094 | -0.5pp $-2,324 | base $-2,559 | +0.5pp $-2,799 | +1.0pp $-3,043 |
UW: 25.0% down · 7.5% · 30yr · 1.5% tax · 5.0% vac · 8.0% maint · 8.0% mgmt
Financing live
Cash to close
- Down payment
- $231,250
- Closing costs
- $27,750
- Reserves months
- —
- Total cash needed
- —
Loan-product check · same deal, 3 products live
Conventional
25% down · 7.5% · 30yr
- Down + closing
- —
- Monthly P&I
- —
- Monthly cashflow
- —
- DSCR
- —
- Eligible?
- —
Personal DTI + credit; lowest rate.
DSCR
20% down · 8.5% · 30yr
- Down + closing
- —
- Monthly P&I
- —
- Monthly cashflow
- —
- DSCR
- —
- Eligible?
- —
No personal income docs; deal must DSCR.
Hard money
10% down · 12.0% · 12mo
- Down + closing
- —
- Monthly P&I
- —
- Monthly cashflow
- —
- DSCR
- —
- Eligible?
- —
Short-term bridge; refi at stabilization.
Rent comps 9 comps
| Address | Beds | Baths | Sqft | Rent | $/sqft | DOM | Units | Dist |
|---|---|---|---|---|---|---|---|---|
| 9505 Aegean Dr Boca Raton, FL | 4.0 | 2.5 | 2133 | $4,200 | $1.97 | 10d | 1 | 0.40mi |
| 9067 Long Lake Palm Dr Boca Raton, FL | 4.0 | 3.5 | 3014 | $6,875 | $2.28 | 26d | 1 | 0.72mi |
| 19323 Carolina Cir Boca Raton, FL | 4.0 | 2.0 | 2301 | $3,955 | $1.72 | 1d | 1 | 0.88mi |
| 19323 Carolina Cir Boca Raton, FL | 4.0 | 2.0 | 2300 | $4,150 | $1.80 | 15d | 1 | 0.88mi |
| 17358 Santaluce Mnr Boca Raton, FL | 5.0 | 6.5 | 3969 | $17,000 | $4.28 | 26d | 1 | 1.25mi |
| 10902 Tamoron Ln Boca Raton, FL | 4.0 | 3.0 | 2673 | $4,800 | $1.80 | 26d | 1 | 1.28mi |
| 9093 Chauvet Way Boca Raton, FL | 5.0 | 5.5 | 3956 | $17,950 | $4.54 | 26d | 1 | 1.31mi |
| 18474 Old Princeton Ln Boca Raton, FL | 4.0 | 2.5 | 2330 | $4,800 | $2.06 | 16d | 1 | 1.36mi |
| 17166 Ludovica Ln Boca Raton, FL | 5.0 | 5.5 | 3956 | $22,000 | $5.56 | 26d | 1 | 1.39mi |
HOA detail
- Monthly dues
- $200 · $2,400/yr
- Likely covers
- pool
Listing history 50 events
-
2026-06-22days on market $925,000 Active 229 DOM
-
2026-06-21days on market $925,000 Active 228 DOM
-
2026-06-18days on market $925,000 Active 225 DOM
-
2026-06-17days on market $925,000 Active 224 DOM
-
2026-06-16days on market $925,000 Active 223 DOM
-
2026-06-15days on market $925,000 Active 222 DOM
-
2026-06-13days on market $925,000 Active 220 DOM
-
2026-06-09days on market $925,000 Active 216 DOM
-
2026-06-07days on market $925,000 Active 214 DOM
-
2026-06-04days on market $925,000 Active 211 DOM
-
2026-06-03days on market $925,000 Active 210 DOM
-
2026-06-01days on market $925,000 Active 208 DOM
-
2026-05-31days on market $925,000 Active 207 DOM
-
2025-11-05$925,000 Active
-
2024-01-28historical $5,950
-
2024-01-11price $5,950
-
2024-01-09$6,200
-
2024-01-05historical $6,200
-
2024-01-01price $6,200
-
2023-12-20price $6,000
-
2023-12-13historical
-
2023-12-03$6,250
-
2023-10-30$949,900 Active
-
2022-12-06historical
-
2022-11-08$899,000 Active
-
2022-09-27historical
-
2022-08-22price $949,000
-
2022-07-29$972,900 Active
-
2019-10-23soldstatus $507,500
-
2019-10-18soldstatus $507,500 Closed
-
2019-09-23historical Active Under Contract
-
2019-08-24status Active
-
2019-08-18historical Active Under Contract
-
2019-08-08$535,000 Active
-
2018-10-19historical
-
2018-10-11$549,000 Active
-
2015-09-23soldstatus $460,000
-
2015-09-03soldstatus $460,000 Closed
-
2015-08-25status Pending
-
2015-08-04historical Contingent
-
2015-07-23price $464,900
-
2015-07-06price $479,000
-
2015-06-10$499,000 Active
-
2014-07-03soldstatus $440,000
-
2003-08-20soldstatus $370,000
-
2003-08-20soldstatus $370,000
-
2003-08-11soldstatus $370,000
-
2003-07-12historical
-
2003-06-26$379,900
-
1995-03-09soldstatus $218,000
ⓘ Source: listings_history table (triggers on properties + properties_extension) + one-shot
backfill from property_details.listing_events for pre-trigger history.
Tax reassessment forecast FL · Resets to sale price
- Current annual tax
- $12,249 · $1,021/mo
- Projected year-2 tax
- $12,249 · $1,021/mo
- Expected delta
- $0/yr ($0/mo · 0.0%)
ⓘ Screening estimate from a state-policy table — verify with the county assessor before closing.
Climate risk First Street
- Flood 1/10 Low FEMA zone X (unshaded) · 0% chance over 30 yrs
- Wildfire 4/10 Moderate
- Heat 9/10 Extreme 7 d/yr ≥107°F today · 25 d/yr by 30 yrs out
- Wind 10/10 Extreme 99% chance of damaging wind over 30 yrs
- Air quality 2/10 Low 2 unhealthy d/yr today · 2 by 30 yrs out
Nearby sold comps map
Loading sold comps map…
Walkable amenities ~0.75 mi
Loading nearby amenities…
Taxation est. · year 1
- Rental income
- $59,203
- − Mortgage interest
- −$51,814
- − Property taxes
- −$12,249
- − Insurance
- −$4,625
- − Repairs & maintenance
- −$4,736
- − Management
- −$4,736
- − HOA
- −$2,400
- − Depreciation
- −$26,909
- Taxable loss
- −$48,268
- Est. tax savings @ 24.0%
- +$11,584
- After-tax cash flow
- $-19,130/yr
For passive investors: Depreciation is non-cash, so a rental often shows a tax loss while cash-flowing — sheltering income. Rental losses are passive: they offset passive income freely, and up to $25,000/yr can offset ordinary (W-2) income if you actively participate and your MAGI is under $100k (phasing out to $0 by $150k); unused losses carry forward. On sale, claimed depreciation is recaptured at up to 25%, and gains may owe capital-gains tax (a 1031 exchange can defer both). Figures are a year-1 estimate at your 24.0% rate — not tax advice; consult a CPA.
Schools (NCES district)
- District
- Palm Beach
- NCES district ID
- 1201500
- Math proficiency
- 46% ▼ -16.00%
- Reading proficiency
- 53% ▼ -4.00%
- Median HH income
- $53,943
- Composite
- 42.72/100
- National rank
- #3160
- State rank
- #34 of 73 in FL
Livability — Boca Raton
- Score
- 77/100
- State rank
- #192
- US rank
- #3070
Category grades
Schools grade is shown separately in the Schools card above.
Census & demographics
- County
- Palm Beach County · 1,438,312 people
- City population
- 250,102
- Metro
- Miami-Fort Lauderdale-Pompano Beach, FL
- Population (ZIP)
- 26,579
- Household income
- $114,885
- Rent vs Own
- Severe rent burden
- 464.0
Population outlook (Palm Beach County) Hauer SSP2
- Today (2025)
- 1,637,487 people
- By 2030
- 1,743,255 · +6.5%
- By 2040
- 1,948,712 · +19.0%
- By 2050
- 2,132,979 · +30.3%
- By 2075
- 2,530,027 · +54.5%
- By 2100
- 2,706,979 · +65.3%
Race, ethnicity, and origin ACS 2023
- Neighborhood character
- Predominantly White (79%)
- Race & ethnicity
- White 79% Hispanic / Latino 11% Two or more races 8% Asian 5% Black 2%
- Hispanic origin (detail)
- Puerto Rican 3%
- Common ancestry
- Scotch-Irish 13% Romanian 9% Italian 3%
- Foreign-born
- 24% · Canada, Jamaica, Dominican Republic
- Languages at home
- 75% English-only · Spanish 9% Other Indo-European 5% Russian/Polish/Slavic 4%
Political lean MEDSL · Palm Beach
- 2024 margin
- Toss-up / Even · D 50.0% · R 49.2%
- 2008→2024 swing
- -22.1pp toward R · 2008: 22.9pp · 2024: 0.8pp
- All cycles
- 2024: D+0.8 2020: D+12.8 2016: D+15.3 2012: D+17.0 2008: D+22.9
Not yet ingested
- Civics
- —
Market trends
- HPI YoY
- ▲ 10.48%
- Current HPI
- 313.9058
- Rent YoY
- ▲ 2.31%
- Metro
- Miami-Fort Lauderdale-Pompano Beach, FL
- State GDP YoY
- ▲ 3.28%
- F500 in state
- 36
Industry mix (Fortune 500 HQ in FL)
| Industry | F500 HQs | Revenue |
|---|---|---|
| Industrial Technology | 2 | $29B |
|
||
| Insurance | 2 | $17B |
|
||
| Retail | 1 | $60B |
|
||
| Technology Distribution | 1 | $58B |
|
||
| Homebuilding | 1 | $35B |
|
||
| Technology Manufacturing | 1 | $35B |
|
||
Price history
+324.3% since first listed37 events — show timeline
- 2025-11-05 Listed $925,000 Beaches MLS
- 2024-01-28 Rental Removed $5,950 Avail
- 2024-01-11 Price Changed $5,950 Avail
- 2024-01-09 Listed for Rent $6,200 Avail
- 2024-01-05 Rental Removed $6,200 Avail
- 2024-01-01 Price Changed $6,200 Avail
- 2023-12-20 Price Changed $6,000 Avail
- 2023-12-13 Listing Removed — Beaches MLS
- 2023-12-03 Listed for Rent $6,250 Avail
- 2023-10-30 Listed $949,900 Beaches MLS
- 2022-12-06 Listing Removed — Beaches MLS
- 2022-11-08 Listed $899,000 Beaches MLS
- 2022-09-27 Listing Removed — Beaches MLS
- 2022-08-22 Price Changed $949,000 Beaches MLS
- 2022-07-29 Listed $972,900 Beaches MLS
- 2019-10-23 Sold (Public Records) $507,500 Public Records
- 2019-10-18 Sold (MLS) $507,500 Beaches MLS
- 2019-09-23 Contingent — Beaches MLS
- 2019-08-24 Relisted — Beaches MLS
- 2019-08-18 Contingent — Beaches MLS
- 2019-08-08 Listed $535,000 Beaches MLS
- 2018-10-19 Listing Removed — Beaches MLS
- 2018-10-11 Listed $549,000 Beaches MLS
- 2015-09-23 Sold (Public Records) $460,000 Public Records
- 2015-09-03 Sold (MLS) $460,000 Beaches MLS
- 2015-08-25 Pending — Beaches MLS
- 2015-08-04 Contingent — Beaches MLS
- 2015-07-23 Price Changed $464,900 Beaches MLS
- 2015-07-06 Price Changed $479,000 Beaches MLS
- 2015-06-10 Listed $499,000 Beaches MLS
- 2014-07-03 Sold (Public Records) $440,000 Public Records
- 2003-08-20 Sold (Public Records) $370,000 Public Records
- 2003-08-20 Sold (Public Records) $370,000 Public Records
- 2003-08-11 Sold (MLS) $370,000 Beaches MLS
- 2003-07-12 Listing Removed — Beaches MLS
- 2003-06-26 Listed $379,900 Beaches MLS
- 1995-03-09 Sold (Public Records) $218,000 Public Records
Property tax history
+5.6%/yrLatest (2025): $12,249 · +5.6% YoY. Source: county tax records.
Cash-flow waterfall
monthlySold comps — $/sqft
last 12 mo · ≤1 miLoading sold comps…