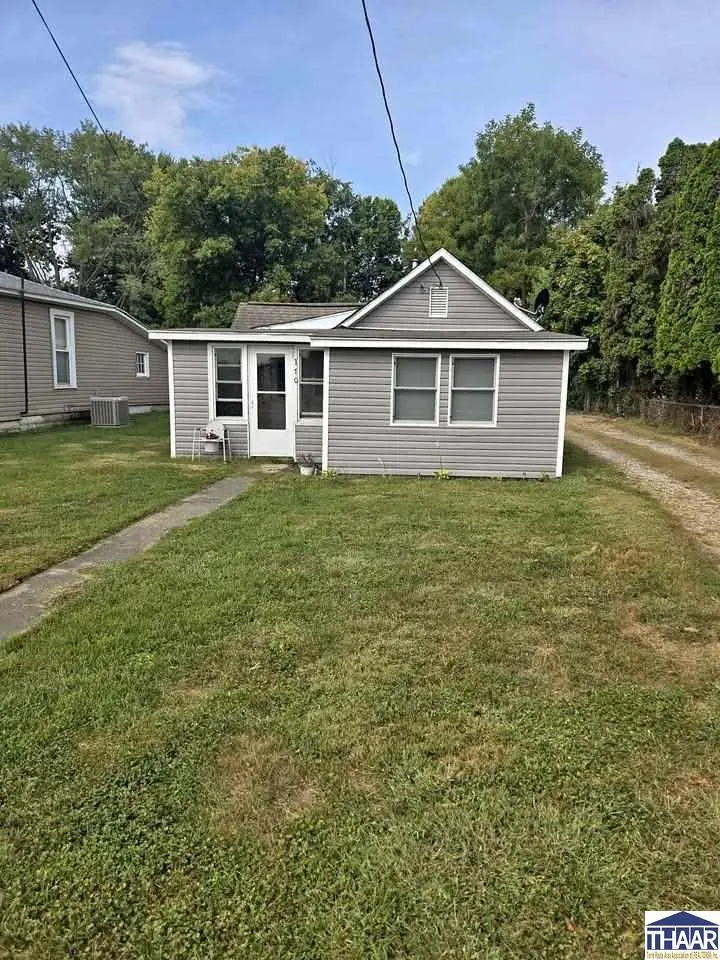
170 N Main St · Rosedale, IN
Flood risk 5/10 · Moderate
- FEMA flood zone
- X (unshaded)
- Chance of flooding over 30 yrs
- 0.66%
- Est. flood insurance / yr
- $507 – $1,088
Fire risk 1/10 · Minimal
- Est. fire insurance / yr
- $717 – $1,331
Heat risk 4/10 · Minor
- Hot days now (above 105°F)
- 7 days/yr
- Hot days in 30 yrs
- 19 days/yr
Wind risk 2/10 · Minimal
- Chance of severe wind over 30 yrs
- 1.0%
Air-quality risk 3/10 · Minor
- Unhealthy air days now
- 2 days/yr
- Unhealthy air days in 30 yrs
- 3 days/yr
Risk factors via First Street. Map © Google.
Why this score? — see what drove the B grade
The composite is a weighted blend of 9 inputs, each scored 0–100. Each bar is that input's sub-score; the figure is the points it added to the 100-point composite (weight × sub-score).
- Cash flow +28.5/30.0
- DSCR +10.0/10.0
- Appreciation +10.0/10.0
- 1% rule +7.5/10.0
- ARV discount +7.5/15.0
- Livability +3.1/5.0
- Schools +3.0/10.0
- Rent growth +2.5/5.0
- Condition / age +2.5/5.0
$63,500
🖨 Deal sheet (PDF) 📄 Offer letter ✓ Due diligence
Listing remarks
Discover this charming 2-bedroom home nestled in a friendly small-town community. Set on a generous lot, it offers plenty of outdoorspace to garden, play, or simply relax, along with a detached garage perfect for storage or your next project. Enjoy peaceful mornings orunwind after a long day on the cozy back porch — the ideal spot for coffee, conversation, or quiet reflection. Known for its strong familyvalues and excellent schools, this community is a wonderful place to put down roots and enjoy small-town living at its best. Recentupdates include new siding and windows installed within the last two years. Priced below the seller’s most recent appraisal, this homeoffers both com
Key facts
- Recent updates
- Generous lot
- New siding
Tags
Property features AI
Exterior
- Parking: Detached gravel garage; 1 garage space
- Utilities: Public sewer
- Home design: Single-family residence; 1 story
- Construction: Vinyl siding; Rolled/Hot Mop roof; Shingle roof
- Exterior features: Covered porch; Porch
Interior
- Kitchen: Electric range; Electric oven; Refrigerator; Dishwasher not listed
- Bathrooms: 1 full bathroom
- Heating & cooling: Natural gas heating; Wall/window cooling unit(s)
- Interior features: Dryer; Electric range; Electric oven; Refrigerator; Washer; Crawl space basement
- Laundry & utility: Washer; Dryer
Neighborhood map
What this means for you Summary
Snapshot
- This is a 1-bed/1.0-bath single-family listed at $64k.
Deal economics
- At list price, monthly cash flow is $207 ($2k/yr) — positive.
- The deal already cash-flows at list — no discount required.
- Meets the 1% rule at list price ($796 rent vs $64k).
- Recommended offer: $60k (6.0% below list) — sets the bar for market timing.
Location & tenants
- Location reads 61/100 on livability (#509 in IN) — a middle-class / working-renter tenant base. Strengths: cost of living A+, housing A+; Watch: crime C-, employment D, amenities F.
- Southwest Parke Community School Corporation (rural): math 34% / reading 36% proficiency, ranked #195 of 301 in IN (top 65%) — families likely to look elsewhere, expect single-tenant / working-renter base with shorter leases.
- Zoned schools: Rosedale Elementary School (math 42% / reading 32%, grade F, #550 of 994 statewide, top 57%, 312 students, 53% FRL); Riverton Parke Jr-Sr High School (math 23% / reading 39%, grade F, #303 of 369 statewide, top 82%, 472 students, 53% FRL) — zoned schools at 53% FRL track the district average.
- Market conditions: 17 active listings in the ZIP; 61 units permitted in Parke County in 2024 (0 in 5+ unit buildings).
Forward outlook
- In year one you build about $7k of equity ($439 loan paydown + $6k appreciation (10.0% local appreciation)).
- Parke County population projected at -10% by 2050 — secular population decline; favor cash flow + early exit over multi-decade hold.
- At projected returns (10.0% appreciation + 3.0% rent growth), your $18k cash investment doubles in ~2 years — after that, you're playing with house money.
- By year 5, paydown + projected appreciation supports a ~$32k cash-out refi (75% LTV) — recoverable capital for the next deal without selling this one.
Negotiation context
- It's been on market 73 days — a 6% lower offer ($60k) is reasonable based on typical stale-listing flexibility.
- 3 sale attempts; this cycle's ask is 6% above the opening price — seller raised mid-cycle; expect resistance to lowballs.
Risks & watch-outs
- Watch-outs: built in 1890 — expect roof / HVAC / electrical / plumbing capex.
- Climate carrying-cost: moderate flood risk — expect insurance premiums to compound above CPI over the hold.
Questions for the listing agent
- It's been on market 73 days. Have you received any prior offers? Is the seller open to a 6% concession, seller financing, or rate buy-down credit?
- Built in 1890 — when were the roof, HVAC, electrical panel, plumbing, and water heater last replaced?
- Why hasn't it sold? Are there any deal-killer items the seller is aware of (foundation, flood, title, zoning, code violations)?
- Is there a deadline driving the sale (1031 exchange, divorce, estate, relocation)? That informs how much negotiation room exists.
- What's the average days-on-market for RENTAL listings here right now (not sales)? A rising rental-DOM trend means longer vacancies and softer asking-rent achievability than the comps imply.
- What's the recent tenant-quality profile in this submarket — average credit score on applications, eviction rate, late-payment / NSF rate, and stable-employment percentage? A property-management company in the area should have these aggregated.
- How much new for-sale + rental construction is in the pipeline within 1–3 miles? Heavy new supply typically softens prices + rents 12–24 months out; constrained supply supports both.
Investment metrics
- 1% rule
- 1.25% ✓
- Cap rate
- 10.20%
- Cash-on-cash
- 13.97%
- DSCR
- 1.62
- GRM
- 6.6
CMA / ARV
No comps found within radius.
Projected returns pro-forma
10.0% appreciation · 3.0% rent growth · sell at horizon
- IRR
- 34.6%
- Equity multiple
- 3.69×
- Total profit
- $47,768
- Equity at exit
- $57,206
- IRR
- 29.8%
- Equity multiple
- 8.33×
- Total profit
- $130,307
- Equity at exit
- $123,367
Cash invested: $17,780 (down + closing). Projections, not guarantees.
Landlord ↔ Tenant lean methodology
- Overall (STATE)
- 90 Strongly Landlord-Friendly
- State Indiana
- 90 Strongly Landlord-Friendly · R+11
- County
- — inherits STATE
- City
- — inherits STATE
ZIP-level market 47874
- Home prices YoY
- 9.2%
- Active inventory
- 17
- Price-to-rent
- 6.6×
Monthly cashflow live
- Estimated rent
- $796 medium interval (Pro) →
- Mortgage (P&I)
- −$333
- Tax from tax record
- −$63 /mo · $752/yr
- Insurance
- −$26
- HOA
- −$0
- Vacancy / Maint / Mgmt
- −$167
- Net cashflow
- $207
Break-even live
Sensitivity live
| Price | -10% $243 | -5% $225 | +0% $207 | +5% $189 | +10% $171 |
|---|---|---|---|---|---|
| Rent | -10% $144 | -5% $176 | +0% $207 | +5% $238 | +10% $270 |
| Rate | -1.0pp $239 | -0.5pp $223 | base $207 | +0.5pp $191 | +1.0pp $174 |
UW: 25.0% down · 7.5% · 30yr · 1.5% tax · 5.0% vac · 8.0% maint · 8.0% mgmt
Financing live
Cash to close
- Down payment
- $15,875
- Closing costs
- $1,905
- Reserves months
- —
- Total cash needed
- —
Loan-product check · same deal, 3 products live
Conventional
25% down · 7.5% · 30yr
- Down + closing
- —
- Monthly P&I
- —
- Monthly cashflow
- —
- DSCR
- —
- Eligible?
- —
Personal DTI + credit; lowest rate.
DSCR
20% down · 8.5% · 30yr
- Down + closing
- —
- Monthly P&I
- —
- Monthly cashflow
- —
- DSCR
- —
- Eligible?
- —
No personal income docs; deal must DSCR.
Hard money
10% down · 12.0% · 12mo
- Down + closing
- —
- Monthly P&I
- —
- Monthly cashflow
- —
- DSCR
- —
- Eligible?
- —
Short-term bridge; refi at stabilization.
Listing history 23 events
-
2026-06-21days on market $63,500 Active 73 DOM
-
2026-06-19days on market $63,500 Active 71 DOM
-
2026-06-18days on market $63,500 Active 70 DOM
-
2026-06-17days on market $63,500 Active 69 DOM
-
2026-06-16days on market $63,500 Active 68 DOM
-
2026-06-15days on market $63,500 Active 67 DOM
-
2026-06-14days on market $63,500 Active 65 DOM
-
2026-06-13days on market $63,500 Active 64 DOM
-
2026-06-10days on market $63,500 Active 62 DOM
-
2026-06-09days on market $63,500 Active 61 DOM
-
2026-06-08days on market $63,500 Active 60 DOM
-
2026-06-07days on market $63,500 Active 59 DOM
-
2026-06-03days on market $63,500 Active 55 DOM
-
2026-06-02days on market $63,500 Active 54 DOM
-
2026-06-01days on market $63,500 Active 53 DOM
-
2026-05-31days on market $63,500 Active 52 DOM
-
2026-05-30days on market $63,500 Active 51 DOM
-
2026-05-18price $63,500
-
2026-04-13status Active
-
2026-04-06status Pending
-
2026-04-01$60,000 Active
-
2025-12-11price $60,000
-
2025-11-03$68,000 Active
ⓘ Source: listings_history table (triggers on properties + properties_extension) + one-shot
backfill from property_details.listing_events for pre-trigger history.
Tax reassessment forecast IN · Partial reset (capped growth)
- Current annual tax
- $752 · $63/mo
- Projected year-2 tax
- $752 · $63/mo
- Expected delta
- $0/yr ($0/mo · 0.0%)
ⓘ Screening estimate from a state-policy table — verify with the county assessor before closing.
Climate risk First Street
- Flood 5/10 Major FEMA zone X (unshaded) · 66% chance over 30 yrs
- Wildfire 1/10 Low
- Heat 4/10 Moderate 7 d/yr ≥105°F today · 19 d/yr by 30 yrs out
- Wind 2/10 Low 100% chance of damaging wind over 30 yrs
- Air quality 3/10 Moderate 2 unhealthy d/yr today · 3 by 30 yrs out
Nearby sold comps map
Loading sold comps map…
Walkable amenities ~0.75 mi
Loading nearby amenities…
Taxation est. · year 1
- Rental income
- $9,557
- − Mortgage interest
- −$3,557
- − Property taxes
- −$752
- − Insurance
- −$318
- − Repairs & maintenance
- −$765
- − Management
- −$765
- − Depreciation
- −$1,847
- Taxable income
- $1,553
- Est. tax owed @ 24.0%
- −$373
- After-tax cash flow
- $2,111/yr
For passive investors: Depreciation is non-cash, so a rental often shows a tax loss while cash-flowing — sheltering income. Rental losses are passive: they offset passive income freely, and up to $25,000/yr can offset ordinary (W-2) income if you actively participate and your MAGI is under $100k (phasing out to $0 by $150k); unused losses carry forward. On sale, claimed depreciation is recaptured at up to 25%, and gains may owe capital-gains tax (a 1031 exchange can defer both). Figures are a year-1 estimate at your 24.0% rate — not tax advice; consult a CPA.
Schools (NCES district)
- District
- Southwest Parke Community School Corporation
- NCES district ID
- 1810900
- Math proficiency
- 34% ▼ -4.00%
- Reading proficiency
- 36% ▼ -6.00%
- Median HH income
- $42,288
- Composite
- 29.61/100
- National rank
- #6474
- State rank
- #195 of 301 in IN
Livability — Rosedale
- Score
- 61/100
- State rank
- #509
- US rank
- #18028
Category grades
Schools grade is shown separately in the Schools card above.
Census & demographics
- Census place
- Rosedale, IN
- Population (ZIP)
- 2,950
Population outlook (Parke County) Hauer SSP2
- Today (2025)
- 15,937 people
- By 2030
- 15,467 · -2.9%
- By 2040
- 14,793 · -7.2%
- By 2050
- 14,318 · -10.2%
- By 2075
- 13,484 · -15.4%
- By 2100
- 12,236 · -23.2%
Race, ethnicity, and origin ACS 2023
- Neighborhood character
- Predominantly White (99%)
- Race & ethnicity
- White 99%
- Common ancestry
- Italian 4% Romanian 2% Serbian 2%
- Foreign-born
- 1%
- Languages at home
- 99% English-only · German/W. Germanic 1%
Political lean MEDSL · Parke
- 2024 margin
- Solid R (+56.9) · D 20.6% · R 77.5% · Other 1.9%
- 2008→2024 swing
- -42.8pp toward R · 2008: -14.1pp · 2024: -56.9pp
- All cycles
- 2024: R+56.9 2020: R+55.5 2016: R+52.0 2012: R+32.6 2008: R+14.1
Not yet ingested
- Civics
- —
Market trends
- HPI YoY
- ▲ 18.87%
- Current HPI
- 225.1441
- Rent YoY
- —
- Metro
- —
- State GDP YoY
- ▲ 2.90%
- F500 in state
- 18
Industry mix (Fortune 500 HQ in IN)
| Industry | F500 HQs | Revenue |
|---|---|---|
| Industrial Machinery | 2 | $37B |
|
||
| Healthcare | 1 | $177B |
|
||
| Pharmaceuticals | 1 | $45B |
|
||
| Metals / Steel | 1 | $18B |
|
||
| Agriculture | 1 | $17B |
|
||
| Packaging | 1 | $12B |
|
||
Price history
-6.6% since first listed6 events — show timeline
- 2026-05-18 Price Changed $63,500 THAAR
- 2026-04-13 Relisted — THAAR
- 2026-04-06 Pending — THAAR
- 2026-04-01 Listed $60,000 THAAR
- 2025-12-11 Price Changed $60,000 THAAR
- 2025-11-03 Listed $68,000 THAAR
Property tax history
+2.6%/yrLatest (2024): $752 · +11.8% YoY. Source: county tax records.
Cash-flow waterfall
monthlySold comps — $/sqft
last 12 mo · ≤1 miLoading sold comps…