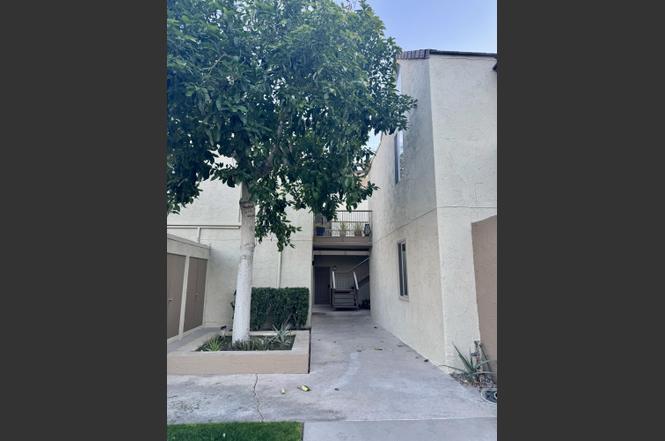
46855 Mountain Cove Dr #84 · Indian Wells, CA
Flood risk 1/10 · Minimal
- FEMA flood zone
- X (shaded)
- Chance of flooding over 30 yrs
- 0.0%
- Est. flood insurance / yr
- $507 – $1,088
Fire risk 5/10 · Moderate
- Est. fire insurance / yr
- $659 – $1,223
Heat risk 9/10 · Severe
- Hot days now (above 114°F)
- 7 days/yr
- Hot days in 30 yrs
- 17 days/yr
Wind risk 1/10 · Minimal
- Chance of severe wind over 30 yrs
- —
Air-quality risk 4/10 · Minor
- Unhealthy air days now
- 4 days/yr
- Unhealthy air days in 30 yrs
- 5 days/yr
Risk factors via First Street. Map © Google.
Why this score? — see what drove the C+ grade
The composite is a weighted blend of 9 inputs, each scored 0–100. Each bar is that input's sub-score; the figure is the points it added to the 100-point composite (weight × sub-score).
- Cash flow +23.5/30.0
- DSCR +7.6/10.0
- ARV discount +7.5/15.0
- 1% rule +7.2/10.0
- Appreciation +6.9/10.0
- Schools +3.8/10.0
- Livability +2.7/5.0
- Rent growth +2.5/5.0
- Condition / age +2.5/5.0
$319,900
🖨 Deal sheet 📄 Offer letter ✓ Due diligence
Listing remarks
Welcome to Mountain Cove in Indian Wells! Tucked in the Santa Rosa Mountains. Stunning mountain views everywhere you look. Mature citrus trees, 3-outdoor pools (heated in the winter months). Community EV charge station. This stunningly remodeled and private, ground floor one bedroom has all new flooring, and GE appliances, including full washer/dryer. Recessed canned lighting with night light option. Mountain Cove allows Short-Term Rentals with a 7-day rental minimum, a great opportunity for a return on investment for a seasonal owner. All Indian Wells residents can enjoy exclusive perks - at the IW Club for a discounted rate, complimentary access to the Hyatt Regency gym, discounts at loca
Key facts
- Remodeled
- Mature citrus trees
- New flooring
Tags
Neighborhood map
What this means for you Summary
Snapshot
- This is a 1-bed/1.0-bath condo listed at $320k.
Deal economics
- At list price, monthly cash flow is $596 ($7k/yr) — positive.
- The deal already cash-flows at list — no discount required.
- Meets the 1% rule at list price ($4k rent vs $320k).
- Recommended offer: $301k (6.0% below list) — sets the bar for market timing.
- Cap rate 8.5% vs local median 1.5% in Indian Wells — top-decile yield for the area; either an underpriced asset or a hidden risk that comps aren't pricing in. Stress-test before assuming the spread holds.
Location & tenants
- Location reads 53/100 on livability (#968 in CA) — a working-class tenant base; expect higher turnover. Strengths: employment A+, crime B+; Watch: amenities F, commute F, cost of living F.
- Desert Sands Unified (suburban): math 31% / reading 56% proficiency, ranked #199 of 517 in CA (top 38%) — families likely to look elsewhere, expect single-tenant / working-renter base with shorter leases.
- Zoned schools: Gerald R. Ford Elementary (math 24% / reading 24%, grade F, #973 of 1,571 statewide, top 73%, 603 students, 59% FRL); La Quinta High (math 31% / reading 65%, grade D, #380 of 1,170 statewide, top 33%, 2,500 students, 74% FRL).
- Market conditions: 147 active listings in the ZIP; 4 comparable units currently listed for rent nearby; rentals lingering (median 44d on market — plan ~5-8 weeks vacancy on turnover, expect pricing pressure); 100% of comp listings sitting > 30 days — soft ceiling on asking rent; high-income renter base; 9,195 units permitted in Riverside County in 2024 (1,512 in 5+ unit buildings).
Forward outlook
- In year one you build about $14k of equity ($2k loan paydown + $12k appreciation (3.8% local appreciation)).
- Riverside County population projected at +22% by 2050 — long-run rental-demand tailwind backs the buy-and-hold thesis.
- At projected returns (3.8% appreciation + 3.0% rent growth), your $90k cash investment doubles in ~4 years — after that, you're playing with house money.
- By year 3, paydown + projected appreciation supports a ~$35k cash-out refi (75% LTV) — recoverable capital for the next deal without selling this one.
Negotiation context
- It's been on market 81 days — a 6% lower offer ($301k) is reasonable based on typical stale-listing flexibility.
- 4 sale attempts since 3y ago with the ask held roughly flat each time — persistent listings suggest the price (not the market) is what's stuck; bring a comps-based counter.
Risks & watch-outs
- Climate carrying-cost: moderate wildfire risk; extreme-heat days projected 7→17/yr by 2055 (HVAC capex compounding) — expect insurance premiums to compound above CPI over the hold.
Questions for the listing agent
- It's been on market 81 days. Have you received any prior offers? Is the seller open to a 6% concession, seller financing, or rate buy-down credit?
- Built in 1972 — when were the roof, HVAC, electrical panel, plumbing, and water heater last replaced?
- What does the HOA fee cover, when was the last increase, and are there any pending special assessments or reserve-fund shortfalls?
- Any open or pending special assessments — roof, HVAC, plumbing, elevator, façade? What's the per-unit balance and payoff schedule, and is the seller paying it off at close or rolling it to the buyer?
- Why hasn't it sold? Are there any deal-killer items the seller is aware of (foundation, flood, title, zoning, code violations)?
- Is there a deadline driving the sale (1031 exchange, divorce, estate, relocation)? That informs how much negotiation room exists.
- Schools are B-rated — typically a magnet for longer-tenancy family renters. What's the average tenant stay here, and is there a school-zone premium baked into asking?
- What's the average days-on-market for RENTAL listings here right now (not sales)? A rising rental-DOM trend means longer vacancies and softer asking-rent achievability than the comps imply.
- What's the recent tenant-quality profile in this submarket — average credit score on applications, eviction rate, late-payment / NSF rate, and stable-employment percentage? A property-management company in the area should have these aggregated.
- How much new apartment / multifamily construction is in the pipeline within 1–3 miles? Heavy new supply (>2% of stock underway) typically softens rents 12–24 months out; light construction supports rent growth.
Investment metrics
- 1% rule
- 1.22% ✓
- Cap rate
- 8.53%
- Cash-on-cash
- 7.98%
- DSCR
- 1.36
- GRM
- 6.9
CMA / ARV
No comps found within radius.
Projected returns pro-forma
3.76% appreciation · 3.0% rent growth · sell at horizon
- IRR
- 16.9%
- Equity multiple
- 2.00×
- Total profit
- $89,736
- Equity at exit
- $157,702
- IRR
- 17.9%
- Equity multiple
- 3.80×
- Total profit
- $251,013
- Equity at exit
- $254,414
Cash invested: $89,572 (down + closing). Projections, not guarantees.
Landlord ↔ Tenant lean methodology
- Overall (STATE)
- 18 Strongly Tenant-Friendly
- State California
- 18 Strongly Tenant-Friendly · D+13
- County
- — inherits STATE
- City
- — inherits STATE
ZIP-level market 92210
- Home prices YoY
- 1.3%
- Active inventory
- 147
- Price-to-rent
- 6.9×
Monthly cashflow live
- Estimated rent
- $3,888 medium interval (Pro) →
- Mortgage (P&I)
- −$1,678
- Tax est. 1.5%
- −$400 /mo · $4,798/yr
- Insurance
- −$133
- HOA
- −$265
- Vacancy / Maint / Mgmt
- −$816
- Net cashflow
- $596
Break-even live
UW: 25.0% down · 7.5% · 30yr · 1.5% tax · 5.0% vac · 8.0% maint · 8.0% mgmt
Financing live
Cash to close
- Down payment
- $79,975
- Closing costs
- $9,597
- Reserves months
- —
- Total cash needed
- —
Loan-product check · same deal, 3 products live
Conventional
25% down · 7.5% · 30yr
- Down + closing
- —
- Monthly P&I
- —
- Monthly cashflow
- —
- DSCR
- —
- Eligible?
- —
Personal DTI + credit; lowest rate.
DSCR
20% down · 8.5% · 30yr
- Down + closing
- —
- Monthly P&I
- —
- Monthly cashflow
- —
- DSCR
- —
- Eligible?
- —
No personal income docs; deal must DSCR.
Hard money
10% down · 12.0% · 12mo
- Down + closing
- —
- Monthly P&I
- —
- Monthly cashflow
- —
- DSCR
- —
- Eligible?
- —
Short-term bridge; refi at stabilization.
Rent comps 4 comps
| Address | Beds | Baths | Sqft | Rent | $/sqft | DOM | Units | Dist |
|---|---|---|---|---|---|---|---|---|
| 78130 Cortez Ln Indian Wells, CA | 1.0–2.0 | 1.0–2.0 | 874 | $2,600 | $2.97 | 43d | 2 | 0.12mi |
| 78200 Cortez Ln #149 Indian Wells, CA | 1.0 | 1.0 | 576 | $2,200 | $3.82 | 43d | 1 | 0.14mi |
| 78155 Cabrillo Ln #37 Indian Wells, CA | 1.0 | 1.0 | 576 | $3,500 | $6.08 | 43d | 1 | 0.14mi |
| 78490 Via Palomino Unit 101 La Quinta, CA | 1.0 | 1.0 | 560 | $1,800 | $3.21 | 43d | 1 | 1.32mi |
HOA detail condo
- Monthly dues
- $265 · $3,180/yr
- Likely covers
- poolgym
- Assessments
- None detected in remarks — confirm with the listing agent.
Listing history 11 events
-
2026-04-25status Pending
-
2026-02-01$319,900 Active
-
2026-01-01historical
-
2025-08-01price $319,900
-
2025-06-03price $330,000
-
2025-05-13historical
-
2025-05-02price $340,000
-
2025-01-20$340,000 Active
-
2025-01-12$350,000 Active
-
2023-11-16historical
-
2023-05-25$264,000 Active
ⓘ Source: listings_history table (triggers on properties + properties_extension) + one-shot
backfill from property_details.listing_events for pre-trigger history.
Climate risk First Street
- Flood 1/10 Low FEMA zone X (shaded) · 0% chance over 30 yrs
- Wildfire 5/10 Major
- Heat 9/10 Extreme 7 d/yr ≥114°F today · 17 d/yr by 30 yrs out
- Wind 1/10 Low
- Air quality 4/10 Moderate 4 unhealthy d/yr today · 5 by 30 yrs out
Nearby sold comps map
Loading sold comps map…
Walkable amenities ~0.75 mi
Loading nearby amenities…
Taxation est. · year 1
- Rental income
- $46,657
- − Mortgage interest
- −$17,919
- − Property taxes
- −$4,798
- − Insurance
- −$1,600
- − Repairs & maintenance
- −$3,733
- − Management
- −$3,733
- − HOA
- −$3,180
- − Depreciation
- −$9,306
- Taxable income
- $2,388
- Est. tax owed @ 24.0%
- −$573
- After-tax cash flow
- $6,577/yr
For passive investors: Depreciation is non-cash, so a rental often shows a tax loss while cash-flowing — sheltering income. Rental losses are passive: they offset passive income freely, and up to $25,000/yr can offset ordinary (W-2) income if you actively participate and your MAGI is under $100k (phasing out to $0 by $150k); unused losses carry forward. On sale, claimed depreciation is recaptured at up to 25%, and gains may owe capital-gains tax (a 1031 exchange can defer both). Figures are a year-1 estimate at your 24.0% rate — not tax advice; consult a CPA.
Schools (NCES district)
- District
- Desert Sands Unified
- NCES district ID
- 0611110
- Math proficiency
- 31% ▼ -4.00%
- Reading proficiency
- 56% ▲ 7.00%
- Median HH income
- $54,957
- Composite
- 37.77/100
- National rank
- #4346
- State rank
- #199 of 517 in CA
Livability — Indian Wells
- Score
- 53/100
- State rank
- #968
- US rank
- #24559
Category grades
Schools grade is shown separately in the Schools card above.
Census & demographics
- Census place
- Indian Wells, CA
- County
- Riverside County · 2,287,001 people
- City population
- 4,871
- Metro
- Riverside-San Bernardino-Ontario, CA
- Population (ZIP)
- 4,871
- Household income
- $162,990
- Rent vs Own
- Severe rent burden
- 56.0
Population outlook (Riverside County) Hauer SSP2
- Today (2025)
- 2,664,475 people
- By 2030
- 2,802,692 · +5.2%
- By 2040
- 3,050,904 · +14.5%
- By 2050
- 3,256,783 · +22.2%
- By 2075
- 3,655,058 · +37.2%
- By 2100
- 3,766,594 · +41.4%
Race, ethnicity, and origin ACS 2023
- Neighborhood character
- Predominantly White (86%)
- Race & ethnicity
- White 86% Hispanic / Latino 5% Two or more races 5% Asian 3% Black 3%
- Common ancestry
- Slovak 5% Lithuanian 4% Romanian 3%
- Foreign-born
- 10% · Canada, China
- Languages at home
- 92% English-only · Spanish 3% Russian/Polish/Slavic 1% Tagalog/Filipino 1%
Political lean MEDSL · Riverside
- 2024 margin
- Toss-up / Even · D 48.0% · R 49.3% · Other 2.6%
- 2008→2024 swing
- -3.6pp toward R · 2008: 2.3pp · 2024: -1.3pp
- All cycles
- 2024: R+1.3 2020: D+8.0 2016: D+4.3 2012: R+0.4 2008: D+2.3
Not yet ingested
- Civics
- —
Market trends
- HPI YoY
- ▲ 3.76%
- Current HPI
- 299.2632
- Rent YoY
- —
- Metro
- Riverside-San Bernardino-Ontario, CA
- State GDP YoY
- ▲ 3.21%
- F500 in state
- 116
Industry mix (Fortune 500 HQ in CA)
| Industry | F500 HQs | Revenue |
|---|---|---|
| Technology | 27 | $1,492B |
|
||
| Financial Services | 3 | $174B |
|
||
| Retail | 3 | $44B |
|
||
| Insurance | 3 | $26B |
|
||
| Media / Entertainment | 2 | $115B |
|
||
| Pharmaceuticals / Biotech | 2 | $62B |
|
||
Price history
+21.2% since first listed11 events — show timeline
- 2026-04-25 Pending — GPSMLS
- 2026-02-01 Listed $319,900 GPSMLS
- 2026-01-01 Listing Removed — GPSMLS
- 2025-08-01 Price Changed $319,900 GPSMLS
- 2025-06-03 Price Changed $330,000 GPSMLS
- 2025-05-13 Listing Removed — GPSMLS
- 2025-05-02 Price Changed $340,000 GPSMLS
- 2025-01-20 Listed $340,000 GPSMLS
- 2025-01-12 Listed $350,000 GPSMLS
- 2023-11-16 Listing Removed — GPSMLS
- 2023-05-25 Listed $264,000 GPSMLS
Cash-flow waterfall
monthlySold comps — $/sqft
last 12 mo · ≤1 miLoading sold comps…