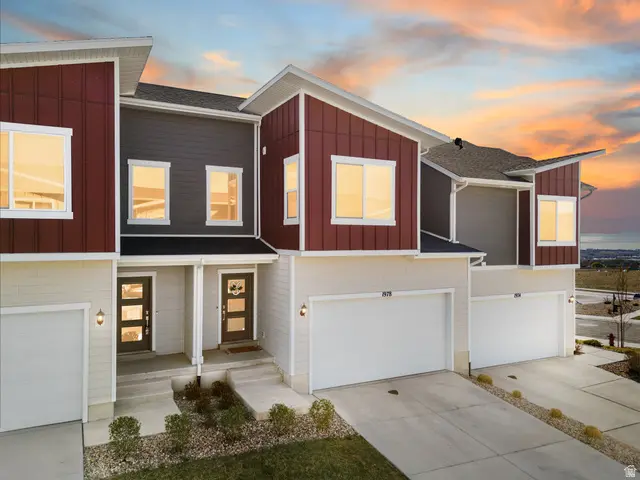
1978 N Red Yearling Dr · Saratoga Springs, UT
Flood risk 1/10 · Minimal
- FEMA flood zone
- X (unshaded)
- Chance of flooding over 30 yrs
- 0.0%
- Est. flood insurance / yr
- $507 – $1,088
Fire risk 8/10 · Major
- Est. fire insurance / yr
- $453 – $841
Heat risk 5/10 · Moderate
- Hot days now (above 93°F)
- 7 days/yr
- Hot days in 30 yrs
- 20 days/yr
Wind risk 1/10 · Minimal
- Chance of severe wind over 30 yrs
- —
Air-quality risk 2/10 · Minimal
- Unhealthy air days now
- 1 days/yr
- Unhealthy air days in 30 yrs
- 2 days/yr
Risk factors via First Street. Map © Google.
Why this score? — see what drove the D- grade
The composite is a weighted blend of 9 inputs, each scored 0–100. Each bar is that input's sub-score; the figure is the points it added to the 100-point composite (weight × sub-score).
- Appreciation +10.0/10.0
- ARV discount +7.5/15.0
- Cash flow +6.2/30.0
- Schools +4.2/10.0
- Livability +3.5/5.0
- Rent growth +2.7/5.0
- Condition / age +2.5/5.0
- 1% rule +0.8/10.0
- DSCR +0.6/10.0
$445,000
🖨 Deal sheet 📄 Offer letter ✓ Due diligence
Listing remarks
Mountain views, sunset nights, and a location you'll love. This Saratoga Springs townhome checks all the boxes. The open floor plan offers the perfect blend of style, comfort, and convenience. From the modern kitchen with large island, spacious primary suite, private balcony & patio-perfect for taking in those Utah sunsets. It's low-maintenance living at it's finest with parks, community reservoir, shopping & everyday conveniences just minutes away.
Key facts
- Private balcony
- Large island
- Modern kitchen
Tags
Property features AI
Finance
- Other: Subdivision: WILDFLOWER VILLAGE
- HOA & community: Homeowners association with monthly fee of $170; HOA fee includes insurance; Association allows pets; Community picnic area and playground; Snow removal provided
Exterior
- Parking: Attached garage; 2 garage spaces; 2 covered parking spaces; 2 open parking spaces; 4 total parking spaces
- Utilities: Natural gas connected; Electricity connected; Water connected
- Home design: Townhouse (row-mid); Built and standing; Multi-family zoning; Energy Star Certified Homes
- Construction: Built / standing construction
- Exterior features: Balcony; Sliding glass doors; Mountain view
Interior
- Kitchen: Refrigerator included
- Flooring: Carpet flooring
- Bathrooms: 2 full bathrooms; 1 half bathroom; 1 partial bathroom
- Heating & cooling: Gas central heating; Central air conditioning
- Interior features: Primary bathroom; Blinds on windows; Walk-out basement access; Approximately 15% of basement finished; 10 total rooms
Neighborhood map
What this means for you Summary
Snapshot
- This is a 3-bed/2.5-bath townhouse listed at $445k.
Deal economics
- At list price, monthly cash flow is $-801 ($-10k/yr) — negative.
- To cash-flow at today's rent, offer at most $303k (31.8% below list).
- To meet the 1% rule (rent ≥ 1% of price), the offer needs to be $259k (41.9% below list).
- Recommended offer: $259k (41.9% below list) — sets the bar for 1% rule.
Location & tenants
- Location reads 70/100 on livability (#93 in UT) — a middle-class / working-renter tenant base. Strengths: crime A+, employment A+, housing A+; Watch: amenities F, commute F, cost of living F.
- Alpine District (suburban): math 45% / reading 50% proficiency, ranked #25 of 80 in UT (top 31%) — families likely to look elsewhere, expect single-tenant / working-renter base with shorter leases; only 18% free/reduced lunch — higher-income household profile.
- Zoned schools: Harvest School (math 56% / reading 51%, grade C, #122 of 585 statewide, top 21%, 1,046 students, 15% FRL); Westlake High (math 39% / reading 48%, grade F, #50 of 171 statewide, top 29%, 2,659 students, 12% FRL).
- Market conditions: Rents flat; 1175 active listings in the ZIP; 24 comparable units currently listed for rent nearby; rentals at typical pace (median 14d on market — plan ~3-4 weeks tenant-placement turnaround); high-income renter base; 6,326 units permitted in Utah County in 2024 (1,053 in 5+ unit buildings).
Forward outlook
- In year one you build about $48k of equity ($3k loan paydown + $44k appreciation (10.0% local appreciation)).
- Utah County population projected at +49% by 2050 — long-run rental-demand tailwind backs the buy-and-hold thesis.
- By year 2, paydown + projected appreciation supports a ~$76k cash-out refi (75% LTV) — recoverable capital for the next deal without selling this one.
Negotiation context
- Only 14 days on market — expect competitive offers; lowballing is unlikely to land.
Risks & watch-outs
- Climate carrying-cost: severe wildfire risk; extreme-heat days projected 7→20/yr by 2055 (HVAC capex compounding) — expect insurance premiums to compound above CPI over the hold.
Questions for the listing agent
- What do current leases actually rent for vs. the listed asking? Can we see a recent rent roll and the last 12 months of T-12 income?
- What does the HOA fee cover, when was the last increase, and are there any pending special assessments or reserve-fund shortfalls?
- Is there a deadline driving the sale (1031 exchange, divorce, estate, relocation)? That informs how much negotiation room exists.
- Schools are B-rated — typically a magnet for longer-tenancy family renters. What's the average tenant stay here, and is there a school-zone premium baked into asking?
- The area grade is low — what's the realistic commute time and amenity access for the typical tenant pool here? Any planned neighborhood developments (good or bad) we should know about?
- What's the average days-on-market for RENTAL listings here right now (not sales)? A rising rental-DOM trend means longer vacancies and softer asking-rent achievability than the comps imply.
- What's the recent tenant-quality profile in this submarket — average credit score on applications, eviction rate, late-payment / NSF rate, and stable-employment percentage? A property-management company in the area should have these aggregated.
- How much new for-sale + rental construction is in the pipeline within 1–3 miles? Heavy new supply typically softens prices + rents 12–24 months out; constrained supply supports both.
Investment metrics
- 1% rule
- 0.58% ✗
- Cap rate
- 4.13%
- Cash-on-cash
- -7.71%
- DSCR
- 0.66
- GRM
- 14.3
CMA / ARV
No comps found within radius.
Projected returns pro-forma
10.0% appreciation · 0.68% rent growth · sell at horizon
- IRR
- 18.3%
- Equity multiple
- 2.49×
- Total profit
- $185,333
- Equity at exit
- $400,891
- IRR
- 16.7%
- Equity multiple
- 5.61×
- Total profit
- $574,815
- Equity at exit
- $864,537
Cash invested: $124,600 (down + closing). Projections, not guarantees.
Landlord ↔ Tenant lean methodology
- Overall (STATE)
- 86 Strongly Landlord-Friendly
- State Utah
- 86 Strongly Landlord-Friendly · R+15
- County
- — inherits STATE
- City
- — inherits STATE
ZIP-level market 84045
- Home prices YoY
- 3.9%
- Rents YoY
- 0.7%
- Active inventory
- 1175
- Price-to-rent
- 14.3×
Monthly cashflow live
- Estimated rent
- $2,587 high interval (Pro) →
- Mortgage (P&I)
- −$2,334
- Tax from tax record
- −$156 /mo · $1,872/yr
- Insurance
- −$185
- HOA
- −$170
- Vacancy / Maint / Mgmt
- −$543
- Net cashflow
- $-801
Break-even live
UW: 25.0% down · 7.5% · 30yr · 1.5% tax · 5.0% vac · 8.0% maint · 8.0% mgmt
Financing live
Cash to close
- Down payment
- $111,250
- Closing costs
- $13,350
- Reserves months
- —
- Total cash needed
- —
Loan-product check · same deal, 3 products live
Conventional
25% down · 7.5% · 30yr
- Down + closing
- —
- Monthly P&I
- —
- Monthly cashflow
- —
- DSCR
- —
- Eligible?
- —
Personal DTI + credit; lowest rate.
DSCR
20% down · 8.5% · 30yr
- Down + closing
- —
- Monthly P&I
- —
- Monthly cashflow
- —
- DSCR
- —
- Eligible?
- —
No personal income docs; deal must DSCR.
Hard money
10% down · 12.0% · 12mo
- Down + closing
- —
- Monthly P&I
- —
- Monthly cashflow
- —
- DSCR
- —
- Eligible?
- —
Short-term bridge; refi at stabilization.
Rent comps 24 comps
| Address | Beds | Baths | Sqft | Rent | $/sqft | DOM | Units | Dist |
|---|---|---|---|---|---|---|---|---|
| 1974 N Red Yearling Dr Saratoga Springs, UT | 3.0 | 2.5 | 2100 | $2,495 | $1.19 | 19d | 1 | 0.04mi |
| 2162 N Cloverleaf Way Saratoga Springs, UT | 4.0 | 2.5 | 2500 | $2,550 | $1.02 | 14d | 1 | 0.17mi |
| 2123 N Wallflower Dr Saratoga Springs, UT | 4.0 | 2.5 | 3728 | $2,785 | $0.75 | 2d | 1 | 0.19mi |
| 1316 Calypso Ln Saratoga Springs, UT | 3.0–4.0 | 2.0–3.0 | 1962 | $2,390 | $1.22 | 2d | 13 | 0.56mi |
| 2042 Golden Ruby Dr Eagle Mountain, UT | 4.0 | 3.5 | 2100 | $2,495 | $1.19 | 23d | 1 | 0.57mi |
| 2031 Golden Ruby Dr Eagle Mountain, UT | 3.0 | 2.5 | 2458 | $2,700 | $1.10 | 21d | 1 | 0.59mi |
| 1386 W Sharry Baby Dr Saratoga Springs, UT | 4.0 | 2.5 | 2004 | $2,095 | $1.05 | 2d | 1 | 0.66mi |
| 2548 N Yarrow Cir Saratoga Springs, UT | 3.0 | 2.5 | 2511 | $2,499 | $1.00 | 23d | 1 | 0.76mi |
| 2676 N Blue Dawn Ln Saratoga Springs, UT | 3.0 | 2.0 | 2280 | $2,250 | $0.99 | 2d | 1 | 0.82mi |
| 1508 Charmer Ln Eagle Mountain, UT | 4.0 | 2.5 | 1831 | $2,550 | $1.39 | 14d | 1 | 0.82mi |
| 2613 N Snowberry Dr Saratoga Springs, UT | 4.0 | 2.5 | 3180 | $3,300 | $1.04 | 2d | 1 | 0.84mi |
| 1545 Bravo Dr Eagle Mountain, UT | 4.0 | 2.5 | 1831 | $2,500 | $1.37 | 14d | 1 | 0.85mi |
| 2697 N Snowberry Dr Saratoga Springs, UT | 3.0 | 2.5 | 2569 | $2,695 | $1.05 | 2d | 1 | 0.94mi |
| 1642 W Blue Flax Dr Saratoga Springs, UT | 4.0 | 2.5 | 1831 | $3,000 | $1.64 | 23d | 1 | 0.98mi |
| 1688 Blue Flax Dr Eagle Mountain, UT | 4.0 | 2.5 | 2450 | $2,800 | $1.14 | 14d | 1 | 1.02mi |
| 2867 N Blue Dawn Ln Saratoga Springs, UT | 3.0 | 2.5 | 2280 | $2,250 | $0.99 | 2d | 1 | 1.06mi |
| 1632 N Apache Rd Saratoga Springs, UT | 3.0 | 2.5 | 2262 | $2,195 | $0.97 | 2d | 1 | 1.16mi |
| 803 N Hilltop Dr Lehi, UT | 4.0 | 3.5 | 2408 | $500 | $0.21 | 23d | 1 | 1.34mi |
| 4009 1180 N Saratoga Springs, UT | 4.0 | 2.5 | 2879 | $2,549 | $0.89 | 19d | 1 | 1.41mi |
| 4050 W 1470 N Lehi, UT | 4.0 | 2.5 | 3360 | $3,000 | $0.89 | 14d | 1 | 1.45mi |
| 1558 Banner Dr Saratoga Springs, UT | 4.0 | 2.5 | 2400 | $2,150 | $0.90 | 14d | 1 | 1.47mi |
| 4536 E Hurstbourne Dr Eagle Mountain, UT | 4.0 | 3.5 | 2350 | $2,125 | $0.90 | 2d | 1 | 1.49mi |
| 3935 W 1000 N Lehi, UT | 4.0 | 2.5 | 2100 | $3,000 | $1.43 | 23d | 1 | 1.49mi |
| 1547 Banner Dr Saratoga Springs, UT | 4.0 | 2.5 | 2413 | $2,150 | $0.89 | 23d | 1 | 1.49mi |
HOA detail
- Monthly dues
- $170 · $2,040/yr
Listing history 11 events
-
2026-06-18days on market $445,000 Active 14 DOM
-
2026-06-17days on market $445,000 Active 13 DOM
-
2026-06-16days on market $445,000 Active 12 DOM
-
2026-06-15days on market $445,000 Active 11 DOM
-
2026-06-14days on market $445,000 Active 9 DOM
-
2026-06-13days on market $445,000 Active 8 DOM
-
2026-06-10days on market $445,000 Active 6 DOM
-
2026-06-09days on market $445,000 Active 5 DOM
-
2026-06-08days on market $445,000 Active 4 DOM
-
2026-06-07remarks 457-char remark
-
2026-06-07$445,000 Active 3 DOM
ⓘ Source: listings_history table (triggers on properties + properties_extension) + one-shot
backfill from property_details.listing_events for pre-trigger history.
Tax reassessment forecast UT · Resets to sale price
- Current annual tax
- $1,872 · $156/mo
- Projected year-2 tax
- $2,937 · $245/mo
- Expected delta
- +$1,065/yr (+$89/mo · 56.9%)
ⓘ Screening estimate from a state-policy table — verify with the county assessor before closing.
Climate risk First Street
- Flood 1/10 Low FEMA zone X (unshaded) · 0% chance over 30 yrs
- Wildfire 8/10 Severe
- Heat 5/10 Major 7 d/yr ≥93°F today · 20 d/yr by 30 yrs out
- Wind 1/10 Low
- Air quality 2/10 Low 1 unhealthy d/yr today · 2 by 30 yrs out
Nearby sold comps map
Loading sold comps map…
Walkable amenities ~0.75 mi
Loading nearby amenities…
Taxation est. · year 1
- Rental income
- $31,048
- − Mortgage interest
- −$24,927
- − Property taxes
- −$1,872
- − Insurance
- −$2,225
- − Repairs & maintenance
- −$2,484
- − Management
- −$2,484
- − HOA
- −$2,040
- − Depreciation
- −$12,945
- Taxable loss
- −$17,929
- Est. tax savings @ 24.0%
- +$4,303
- After-tax cash flow
- $-5,310/yr
For passive investors: Depreciation is non-cash, so a rental often shows a tax loss while cash-flowing — sheltering income. Rental losses are passive: they offset passive income freely, and up to $25,000/yr can offset ordinary (W-2) income if you actively participate and your MAGI is under $100k (phasing out to $0 by $150k); unused losses carry forward. On sale, claimed depreciation is recaptured at up to 25%, and gains may owe capital-gains tax (a 1031 exchange can defer both). Figures are a year-1 estimate at your 24.0% rate — not tax advice; consult a CPA.
Schools (NCES district)
- District
- Alpine District
- NCES district ID
- 4900030
- Math proficiency
- 45% ▼ -4.00%
- Reading proficiency
- 50% ▼ -2.00%
- Median HH income
- $68,595
- Composite
- 42.48/100
- National rank
- #3213
- State rank
- #25 of 80 in UT
Livability — Saratoga Springs
- Score
- 70/100
- State rank
- #93
- US rank
- #7648
Category grades
Schools grade is shown separately in the Schools card above.
Census & demographics
- Census place
- Saratoga Springs, UT
- County
- Utah County · 661,754 people
- City population
- 45,429
- Metro
- Provo-Orem, UT
- Population (ZIP)
- 45,429
- Household income
- $130,331
- Rent vs Own
- Severe rent burden
- 476.0
Population outlook (Utah County) Hauer SSP2
- Today (2025)
- 693,420 people
- By 2030
- 757,324 · +9.2%
- By 2040
- 893,178 · +28.8%
- By 2050
- 1,035,842 · +49.4%
- By 2075
- 1,376,733 · +98.5%
- By 2100
- 1,609,388 · +132.1%
Race, ethnicity, and origin ACS 2023
- Neighborhood character
- Predominantly White (83%)
- Race & ethnicity
- White 83% Hispanic / Latino 12% Two or more races 9% Asian 1%
- Hispanic origin (detail)
- Mexican 6%
- Common ancestry
- Italian 7% Scottish 4% Slovak 4%
- Foreign-born
- 6% · Canada, Jamaica
- Languages at home
- 88% English-only · Spanish 9% Other Indo-European 1% Chinese 1%
Political lean MEDSL · Utah
- 2024 margin
- Solid R (+39.8) · D 28.5% · R 68.3% · Other 3.2%
- 2008→2024 swing
- +19.1pp toward D · 2008: -58.9pp · 2024: -39.8pp
- All cycles
- 2024: R+39.8 2020: R+41.0 2016: R+37.3 2012: R+78.5 2008: R+58.9
Not yet ingested
- Civics
- —
Market trends
- HPI YoY
- ▲ 11.09%
- Current HPI
- 298.0545
- Rent YoY
- ▲ 0.68%
- Metro
- Provo-Orem, UT
- State GDP YoY
- ▲ 3.54%
- F500 in state
- 2
Industry mix (Fortune 500 HQ in UT)
| Industry | F500 HQs | Revenue |
|---|---|---|
| Financial Services | 1 | $3B |
|
||
Price history
1 event — show timeline
- 2026-06-04 Listed $445,000 WFRMLS
Property tax history
+49.9%/yrLatest (2025): $1,872 · -0.7% YoY. Source: county tax records.
Cash-flow waterfall
monthlySold comps — $/sqft
last 12 mo · ≤1 miLoading sold comps…