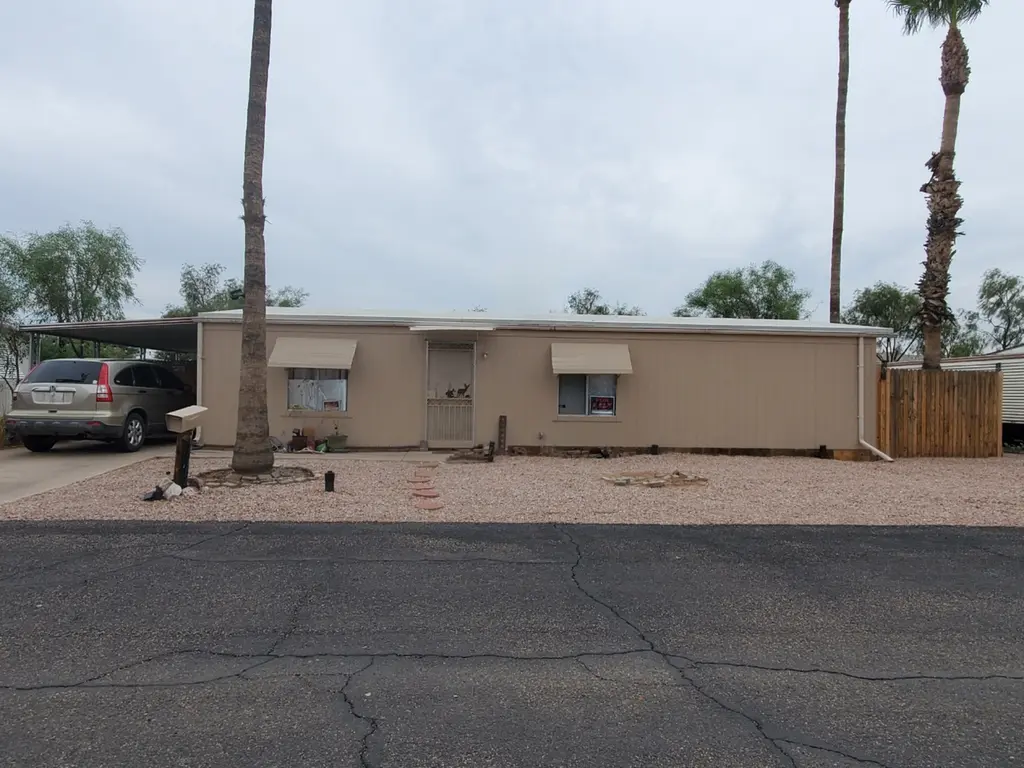
200 E Ivanhoe St · Chandler, AZ
Flood risk 1/10 · Minimal
- FEMA flood zone
- X (shaded)
- Chance of flooding over 30 yrs
- 0.0%
- Est. flood insurance / yr
- $507 – $1,088
Fire risk 1/10 · Minimal
- Est. fire insurance / yr
- $610 – $1,132
Heat risk 9/10 · Severe
- Hot days now (above 111°F)
- 7 days/yr
- Hot days in 30 yrs
- 19 days/yr
Wind risk 1/10 · Minimal
- Chance of severe wind over 30 yrs
- —
Air-quality risk 2/10 · Minimal
- Unhealthy air days now
- 0 days/yr
- Unhealthy air days in 30 yrs
- 1 days/yr
Risk factors via First Street. Map © Google.
Why this score? — see what drove the D+ grade
The composite is a weighted blend of 9 inputs, each scored 0–100. Each bar is that input's sub-score; the figure is the points it added to the 100-point composite (weight × sub-score).
- Cash flow +15.0/30.0
- ARV discount +7.5/15.0
- 1% rule +5.0/10.0
- DSCR +5.0/10.0
- Schools +4.8/10.0
- Livability +3.9/5.0
- Condition / age +2.5/5.0
- Rent growth +2.1/5.0
- Appreciation +0.0/10.0
$55,000
🖨 Deal sheet 📄 Offer letter ✓ Due diligence
Listing remarks MLS
Affordable 3 bedroom 2 bathroom manufactured home in a 55community in Chandler AZ. Year-round primary residence or a seasonal "snowbird" home. This ground-level mobile home is wheelchair accessible, and doesn't actually look like a typical mobile home. -- ---------------------------------------------------- Home features: Remodeled doublewide - Open floorplan - New flooring throughout - New paint inside/outside - New washer & dryer - New master bath - 2nd bath ready to customize -Wheelchair accessible- No Stairs - Mini-split heat & cool - 1 window AC - 2 sheds - Fenced yard - Pets ok - Covered back patio - Covered parking - Carport for 2-3 cars - Desert landscaping. -- ---------------------------------------------------- Community includes: Clubhouse - Barbecues - Community pool - Great neighbors - 55+ community - Convenient location near Downtown Chandler, restaurants, shops, etc. - $1200/monthly land lease separate from purchase price. -- ---------------------------------------------------- If you are interested in purchasing this home, please CALL (619) 722-0233 (no texts please). We will help you apply with the park management via email, to qualify for the park before viewing the home. All offers considered!
Key facts
- New master bath
- Fenced yard
- New flooring
Tags
Property features AI
Exterior
- Home design: Built in 1983
- Construction: Built in 1983
- Exterior features: Patio
Interior
- Interior features: Pantry; Patio
Neighborhood map
What this means for you Summary
Snapshot
- This is a 3-bed/1.5-bath land listed at $55k.
Deal economics
- At list price, monthly cash flow is $2k ($19k/yr) — positive.
- The deal already cash-flows at list — no discount required.
- Meets the 1% rule at list price ($2k rent vs $55k).
- Recommended offer: $53k (3.0% below list) — sets the bar for market timing.
- Cap rate 40.7% vs local median 3.3% in Chandler — top-decile yield for the area; either an underpriced asset or a hidden risk that comps aren't pricing in. Stress-test before assuming the spread holds.
Location & tenants
- Location reads 78/100 on livability (#9 in AZ, #2,508 nationally) — a middle-class / working-renter tenant base. Strengths: employment A+, housing A+, crime A-; Watch: health & safety D, cost of living D-.
- Chandler Unified District #80 (4242) (suburban): math 49% / reading 57% proficiency, ranked #31 of 249 in AZ (top 12%) — acceptable for families but not a draw, mixed tenant base, ~2y average lease.
- Market conditions: Rents soft (-1.7%/yr); 182 active listings in the ZIP; 36 comparable units currently listed for rent nearby; rentals at typical pace (median 19d on market — plan ~3-4 weeks tenant-placement turnaround); solid renter incomes; 36,011 units permitted in Maricopa County in 2024 (12,801 in 5+ unit buildings).
- This rent runs 34% of the median local income ($89k/yr) — at the standard rent-burdened threshold; future hikes will face affordability resistance.
Forward outlook
- Local home prices are declining (-3.0%/yr); year-one equity from $380 of loan paydown is wiped out by about $2k of value loss. Plan a longer hold.
- Maricopa County population projected at +38% by 2050 — long-run rental-demand tailwind backs the buy-and-hold thesis.
- At projected returns (-3.0% appreciation + 0.0% rent growth), your $15k cash investment doubles in ~1 year — after that, you're playing with house money.
Negotiation context
- It's been on market 50 days — a 3% lower offer ($53k) is reasonable based on typical stale-listing flexibility.
- 4 sale attempts; this cycle's ask has dropped $18k (24%) from the opening price — seller is motivated, your offer sets the floor, not the list.
Risks & watch-outs
- Climate carrying-cost: extreme-heat days projected 7→19/yr by 2055 (HVAC capex compounding) — expect insurance premiums to compound above CPI over the hold.
Questions for the listing agent
- It's been on market 50 days. Have you received any prior offers? Is the seller open to a 3% concession, seller financing, or rate buy-down credit?
- Is there a deadline driving the sale (1031 exchange, divorce, estate, relocation)? That informs how much negotiation room exists.
- Schools are B-rated — typically a magnet for longer-tenancy family renters. What's the average tenant stay here, and is there a school-zone premium baked into asking?
- The area grade is low — what's the realistic commute time and amenity access for the typical tenant pool here? Any planned neighborhood developments (good or bad) we should know about?
- What's the average days-on-market for RENTAL listings here right now (not sales)? A rising rental-DOM trend means longer vacancies and softer asking-rent achievability than the comps imply.
- What's the recent tenant-quality profile in this submarket — average credit score on applications, eviction rate, late-payment / NSF rate, and stable-employment percentage? A property-management company in the area should have these aggregated.
- How much new for-sale + rental construction is in the pipeline within 1–3 miles? Heavy new supply typically softens prices + rents 12–24 months out; constrained supply supports both.
Investment metrics
- 1% rule
- 4.51% ✓
- Cap rate
- 40.75%
- Cash-on-cash
- 123.05%
- DSCR
- 6.48
- GRM
- 1.8
CMA / ARV
No comps found within radius.
Projected returns pro-forma
-3.0% appreciation · 0.0% rent growth · sell at horizon
- IRR
- —
- Equity multiple
- 6.48×
- Total profit
- $84,435
- Equity at exit
- $8,201
- IRR
- —
- Equity multiple
- 12.37×
- Total profit
- $175,099
- Equity at exit
- $4,755
Cash invested: $15,400 (down + closing). Projections, not guarantees.
Landlord ↔ Tenant lean methodology
- Overall (STATE)
- 87 Strongly Landlord-Friendly
- State Arizona
- 87 Strongly Landlord-Friendly · R+3
- County
- — inherits STATE
- City
- — inherits STATE
ZIP-level market 85225
- Home prices YoY
- -28.1%
- Rents YoY
- -1.7%
- Active inventory
- 182
- Price-to-rent
- 1.8×
Monthly cashflow live
- Estimated rent
- $2,480 high interval (Pro) →
- Mortgage (P&I)
- −$288
- Tax est. 1.5%
- −$69 /mo · $825/yr
- Insurance
- −$23
- HOA
- −$0
- Vacancy / Maint / Mgmt
- −$521
- Net cashflow
- $1,579
Break-even live
UW: 25.0% down · 7.5% · 30yr · 1.5% tax · 5.0% vac · 8.0% maint · 8.0% mgmt
Financing live
Cash to close
- Down payment
- $13,750
- Closing costs
- $1,650
- Reserves months
- —
- Total cash needed
- —
Loan-product check · same deal, 3 products live
Conventional
25% down · 7.5% · 30yr
- Down + closing
- —
- Monthly P&I
- —
- Monthly cashflow
- —
- DSCR
- —
- Eligible?
- —
Personal DTI + credit; lowest rate.
DSCR
20% down · 8.5% · 30yr
- Down + closing
- —
- Monthly P&I
- —
- Monthly cashflow
- —
- DSCR
- —
- Eligible?
- —
No personal income docs; deal must DSCR.
Hard money
10% down · 12.0% · 12mo
- Down + closing
- —
- Monthly P&I
- —
- Monthly cashflow
- —
- DSCR
- —
- Eligible?
- —
Short-term bridge; refi at stabilization.
Rent comps 36 comps
| Address | Beds | Baths | Sqft | Rent | $/sqft | DOM | Units | Dist |
|---|---|---|---|---|---|---|---|---|
| 532 W Dublin St Chandler, AZ | 3.0 | 2.0 | 2302 | $2,050 | $0.89 | 12d | 1 | 0.49mi |
| 123 N Washington St #45 Chandler, AZ | 3.0 | 2.5 | 1523 | $2,700 | $1.77 | 5d | 1 | 0.79mi |
| 536 N Cheri Lynn Dr Chandler, AZ | 3.0 | 2.0 | 1579 | $2,295 | $1.45 | 11d | 1 | 0.79mi |
| 123 N Washington St Chandler, AZ | 2.0 | 2.5 | 1523 | $2,500 | $1.64 | 24d | 1 | 0.80mi |
| 510 E Kent Ave Chandler, AZ | 3.0 | 2.0 | 1422 | $2,190 | $1.54 | 2d | 1 | 0.83mi |
| 124 N California St Chandler, AZ | 3.0 | 3.5 | 1974 | $2,495 | $1.26 | 24d | 1 | 0.84mi |
| 121 N California St #22 Chandler, AZ | 3.0 | 3.5 | 1694 | $2,600 | $1.53 | 43d | 1 | 0.85mi |
| 1211 N Jackson St Chandler, AZ | 3.0 | 2.0 | 1528 | $2,195 | $1.44 | 5d | 1 | 0.86mi |
| 650 W Kent Pl Chandler, AZ | 3.0 | 2.5 | 1933 | $2,995 | $1.55 | 5d | 1 | 0.95mi |
| 837 W Baylor Ln Chandler, AZ | 4.0 | 3.0 | 2222 | $2,695 | $1.21 | 43d | 1 | 0.97mi |
| 1168 N Burbank Ct Chandler, AZ | 4.0 | 4.0 | 2222 | $2,900 | $1.31 | 5d | 1 | 1.03mi |
| 677 E Commonwealth Pl Unit 3 Chandler, AZ | 3.0 | 2.5 | 1582 | $2,535 | $1.60 | 5d | 1 | 1.09mi |
| 677 E Commonwealth Pl Chandler, AZ | 3.0 | 3.0 | 1582 | $2,535 | $1.60 | 3d | 1 | 1.09mi |
| 677 E Commonwealth Ave Chandler, AZ | 3.0 | 2.5 | 1582 | $2,535 | $1.60 | 5d | 1 | 1.12mi |
| 955 E Knox Rd Chandler, AZ | 3.0 | 2.0 | 1848 | $2,172 | $1.18 | 43d | 2 | 1.14mi |
| 1080 E Flint St Chandler, AZ | 3.0 | 2.0 | 1728 | $2,850 | $1.65 | 43d | 1 | 1.15mi |
| 733 E Commonwealth Ave #27 Chandler, AZ | 3.0 | 2.5 | 1823 | $2,195 | $1.20 | 1d | 1 | 1.15mi |
| 733 E Commonwealth Ave Unit 39 Chandler, AZ | 4.0 | 4.5 | 2160 | $2,695 | $1.25 | 43d | 1 | 1.15mi |
| 733 E Commonwealth Ave Unit 20 Chandler, AZ | 4.0 | 4.5 | 2160 | $2,595 | $1.20 | 43d | 1 | 1.15mi |
| 733 E Commonwealth Ave #36 Chandler, AZ | 3.0 | 2.5 | 1807 | $2,195 | $1.21 | 43d | 1 | 1.15mi |
| 733 E Commonwealth Ave Unit 24 Chandler, AZ | 4.0 | 4.5 | 2160 | $2,599 | $1.20 | 15d | 1 | 1.18mi |
| 733 E Commonwealth Ave Unit 38 Chandler, AZ | 3.0 | 2.5 | 1807 | $2,195 | $1.21 | 24d | 1 | 1.18mi |
| 733 E Commonwealth Ave Unit 17 Chandler, AZ | 3.0 | 2.5 | 1807 | $2,195 | $1.21 | 18d | 1 | 1.18mi |
| 1380 N Concord Ave Chandler, AZ | 4.0 | 2.5 | 2957 | $3,200 | $1.08 | 5d | 1 | 1.22mi |
| 277 N Jesse St Chandler, AZ | 3.0 | 2.0 | 1788 | $2,400 | $1.34 | 11d | 1 | 1.22mi |
| 369 W Fairway Pl Chandler, AZ | 3.0 | 2.0 | 1925 | $2,700 | $1.40 | 24d | 1 | 1.23mi |
| 701 N Comanche Dr Chandler, AZ | 3.0 | 2.0 | 1912 | $2,435 | $1.27 | 5d | 1 | 1.24mi |
| 702 N Comanche Dr Chandler, AZ | 3.0 | 2.0 | 1915 | $1,200 | $0.63 | 5d | 1 | 1.27mi |
| 155 E Frye Rd Chandler, AZ | 1.0–3.0 | 1.0–2.0 | 1213 | $3,136 | $2.59 | 1d | 25 | 1.29mi |
| 1271 W Gail Dr Chandler, AZ | 3.0 | 2.0 | 1517 | $2,195 | $1.45 | 43d | 1 | 1.34mi |
| 144 S Kingston St Chandler, AZ | 3.0 | 2.0 | 1428 | $2,650 | $1.86 | 24d | 1 | 1.36mi |
| 811 E Chicago St Chandler, AZ | 4.0 | 2.0 | 2045 | $2,695 | $1.32 | 43d | 1 | 1.37mi |
| 741 W San Marcos Dr Chandler, AZ | 4.0 | 2.5 | 2477 | $3,500 | $1.41 | 43d | 1 | 1.41mi |
| 1370 W Gary Dr Chandler, AZ | 3.0 | 2.0 | 1468 | $2,375 | $1.62 | 22d | 1 | 1.43mi |
| 670 E Mariposa Pl Chandler, AZ | 4.0 | 2.5 | 1661 | $2,195 | $1.32 | 5d | 1 | 1.47mi |
| 1420 W Iris Dr Gilbert, AZ | 3.0 | 2.0 | 1812 | $3,650 | $2.01 | 43d | 1 | 1.50mi |
Listing history 28 events
-
2026-06-18days on market $55,000 Active 50 DOM
-
2026-06-17pricedays on market $55,000 Active 49 DOM
-
2026-06-17days on market $20,000 Active 22 DOM
-
2026-06-16days on market $20,000 Active 21 DOM
-
2026-06-15days on market $20,000 Active 20 DOM
-
2026-06-13days on market $20,000 Active 18 DOM
-
2026-06-13days on market $20,000 Active 17 DOM
-
2026-06-09days on market $20,000 Active 14 DOM
-
2026-06-08days on market $20,000 Active 13 DOM
-
2026-06-07days on market $20,000 Active 12 DOM
-
2026-06-04days on market $20,000 Active 9 DOM
Show marketing remark (1271 chars)
Affordable 3 bedroom 2 bathroom manufactured home in a 55community in Chandler AZ. Year-round primary residence or a seasonal "snowbird" home. This ground-level mobile home is wheelchair accessible, and doesn't actually look like a typical mobile home. -- ---------------------------------------------------- Home features: Remodeled doublewide - Open floorplan - New flooring throughout - New paint inside/outside - New washer & dryer - New master bath - 2nd bath ready to customize -Wheelchair accessible- No Stairs - Mini-split heat & cool - 1 window AC - 2 sheds - Fenced yard - Pets ok - Covered back patio - Covered parking - Carport for 2-3 cars - Desert landscaping. -- ---------------------------------------------------- Community includes: Clubhouse - Barbecues - Community pool - Great neighbors - 55+ community - Convenient location near Downtown Chandler, restaurants, shops, etc. - $1200/monthly land lease separate from purchase price. -- ---------------------------------------------------- If you are interested in purchasing this home, please CALL (619) 722-0233 (no texts please). We will help you apply with the park management via email, to qualify for the park before viewing the home. All offers considered!
-
2026-06-03days on market $20,000 Active 8 DOM
-
2026-06-02days on market $20,000 Active 7 DOM
-
2026-06-01days on market $20,000 Active 6 DOM
-
2026-05-31days on market $20,000 Active 5 DOM
-
2026-05-17price $56,900 1857-char remark
-
2026-04-29$60,000 Active 1857-char remark
-
2025-12-19soldstatus $14,500,000
-
2025-06-13historical
-
2025-05-28price $62,000
-
2025-05-23price $62,500
-
2025-05-18price $63,900
-
2025-05-12price $65,000
-
2025-05-08$69,000 Active
-
2019-07-31soldstatus $6,750,000
-
2005-02-22soldstatus $8,575,000
-
1997-08-29soldstatus $1,664,000
-
1985-07-11soldstatus $225,000
ⓘ Source: listings_history table (triggers on properties + properties_extension) + one-shot
backfill from property_details.listing_events for pre-trigger history.
Climate risk First Street
- Flood 1/10 Low FEMA zone X (shaded) · 0% chance over 30 yrs
- Wildfire 1/10 Low
- Heat 9/10 Extreme 7 d/yr ≥111°F today · 19 d/yr by 30 yrs out
- Wind 1/10 Low
- Air quality 2/10 Low 0 unhealthy d/yr today · 1 by 30 yrs out
Nearby sold comps map
Loading sold comps map…
Walkable amenities ~0.75 mi
Loading nearby amenities…
Taxation est. · year 1
- Rental income
- $29,761
- − Mortgage interest
- −$3,081
- − Property taxes
- −$825
- − Insurance
- −$275
- − Repairs & maintenance
- −$2,381
- − Management
- −$2,381
- − Depreciation
- −$1,600
- Taxable income
- $19,218
- Est. tax owed @ 24.0%
- −$4,612
- After-tax cash flow
- $14,338/yr
For passive investors: Depreciation is non-cash, so a rental often shows a tax loss while cash-flowing — sheltering income. Rental losses are passive: they offset passive income freely, and up to $25,000/yr can offset ordinary (W-2) income if you actively participate and your MAGI is under $100k (phasing out to $0 by $150k); unused losses carry forward. On sale, claimed depreciation is recaptured at up to 25%, and gains may owe capital-gains tax (a 1031 exchange can defer both). Figures are a year-1 estimate at your 24.0% rate — not tax advice; consult a CPA.
Schools (NCES district)
- District
- Chandler Unified District #80 (4242)
- NCES district ID
- 0401870
- Math proficiency
- 49% ▼ -8.00%
- Reading proficiency
- 57% ▼ -2.00%
- Median HH income
- $74,048
- Composite
- 47.54/100
- National rank
- #2268
- State rank
- #31 of 249 in AZ
Livability — Chandler
- Score
- 78/100
- State rank
- #9
- US rank
- #2508
Category grades
Schools grade is shown separately in the Schools card above.
Census & demographics
- Census place
- Chandler, AZ
- County
- Maricopa County · 4,537,380 people
- City population
- 299,016
- Metro
- Phoenix-Mesa-Chandler, AZ
- Population (ZIP)
- 72,297
- Household income
- $88,676
- Rent vs Own
- Severe rent burden
- 2327.0
Population outlook (Maricopa County) Hauer SSP2
- Today (2025)
- 4,979,203 people
- By 2030
- 5,378,229 · +8.0%
- By 2040
- 6,156,598 · +23.6%
- By 2050
- 6,872,376 · +38.0%
- By 2075
- 8,401,270 · +68.7%
- By 2100
- 9,247,439 · +85.7%
Race, ethnicity, and origin ACS 2023
- Neighborhood character
- Diverse neighborhood (Simpson 0.65)
- Race & ethnicity
- White 48% Hispanic / Latino 34% Two or more races 16% Black 7% Asian 6% Native American 2%
- Hispanic origin (detail)
- Mexican 29% Puerto Rican 1%
- Common ancestry
- Romanian 2% Lithuanian 2% Portuguese 1%
- Foreign-born
- 16% · Canada, Vietnam, China
- Languages at home
- 72% English-only · Spanish 21% Vietnamese 1% Chinese 1%
Political lean MEDSL · Maricopa
- 2024 margin
- Toss-up / Even · D 47.7% · R 51.2% · Other 1.1%
- 2008→2024 swing
- +7.1pp toward D · 2008: -10.6pp · 2024: -3.5pp
- All cycles
- 2024: R+3.5 2020: D+2.2 2016: R+3.5 2012: R+12.0 2008: R+10.6
Not yet ingested
- Civics
- —
Market trends
- HPI YoY
- ▼ -128.25%
- Current HPI
- 328.8354
- Rent YoY
- ▼ -1.66%
- Metro
- Phoenix-Mesa-Chandler, AZ
- State GDP YoY
- ▲ 4.54%
- F500 in state
- 20
Industry mix (Fortune 500 HQ in AZ)
| Industry | F500 HQs | Revenue |
|---|---|---|
| Technology | 2 | $13B |
|
||
| Mining / Metals | 1 | $23B |
|
||
| Environmental Services | 1 | $16B |
|
||
| Metals / Steel | 1 | $14B |
|
||
| Technology Distribution | 1 | $9B |
|
||
| Homebuilding | 1 | $8B |
|
||
Price history
-75.6% since first listed16 events — show timeline
- 2026-06-06 Price Changed $55,000 FSBO.com
- 2026-06-04 Listed $72,500 ForSaleByOwner.com
- 2026-06-04 Listed — ForSaleByOwner.com
- 2026-05-17 Price Changed $56,900 FSBO.com
- 2026-04-29 Listed $60,000 FSBO.com
- 2025-12-19 Sold (Public Records) $14,500,000 Public Records
- 2025-06-13 Listing Removed — ARMLS
- 2025-05-28 Price Changed $62,000 ARMLS
- 2025-05-23 Price Changed $62,500 ARMLS
- 2025-05-18 Price Changed $63,900 ARMLS
- 2025-05-12 Price Changed $65,000 ARMLS
- 2025-05-08 Listed $69,000 ARMLS
- 2019-07-31 Sold (Public Records) $6,750,000 Public Records
- 2005-02-22 Sold (Public Records) $8,575,000 Public Records
- 1997-08-29 Sold (Public Records) $1,664,000 Public Records
- 1985-07-11 Sold (Public Records) $225,000 Public Records
Property tax history
+2.0%/yrLatest (2025): $16,731 · +1.6% YoY. Source: county tax records.
Cash-flow waterfall
monthlySold comps — $/sqft
last 12 mo · ≤1 miLoading sold comps…