 Duplex
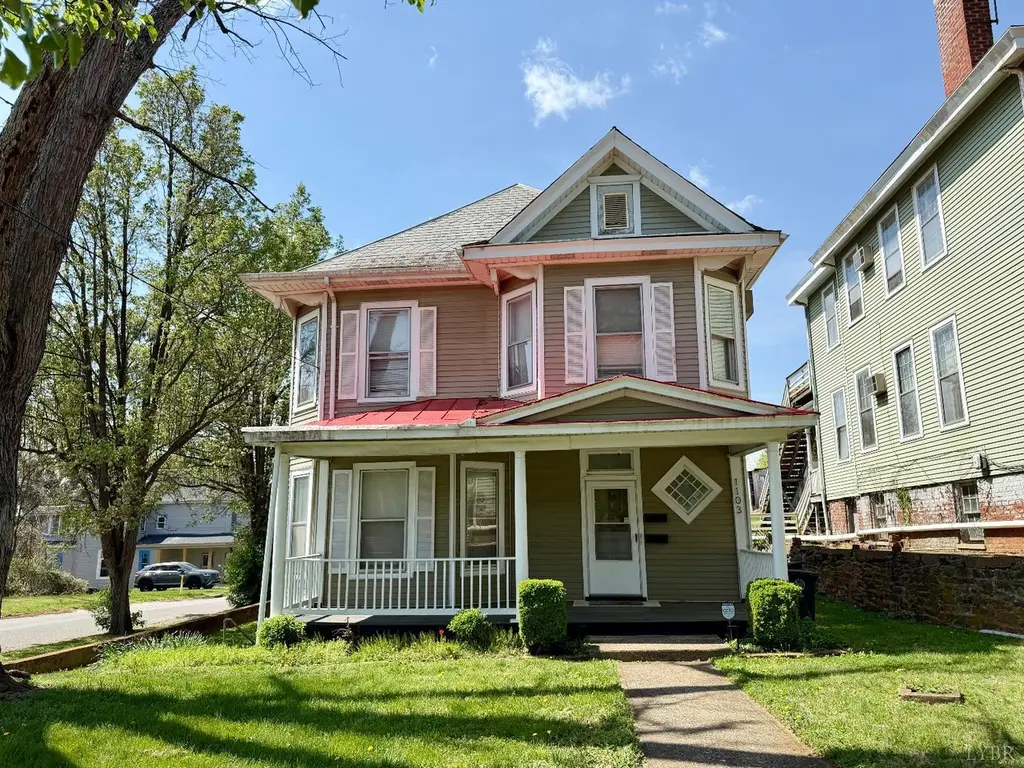
1103 Rivermont Ave · Lynchburg, VA
Flood risk 1/10 · Minimal
- FEMA flood zone
- X (unshaded)
- Chance of flooding over 30 yrs
- 0.0%
- Est. flood insurance / yr
- $507 – $1,088
Fire risk 1/10 · Minimal
- Est. fire insurance / yr
- $666 – $1,236
Heat risk 6/10 · Moderate
- Hot days now (above 102°F)
- 7 days/yr
- Hot days in 30 yrs
- 19 days/yr
Wind risk 2/10 · Minimal
- Chance of severe wind over 30 yrs
- 2.0%
Air-quality risk 2/10 · Minimal
- Unhealthy air days now
- 0 days/yr
- Unhealthy air days in 30 yrs
- 1 days/yr
Risk factors via First Street. Map © Google.
Why this score? — see what drove the B- grade
The composite is a weighted blend of 9 inputs, each scored 0–100. Each bar is that input's sub-score; the figure is the points it added to the 100-point composite (weight × sub-score).
- Cash flow +29.7/30.0
- DSCR +10.0/10.0
- 1% rule +7.6/10.0
- ARV discount +6.8/15.0
- Livability +4.5/5.0
- Schools +4.0/10.0
- Rent growth +3.6/5.0
- Condition / age +2.5/5.0
- Appreciation +0.0/10.0
$194,900
🖨 Deal sheet 📄 Offer letter ✓ Due diligence
Multi-family units
County records classify this as Multi-Family (2-4 Unit). Listing-text estimate: 2 units. confirmed
Listing remarks MLS
Located in the heart of Lynchburg, this charming duplex at 1103 Rivermont Ave offers a fantastic investment opportunity. The main level features 2 bedrooms, 1 full bathroom, and a kitchen equipped with refrigerator, microwave, and stove. The upper unit offers 3 bedrooms, 1 full bathroom, and a kitchen with refrigerator, stove ideal for separate living spaces or rental income potential. This property is just minutes from several local universities, making it attractive for student or faculty housing. The home is approximately 7 miles from Liberty University, less than 4 miles from University of Lynchburg, and roughly 1 mile from Randolph College. Enjoy convenient access to downtown dining, shopping, and the scenic James River while owning a property full of historic character and strong rental potential.
Key facts
- Historic character
- Scenic james river
- 6,229 sq ft lot
Tags
Neighborhood map
What this means for you Summary
Snapshot
- This is a 1×2bd/1ba + 1×3bd/1ba units multifamily listed at $195k.
Deal economics
- At list price, monthly cash flow is $710 ($9k/yr) — positive. Per door: $355/mo.
- The deal already cash-flows at list — no discount required.
- Meets the 1% rule at list price ($2k rent vs $195k).
- Recommended offer: $189k (3.0% below list) — sets the bar for market timing.
- Cap rate 10.7% vs local median 4.0% in Lynchburg — top-decile yield for the area; either an underpriced asset or a hidden risk that comps aren't pricing in. Stress-test before assuming the spread holds.
Location & tenants
- Location reads 91/100 on livability (#1 in VA, #58 nationally) — a professional / high-income tenant draw. Strengths: amenities A+, commute A+, cost of living A+; Watch: crime C-, employment D+.
- Lynchburg City Public School District (urban): math 36% / reading 61% proficiency, ranked #104 of 131 in VA (top 79%) — families likely to look elsewhere, expect single-tenant / working-renter base with shorter leases; 61% free/reduced lunch — lower-income household profile, screen leases tightly.
- Market conditions: Rents rising fast (+4.6%/yr); 105 active listings in the ZIP; 9 comparable units currently listed for rent nearby; rentals at typical pace (median 21d on market — plan ~3-4 weeks tenant-placement turnaround); 44% of comp listings sitting > 30 days — soft ceiling on asking rent; 472 units permitted in Lynchburg city in 2024 (240 in 5+ unit buildings).
- At $2,452/mo this rent would consume 56% of the median local household income ($53k/yr) (locally 552% of renters already pay >50% of income on rent) — very limited rent-growth headroom before tenants either downsize or default.
Forward outlook
- Local home prices are declining (-3.0%/yr); year-one equity from $1k of loan paydown is wiped out by about $6k of value loss. Plan a longer hold.
- Lynchburg County population projected at +37% by 2050 — long-run rental-demand tailwind backs the buy-and-hold thesis.
- At projected returns (-3.0% appreciation + 4.6% rent growth), your $55k cash investment doubles in ~7 years — after that, you're playing with house money.
Negotiation context
- It's been on market 44 days — a 3% lower offer ($189k) is reasonable based on typical stale-listing flexibility.
- 11 sale attempts since 8y ago with the ask held roughly flat each time — persistent listings suggest the price (not the market) is what's stuck; bring a comps-based counter.
- Current owner paid $152k; 28% above their basis — modest negotiation headroom, anchor on the comps not their cost.
Risks & watch-outs
- Watch-outs: built in 1905 — expect roof / HVAC / electrical / plumbing capex.
- Climate carrying-cost: extreme-heat days projected 7→19/yr by 2055 (HVAC capex compounding) — expect insurance premiums to compound above CPI over the hold.
Questions for the listing agent
- It's been on market 44 days. Have you received any prior offers? Is the seller open to a 3% concession, seller financing, or rate buy-down credit?
- Can we see the unit-by-unit rent roll, current vacancy, and any below-market leases? What's the average tenancy length?
- What capital expenditures (roof, boiler, parking lot, exteriors) have been made in the last 5 years, and what's planned in the next 2?
- Built in 1905 — when were the roof, HVAC, electrical panel, plumbing, and water heater last replaced?
- Is there a deadline driving the sale (1031 exchange, divorce, estate, relocation)? That informs how much negotiation room exists.
- Schools are A-rated — typically a magnet for longer-tenancy family renters. What's the average tenant stay here, and is there a school-zone premium baked into asking?
- What's the average days-on-market for RENTAL listings here right now (not sales)? A rising rental-DOM trend means longer vacancies and softer asking-rent achievability than the comps imply.
- What's the recent tenant-quality profile in this submarket — average credit score on applications, eviction rate, late-payment / NSF rate, and stable-employment percentage? A property-management company in the area should have these aggregated.
- How much new apartment / multifamily construction is in the pipeline within 1–3 miles? Heavy new supply (>2% of stock underway) typically softens rents 12–24 months out; light construction supports rent growth.
Investment metrics
- 1% rule
- 1.26% ✓
- Cap rate
- 10.67%
- Cash-on-cash
- 15.62%
- DSCR
- 1.69
- GRM
- 6.6
CMA / ARV
- ARV (median comp)
- $191,834
- List price
- $194,900
- Delta
- 1.60%
- Verdict
- FAIR
- Comps
- 16 within 1.0 mi
Show comp detail 2 sales within ~0.75 mi
| Address | Dist | Beds/Ba | Sqft | Sold | Price | $/sf | Match |
|---|---|---|---|---|---|---|---|
| 1103 Rivermont Ave | 0.00mi | 5/— (+1) | 2,109 (0%) | 0mo | $180,000 | $85 | 95 |
| 48 Easton Ave | 0.50mi | 3/— (-1) | 2,220 (+5%) | 3mo | $150,000 | $68 | 60 |
Match score weights: distance 35% · size 25% · config 20% · recency 20%. Top-matched comps best support the ARV.
Projected returns pro-forma
-3.0% appreciation · 4.56% rent growth · sell at horizon
- IRR
- 8.1%
- Equity multiple
- 1.32×
- Total profit
- $17,521
- Equity at exit
- $29,060
- IRR
- 18.5%
- Equity multiple
- 2.65×
- Total profit
- $89,907
- Equity at exit
- $16,851
Cash invested: $54,572 (down + closing). Projections, not guarantees.
Landlord ↔ Tenant lean methodology
- Overall (STATE)
- 55 Moderately Landlord-Leaning
- State Virginia
- 55 Moderately Landlord-Leaning · D+2
- County
- — inherits STATE
- City
- — inherits STATE
ZIP-level market 24504
- Home prices YoY
- -12.7%
- Rents YoY
- 4.6%
- Active inventory
- 105
- Price-to-rent
- 13.9×
Monthly cashflow live
- Estimated rent
- $2,452 high interval (Pro) →
- Mortgage (P&I)
- −$1,022
- Tax from tax record
- −$124 /mo · $1,483/yr
- Insurance
- −$81
- HOA
- −$0
- Vacancy / Maint / Mgmt
- −$515
- Net cashflow
- $710
Break-even live
2-unit breakdown (identical units grouped — click to expand)
| Units | Beds | Baths | Est. rent |
|---|---|---|---|
| 1× unit | 2 | 1 | $1,168 |
| 1× unit | 3 | 1 | $1,284 |
| Total (2 units) | $2,452 | ||
UW: 25.0% down · 7.5% · 30yr · 1.5% tax · 5.0% vac · 8.0% maint · 8.0% mgmt
Financing live
Cash to close
- Down payment
- $48,725
- Closing costs
- $5,847
- Reserves months
- —
- Total cash needed
- —
Loan-product check · same deal, 3 products live
Conventional
25% down · 7.5% · 30yr
- Down + closing
- —
- Monthly P&I
- —
- Monthly cashflow
- —
- DSCR
- —
- Eligible?
- —
Personal DTI + credit; lowest rate.
DSCR
20% down · 8.5% · 30yr
- Down + closing
- —
- Monthly P&I
- —
- Monthly cashflow
- —
- DSCR
- —
- Eligible?
- —
No personal income docs; deal must DSCR.
Hard money
10% down · 12.0% · 12mo
- Down + closing
- —
- Monthly P&I
- —
- Monthly cashflow
- —
- DSCR
- —
- Eligible?
- —
Short-term bridge; refi at stabilization.
Rent comps 9 comps
| Address | Beds | Baths | Sqft | Rent | $/sqft | DOM | Units | Dist |
|---|---|---|---|---|---|---|---|---|
| 507 Victoria Ave Unit 507 Lynchburg, VA | 4.0 | 2.0 | 1480 | $1,700 | $1.15 | 21d | 1 | 0.32mi |
| 520 Elmwood Ave Lynchburg, VA | 5.0 | 3.0 | 1800 | $2,250 | $1.25 | 43d | 1 | 0.61mi |
| 2202 Hollins Mill Rd Lynchburg, VA | 3.0 | 1.0 | 1800 | $1,400 | $0.78 | 21d | 1 | 0.70mi |
| 812 Taylor St Lynchburg, VA | 3.0 | 2.0 | 1872 | $1,950 | $1.04 | 13d | 1 | 1.17mi |
| 1014 Landon Ct Lynchburg, VA | 3.0 | 2.5 | 2168 | $2,495 | $1.15 | 13d | 1 | 1.19mi |
| 209 Munford St Lynchburg, VA | 3.0 | 2.5 | 1420 | $1,497 | $1.05 | 44d | 1 | 1.24mi |
| 800 Pierce St Lynchburg, VA | 4.0 | 1.0 | 1714 | $1,295 | $0.76 | 43d | 1 | 1.28mi |
| 1110 11th St Lynchburg, VA | 3.0 | 1.5 | 2000 | $1,450 | $0.72 | 13d | 1 | 1.32mi |
| 1316 Harrison St Lynchburg, VA | 3.0 | 1.5 | 1535 | $1,500 | $0.98 | 43d | 1 | 1.39mi |
Listing history 17 events
-
2026-05-17status Pending 814-char remark
Show marketing remark (814 chars)
Located in the heart of Lynchburg, this charming duplex at 1103 Rivermont Ave offers a fantastic investment opportunity. The main level features 2 bedrooms, 1 full bathroom, and a kitchen equipped with refrigerator, microwave, and stove. The upper unit offers 3 bedrooms, 1 full bathroom, and a kitchen with refrigerator, stove ideal for separate living spaces or rental income potential. This property is just minutes from several local universities, making it attractive for student or faculty housing. The home is approximately 7 miles from Liberty University, less than 4 miles from University of Lynchburg, and roughly 1 mile from Randolph College. Enjoy convenient access to downtown dining, shopping, and the scenic James River while owning a property full of historic character and strong rental potential.
-
2026-04-03$194,900 Active 814-char remark
Show marketing remark (814 chars)
Located in the heart of Lynchburg, this charming duplex at 1103 Rivermont Ave offers a fantastic investment opportunity. The main level features 2 bedrooms, 1 full bathroom, and a kitchen equipped with refrigerator, microwave, and stove. The upper unit offers 3 bedrooms, 1 full bathroom, and a kitchen with refrigerator, stove ideal for separate living spaces or rental income potential. This property is just minutes from several local universities, making it attractive for student or faculty housing. The home is approximately 7 miles from Liberty University, less than 4 miles from University of Lynchburg, and roughly 1 mile from Randolph College. Enjoy convenient access to downtown dining, shopping, and the scenic James River while owning a property full of historic character and strong rental potential.
-
2022-03-11soldstatus $152,000
-
2022-03-11soldstatus $152,000
-
2021-07-21$169,000
-
2021-02-09$169,000
-
2021-01-20$189,900
-
2020-06-27$164,900
-
2020-04-13soldstatus $100,000
-
2020-04-13soldstatus $100,000
-
2020-01-03$115,000
-
2020-01-03$115,000
-
2019-11-05$115,000
-
2019-10-22$115,000
-
2018-11-19$115,000
-
2018-11-19$115,000
-
1988-03-21soldstatus $493,930
ⓘ Source: listings_history table (triggers on properties + properties_extension) + one-shot
backfill from property_details.listing_events for pre-trigger history.
Tax reassessment forecast VA · Resets to sale price
- Current annual tax
- $1,483 · $124/mo
- Projected year-2 tax
- $1,598 · $133/mo
- Expected delta
- +$115/yr (+$10/mo · 7.7%)
ⓘ Screening estimate from a state-policy table — verify with the county assessor before closing.
Climate risk First Street
- Flood 1/10 Low FEMA zone X (unshaded) · 0% chance over 30 yrs
- Wildfire 1/10 Low
- Heat 6/10 Major 7 d/yr ≥102°F today · 19 d/yr by 30 yrs out
- Wind 2/10 Low 2% chance of damaging wind over 30 yrs
- Air quality 2/10 Low 0 unhealthy d/yr today · 1 by 30 yrs out
Nearby sold comps map
Loading sold comps map…
Walkable amenities ~0.75 mi
Loading nearby amenities…
Taxation est. · year 1
- Rental income
- $29,424
- − Mortgage interest
- −$10,917
- − Property taxes
- −$1,483
- − Insurance
- −$974
- − Repairs & maintenance
- −$2,354
- − Management
- −$2,354
- − Depreciation
- −$5,670
- Taxable income
- $5,671
- Est. tax owed @ 24.0%
- −$1,361
- After-tax cash flow
- $7,161/yr
For passive investors: Depreciation is non-cash, so a rental often shows a tax loss while cash-flowing — sheltering income. Rental losses are passive: they offset passive income freely, and up to $25,000/yr can offset ordinary (W-2) income if you actively participate and your MAGI is under $100k (phasing out to $0 by $150k); unused losses carry forward. On sale, claimed depreciation is recaptured at up to 25%, and gains may owe capital-gains tax (a 1031 exchange can defer both). Figures are a year-1 estimate at your 24.0% rate — not tax advice; consult a CPA.
Schools (NCES district)
- District
- Lynchburg City Public School District
- NCES district ID
- 5102340
- Math proficiency
- 36% ▼ -38.00%
- Reading proficiency
- 61% ▼ -8.00%
- Median HH income
- $39,097
- Composite
- 40.4/100
- National rank
- #3730
- State rank
- #104 of 131 in VA
Livability — Lynchburg
- Score
- 91/100
- State rank
- #1
- US rank
- #58
Category grades
Schools grade is shown separately in the Schools card above.
Census & demographics
- Census place
- Lynchburg, VA
- County
- Lynchburg City · 97,036 people
- City population
- 97,036
- Metro
- Lynchburg, VA
- Population (ZIP)
- 9,632
- Household income
- $52,571
- Rent vs Own
- Severe rent burden
- 552.0
Population outlook (Lynchburg County) Hauer SSP2
- Today (2025)
- 87,977 people
- By 2030
- 93,626 · +6.4%
- By 2040
- 106,145 · +20.7%
- By 2050
- 120,783 · +37.3%
- By 2075
- 162,249 · +84.4%
- By 2100
- 191,358 · +117.5%
Race, ethnicity, and origin ACS 2023
- Neighborhood character
- Diverse neighborhood (Simpson 0.57)
- Race & ethnicity
- White 51% Black 40% Two or more races 6% Hispanic / Latino 4%
- Common ancestry
- Italian 3% Lithuanian 1% Serbian 1%
- Foreign-born
- 4% · Canada, China
- Languages at home
- 95% English-only · Spanish 3% Chinese 1%
Political lean MEDSL · Lynchburg
- 2024 margin
- Lean R (+7.9) · D 45.4% · R 53.3% · Other 1.3%
- 2008→2024 swing
- -3.9pp toward R · 2008: -4.0pp · 2024: -7.9pp
- All cycles
- 2024: R+7.9 2020: D+2.6 2016: R+9.0 2012: R+10.6 2008: R+4.0
Not yet ingested
- Civics
- —
Market trends
- HPI YoY
- ▼ -33.39%
- Current HPI
- 229.4423
- Rent YoY
- ▲ 4.56%
- Metro
- Lynchburg, VA
- State GDP YoY
- ▲ 2.40%
- F500 in state
- 50
Industry mix (Fortune 500 HQ in VA)
| Industry | F500 HQs | Revenue |
|---|---|---|
| Aerospace / Defense | 4 | $236B |
|
||
| Technology / Defense | 3 | $32B |
|
||
| Financial Services | 2 | $176B |
|
||
| Utilities | 2 | $27B |
|
||
| Insurance | 2 | $25B |
|
||
| Technology | 2 | $15B |
|
||
Price history
-60.5% since first listed17 events — show timeline
- 2026-05-17 Pending — LMLS
- 2026-04-03 Listed $194,900 LMLS
- 2022-03-11 Sold (Public Records) $152,000 Public Records
- 2022-03-11 Sold (MLS) $152,000 LMLS
- 2021-07-21 Listed $169,000 LMLS
- 2021-02-09 Listed $169,000 LMLS
- 2021-01-20 Listed $189,900 LMLS
- 2020-06-27 Listed $164,900 LMLS
- 2020-04-13 Sold (Public Records) $100,000 Public Records
- 2020-04-13 Sold (MLS) $100,000 LMLS
- 2020-01-03 Listed $115,000 LMLS
- 2020-01-03 Listed $115,000 LMLS
- 2019-11-05 Listed $115,000 LMLS
- 2019-10-22 Listed $115,000 LMLS
- 2018-11-19 Listed $115,000 LMLS
- 2018-11-19 Listed $115,000 LMLS
- 1988-03-21 Sold (Public Records) $493,930 Public Records
Property tax history
+3.2%/yrLatest (2025): $1,483 · +7.8% YoY. Source: county tax records.
Cash-flow waterfall
monthlySold comps — $/sqft
last 12 mo · ≤1 miLoading sold comps…