 Multi-family
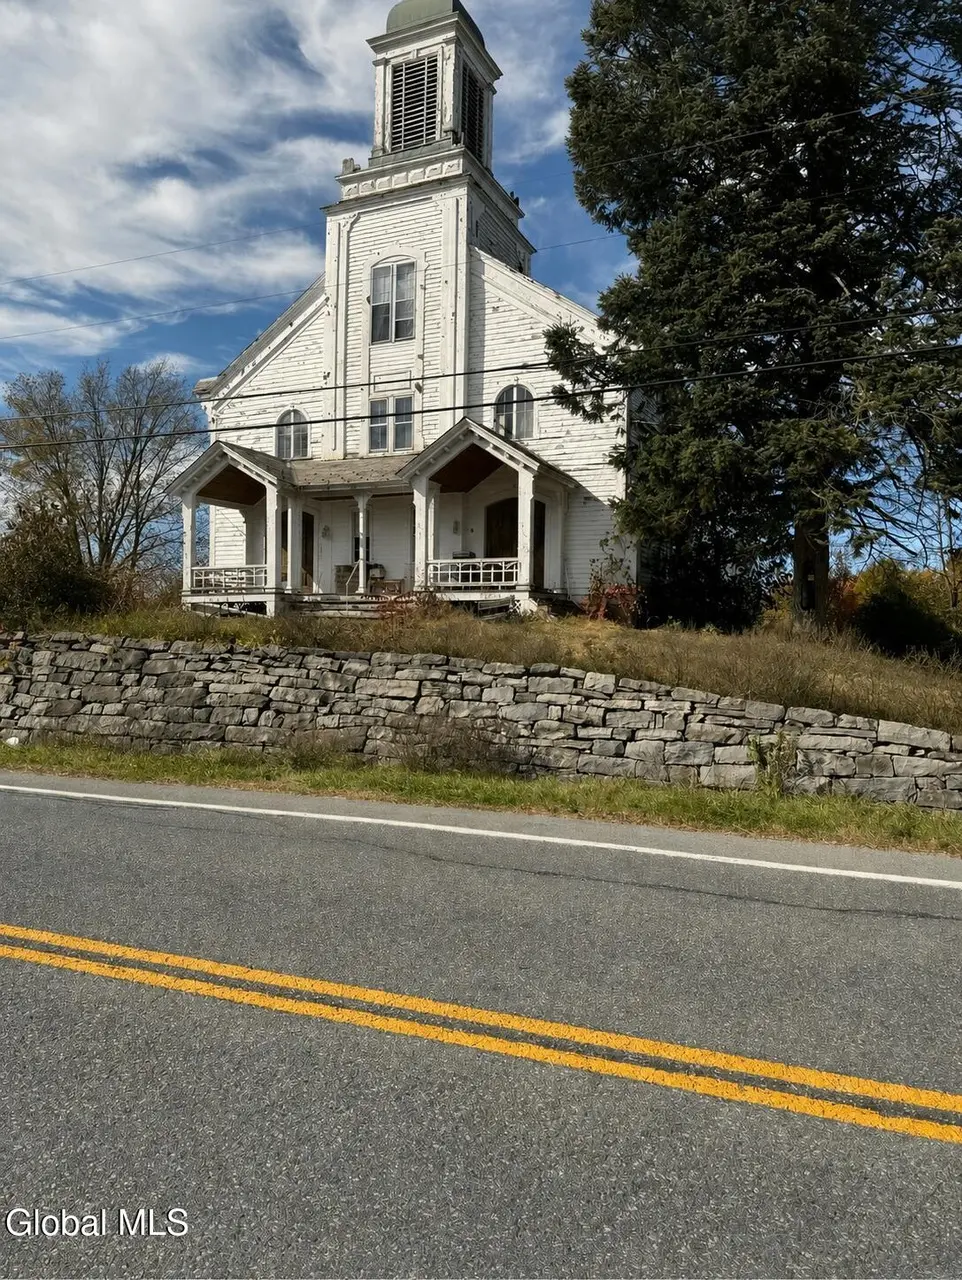
5369 New York 40 · Argyle, NY
Flood risk No data
- FEMA flood zone
- —
- Chance of flooding over 30 yrs
- —
- Est. flood insurance / yr
- —
Fire risk No data
- Est. fire insurance / yr
- —
Heat risk No data
- Hot days now (above threshold)
- —
- Hot days in 30 yrs
- —
Wind risk No data
- Chance of severe wind over 30 yrs
- —
Air-quality risk No data
- Unhealthy air days now
- —
- Unhealthy air days in 30 yrs
- —
Risk factors via First Street. Map © Google.
Why this score? — see what drove the D+ grade
The composite is a weighted blend of 9 inputs, each scored 0–100. Each bar is that input's sub-score; the figure is the points it added to the 100-point composite (weight × sub-score).
- Appreciation +10.0/10.0
- Cash flow +9.8/30.0
- ARV discount +7.5/15.0
- Schools +4.6/10.0
- Livability +3.0/5.0
- DSCR +2.8/10.0
- 1% rule +2.6/10.0
- Rent growth +2.5/5.0
- Condition / age +2.5/5.0
$199,900
🖨 Deal sheet (PDF) 📄 Offer letter ✓ Due diligence
Multi-family units
County records classify this as Multi-Family (2-4 Unit). Listing-text estimate: 1 unit. estimate disagrees with records
Listing remarks
A rare opportunity to own a truly one-of-a-kind property bursting with character, history, and potential. This former church sits overlooking picturesque countryside and offers a blank canvas for visionaries, entrepreneurs, investors, or anyone looking for an extraordinary place to call home, establish a business, or create a unique work space! While the property requires restoration and TLC, it is currently livable and usable as-is, allowing you to renovate and restore at your own pace. Many of its original features remain intact, including beautiful woodworking details, soaring ceilings, and hardwood floors just waiting to be brought back to life. The stunning foyer welcomes you into a
Key facts
- Original features
- Soaring ceilings
- Stunning foyer
Tags
Property features AI
Exterior
- Parking: Detached garage (3 garage spaces); Driveway and circular driveway; Off-street parking (total spaces for approximately 15 vehicles); Stone driveway; Workshop in garage
- Utilities: Septic tank
- Home design: Single family residence; Fixer condition
- Construction: Wood siding; Stone foundation
- Exterior features: Covered front porch; Slate roof; Additional garage structures; 1 acre lot
Interior
- Kitchen: Electric oven; Refrigerator
- Bedrooms: Multiple bedrooms on first, second and third levels (bedrooms located on first, second and third floors)
- Flooring: Wood flooring; Carpet; Linoleum
- Bathrooms: One full bathroom (located on the second level); One half bathroom (located on the first level)
- Heating & cooling: Pellet stove heating
- Interior features: Cathedral ceilings; Full unfinished basement with interior entry
Neighborhood map
What this means for you Summary
Snapshot
- This is a 6-bed/2.0-bath multifamily listed at $200k.
Deal economics
- At list price, monthly cash flow is $-128 ($-2k/yr) — negative.
- To cash-flow at today's rent, offer at most $177k (11.4% below list).
- To meet the 1% rule (rent ≥ 1% of price), the offer needs to be $152k (24.1% below list).
- Recommended offer: $152k (24.1% below list) — sets the bar for 1% rule.
Location & tenants
- Location reads 59/100 on livability (#1,010 in NY) — a working-class tenant base; expect higher turnover. Strengths: cost of living A+, housing A+; Watch: employment D, health & safety D, crime F.
- Argyle Central School District (rural): math 54% / reading 48% proficiency, ranked #426 of 755 in NY (top 56%) — acceptable for families but not a draw, mixed tenant base, ~2y average lease.
- Zoned schools: Argyle Elementary School (math 37% / reading 52%, grade F, #1,277 of 2,108 statewide, top 64%, 264 students, 47% FRL); Argyle Junior/Senior High School (math 47% / reading 62%, grade C-, #912 of 1,100 statewide, top 85%, 229 students, 48% FRL) — zoned schools average 47% FRL vs 26% district-wide (21 pts higher); higher-poverty schools than district average — tighter screening recommended.
- Market conditions: 25 active listings in the ZIP; 106 units permitted in Washington County in 2024 (0 in 5+ unit buildings).
Forward outlook
- In year one you build about $21k of equity ($1k loan paydown + $20k appreciation (10.0% local appreciation)).
- Washington County population projected at -20% by 2050 — secular population decline; favor cash flow + early exit over multi-decade hold.
- By year 2, paydown + projected appreciation supports a ~$34k cash-out refi (75% LTV) — recoverable capital for the next deal without selling this one.
Negotiation context
- Only 9 days on market — expect competitive offers; lowballing is unlikely to land.
- 3 sale attempts since 7y ago with the ask held roughly flat each time — persistent listings suggest the price (not the market) is what's stuck; bring a comps-based counter.
- Current owner paid $148k; 36% above their basis — modest negotiation headroom, anchor on the comps not their cost.
Risks & watch-outs
- Watch-outs: built in 1900 — expect roof / HVAC / electrical / plumbing capex.
Questions for the listing agent
- What do current leases actually rent for vs. the listed asking? Can we see a recent rent roll and the last 12 months of T-12 income?
- Built in 1900 — when were the roof, HVAC, electrical panel, plumbing, and water heater last replaced?
- Is there a deadline driving the sale (1031 exchange, divorce, estate, relocation)? That informs how much negotiation room exists.
- Crime grade is F in this area — have there been break-ins, vandalism, or insurance claims at this property in the last 3 years? What carrier currently insures it and at what premium?
- The area grade is low — what's the realistic commute time and amenity access for the typical tenant pool here? Any planned neighborhood developments (good or bad) we should know about?
- What's the average days-on-market for RENTAL listings here right now (not sales)? A rising rental-DOM trend means longer vacancies and softer asking-rent achievability than the comps imply.
- What's the recent tenant-quality profile in this submarket — average credit score on applications, eviction rate, late-payment / NSF rate, and stable-employment percentage? A property-management company in the area should have these aggregated.
- How much new apartment / multifamily construction is in the pipeline within 1–3 miles? Heavy new supply (>2% of stock underway) typically softens rents 12–24 months out; light construction supports rent growth.
Investment metrics
- 1% rule
- 0.76% ✗
- Cap rate
- 5.52%
- Cash-on-cash
- -2.75%
- DSCR
- 0.88
- GRM
- 11.0
CMA / ARV
No comps found within radius.
Projected returns pro-forma
10.0% appreciation · 3.0% rent growth · sell at horizon
- IRR
- 22.3%
- Equity multiple
- 2.80×
- Total profit
- $100,680
- Equity at exit
- $180,086
- IRR
- 20.0%
- Equity multiple
- 6.41×
- Total profit
- $302,899
- Equity at exit
- $388,362
Cash invested: $55,972 (down + closing). Projections, not guarantees.
Landlord ↔ Tenant lean methodology
- Overall (STATE)
- 15 Strongly Tenant-Friendly
- State New York
- 15 Strongly Tenant-Friendly · D+10
- County
- — inherits STATE
- City
- — inherits STATE
ZIP-level market 12809
- Home prices YoY
- 20.2%
- Active inventory
- 25
- Price-to-rent
- 11.0×
Monthly cashflow live
- Estimated rent
- $1,518 medium interval (Pro) →
- Mortgage (P&I)
- −$1,048
- Tax from tax record
- −$196 /mo · $2,354/yr
- Insurance
- −$83
- HOA
- −$0
- Vacancy / Maint / Mgmt
- −$319
- Net cashflow
- $-128
Break-even live
Sensitivity live
| Price | -10% $-15 | -5% $-72 | +0% $-128 | +5% $-185 | +10% $-242 |
|---|---|---|---|---|---|
| Rent | -10% $-248 | -5% $-188 | +0% $-128 | +5% $-68 | +10% $-9 |
| Rate | -1.0pp $-28 | -0.5pp $-78 | base $-128 | +0.5pp $-180 | +1.0pp $-233 |
UW: 25.0% down · 7.5% · 30yr · 1.5% tax · 5.0% vac · 8.0% maint · 8.0% mgmt
Financing live
Cash to close
- Down payment
- $49,975
- Closing costs
- $5,997
- Reserves months
- —
- Total cash needed
- —
Loan-product check · same deal, 3 products live
Conventional
25% down · 7.5% · 30yr
- Down + closing
- —
- Monthly P&I
- —
- Monthly cashflow
- —
- DSCR
- —
- Eligible?
- —
Personal DTI + credit; lowest rate.
DSCR
20% down · 8.5% · 30yr
- Down + closing
- —
- Monthly P&I
- —
- Monthly cashflow
- —
- DSCR
- —
- Eligible?
- —
No personal income docs; deal must DSCR.
Hard money
10% down · 12.0% · 12mo
- Down + closing
- —
- Monthly P&I
- —
- Monthly cashflow
- —
- DSCR
- —
- Eligible?
- —
Short-term bridge; refi at stabilization.
Listing history 7 events
-
2026-06-22days on market $199,900 Active 9 DOM
-
2026-06-18days on market $199,900 Active 6 DOM
-
2026-06-17days on market $199,900 Active 5 DOM
-
2026-06-16days on market $199,900 Active 4 DOM
-
2026-06-15days on market $199,900 Active 3 DOM
-
2026-06-14remarks 699-char remark
-
2026-06-14$199,900 Active 1 DOM
ⓘ Source: listings_history table (triggers on properties + properties_extension) + one-shot
backfill from property_details.listing_events for pre-trigger history.
Tax reassessment forecast NY · Partial reset (capped growth)
- Current annual tax
- $2,354 · $196/mo
- Projected year-2 tax
- $2,866 · $239/mo
- Expected delta
- +$512/yr (+$43/mo · 21.8%)
ⓘ Screening estimate from a state-policy table — verify with the county assessor before closing.
Nearby sold comps map
Loading sold comps map…
Walkable amenities ~0.75 mi
Loading nearby amenities…
Taxation est. · year 1
- Rental income
- $18,217
- − Mortgage interest
- −$11,198
- − Property taxes
- −$2,354
- − Insurance
- −$1,000
- − Repairs & maintenance
- −$1,457
- − Management
- −$1,457
- − Depreciation
- −$5,815
- Taxable loss
- −$5,064
- Est. tax savings @ 24.0%
- +$1,215
- After-tax cash flow
- $-326/yr
For passive investors: Depreciation is non-cash, so a rental often shows a tax loss while cash-flowing — sheltering income. Rental losses are passive: they offset passive income freely, and up to $25,000/yr can offset ordinary (W-2) income if you actively participate and your MAGI is under $100k (phasing out to $0 by $150k); unused losses carry forward. On sale, claimed depreciation is recaptured at up to 25%, and gains may owe capital-gains tax (a 1031 exchange can defer both). Figures are a year-1 estimate at your 24.0% rate — not tax advice; consult a CPA.
Schools (NCES district)
- District
- Argyle Central School District
- NCES district ID
- 3603210
- Math proficiency
- 54% ▲ 1.00%
- Reading proficiency
- 48% ▼ -8.00%
- Median HH income
- $55,893
- Composite
- 46.17/100
- National rank
- #5453
- State rank
- #426 of 755 in NY
Livability — Argyle
- Score
- 59/100
- State rank
- #1010
- US rank
- #19685
Category grades
Schools grade is shown separately in the Schools card above.
Census & demographics
- Population (ZIP)
- 3,639
Population outlook (Washington County) Hauer SSP2
- Today (2025)
- 59,576 people
- By 2030
- 57,618 · -3.3%
- By 2040
- 52,751 · -11.5%
- By 2050
- 47,514 · -20.2%
- By 2075
- 35,690 · -40.1%
- By 2100
- 24,807 · -58.4%
Race, ethnicity, and origin ACS 2023
- Neighborhood character
- Predominantly White (95%)
- Race & ethnicity
- White 95% Two or more races 3% Hispanic / Latino 2%
- Common ancestry
- Lithuanian 8% Serbian 4% Romanian 4%
- Foreign-born
- 2% · Canada
- Languages at home
- 99% English-only · Spanish 1%
Political lean MEDSL · Washington
- 2024 margin
- Strong R (+21.2) · D 39.4% · R 60.6%
- 2008→2024 swing
- -22.0pp toward R · 2008: 0.8pp · 2024: -21.2pp
- All cycles
- 2024: R+21.2 2020: R+15.6 2016: R+20.2 2012: D+1.6 2008: D+0.8
Not yet ingested
- Civics
- —
Market trends
- HPI YoY
- ▲ 63.17%
- Current HPI
- 376.0979
- Rent YoY
- —
- Metro
- —
- State GDP YoY
- ▲ 2.60%
- F500 in state
- 92
Industry mix (Fortune 500 HQ in NY)
| Industry | F500 HQs | Revenue |
|---|---|---|
| Financial Services | 10 | $950B |
|
||
| Consumer Goods | 9 | $162B |
|
||
| Insurance | 4 | $225B |
|
||
| Telecommunications | 2 | $144B |
|
||
| Pharmaceuticals | 2 | $112B |
|
||
| Media / Entertainment | 2 | $69B |
|
||
Price history
+399.8% since first listed12 events — show timeline
- 2026-06-12 Listed $199,900 Global MLS
- 2020-02-10 Listing Removed — Global MLS
- 2019-12-28 Price Changed $49,900 Global MLS
- 2019-12-03 Price Changed $54,900 Global MLS
- 2019-11-20 Price Changed $59,900 Global MLS
- 2019-11-19 Relisted — Global MLS
- 2019-10-01 Listing Removed — Global MLS
- 2019-10-01 Listing Removed — Global MLS
- 2019-08-06 Listed $69,500 Global MLS
- 2004-04-15 Sold (Public Records) $147,500 Public Records
- 1999-01-08 Sold (Public Records) $80,000 Public Records
- 1997-01-02 Sold (Public Records) $40,000 Public Records
Property tax history
-5.3%/yrLatest (2025): $2,354 · +22.2% YoY. Source: county tax records.
Cash-flow waterfall
monthlySold comps — $/sqft
last 12 mo · ≤1 miLoading sold comps…