 5-Plex
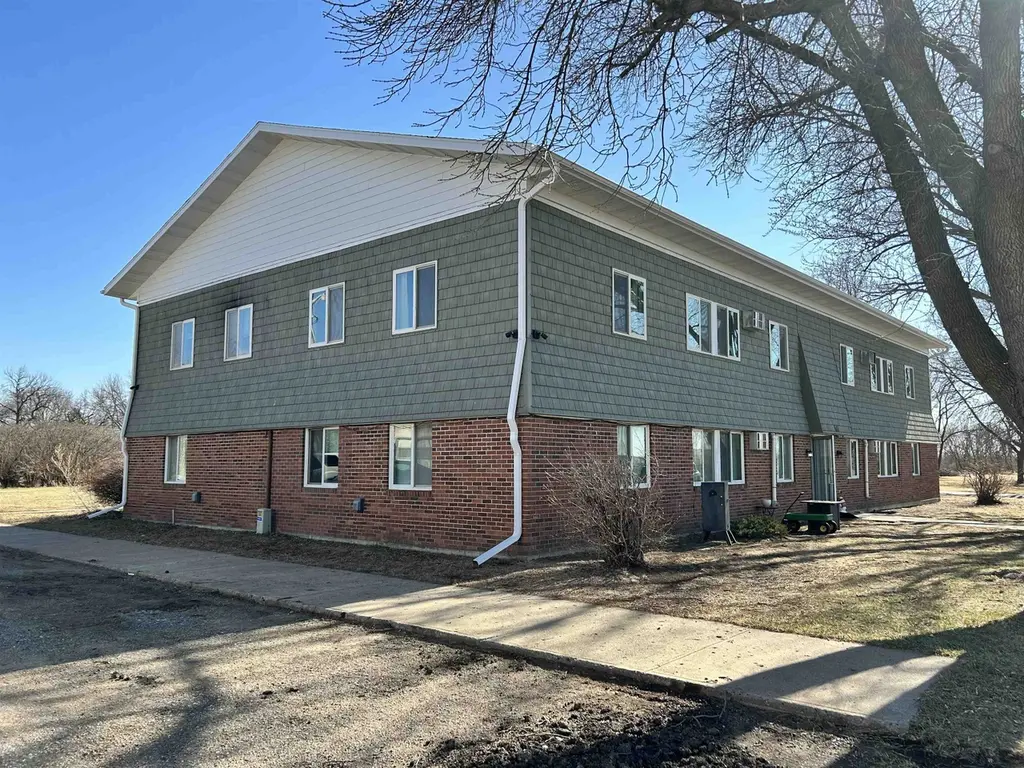
611 1st St · Wakonda, SD
Flood risk 1/10 · Minimal
- FEMA flood zone
- X
- Chance of flooding over 30 yrs
- 0.0%
- Est. flood insurance / yr
- $508 – $851
Fire risk 2/10 · Minimal
- Est. fire insurance / yr
- $1,342 – $2,492
Heat risk 2/10 · Minimal
- Hot days now (above threshold)
- 7 days/yr
- Hot days in 30 yrs
- 14 days/yr
Wind risk No data
- Chance of severe wind over 30 yrs
- —
Air-quality risk 2/10 · Minimal
- Unhealthy air days now
- 1 days/yr
- Unhealthy air days in 30 yrs
- 1 days/yr
Risk factors via First Street. Map © Google.
Why this score? — see what drove the B+ grade
The composite is a weighted blend of 9 inputs, each scored 0–100. Each bar is that input's sub-score; the figure is the points it added to the 100-point composite (weight × sub-score).
- Cash flow +30.0/30.0
- DSCR +10.0/10.0
- Appreciation +10.0/10.0
- 1% rule +8.0/10.0
- ARV discount +7.5/15.0
- Schools +4.1/10.0
- Livability +3.1/5.0
- Rent growth +2.5/5.0
- Condition / age +2.5/5.0
$465,000
🖨 Deal sheet 📄 Offer letter ✓ Due diligence
Multi-family units
County records classify this as Multi-Family (5+ Unit). Listing-text estimate: 5 units. confirmed
5+ unit building — per-unit beds/baths from public records are typically unavailable; the breakdown below (if shown) is an estimate from the listing text.
Listing remarks MLS
Well kept, clean bldg, Newer roof and windows. Several of the units were recently remodeled. Includes large adjoining lot for possible expansion or other new build. Excellent cash flow. Only units in town like this. Must see 7 UNITS ARE 2 BDRM, 1 BA RENTED FOR $550 EACH 1 UNIT IS 1 BDRM, 1 BA RENTED FOR $500
Key facts
- New pitched roof
- Multifamily building
- Off-street parking
Tags
Property features AI
Exterior
- Utilities: Public water; Public sewer
- Home design: Residential income property; Multifamily (multi family); Two-story building
- Construction: Brick construction
- Exterior features: Asphalt shingle roof
Interior
- Bedrooms: One 1-bedroom unit (unfurnished); Fourteen 2-bedroom units (unfurnished)
- Bathrooms: One bathroom in the 1-bedroom unit; Seven bathrooms among the 2-bedroom units
- Heating & cooling: Window unit(s) for cooling; Electric heating; Baseboard heating
- Interior features: Window unit cooling; Electric and baseboard heating
Neighborhood map
What this means for you Summary
Snapshot
- This is a 5 × 3-bed/?-bath units multifamily listed at $465k.
Deal economics
- At list price, monthly cash flow is $2k ($22k/yr) — positive. Per door: $371/mo.
- The deal already cash-flows at list — no discount required.
- Meets the 1% rule at list price ($6k rent vs $465k).
- Recommended offer: $458k (1.5% below list) — sets the bar for market timing.
Location & tenants
- Location reads 61/100 on livability (#228 in SD) — a middle-class / working-renter tenant base. Strengths: cost of living A+, housing A+; Watch: employment C-, schools D, crime F.
- Irene-Wakonda School District 13-3 (rural): math 40% / reading 50% proficiency, ranked #100 of 148 in SD (top 68%) — families likely to look elsewhere, expect single-tenant / working-renter base with shorter leases.
- Market conditions: 5 active listings in the ZIP; 28 units permitted in Clay County in 2024 (10 in 5+ unit buildings).
Forward outlook
- In year one you build about $50k of equity ($3k loan paydown + $46k appreciation (10.0% local appreciation)).
- Clay County population projected at +12% by 2050 — modest demand growth; plan on rents tracking national, not racing it.
- At projected returns (10.0% appreciation + 3.0% rent growth), your $130k cash investment doubles in ~2 years — after that, you're playing with house money.
- By year 2, paydown + projected appreciation supports a ~$80k cash-out refi (75% LTV) — recoverable capital for the next deal without selling this one.
Negotiation context
- It's been on market 18 days — a 2% lower offer ($458k) is reasonable based on typical stale-listing flexibility.
- 4 sale attempts since 5y ago with the ask held roughly flat each time — persistent listings suggest the price (not the market) is what's stuck; bring a comps-based counter.
- Current owner paid $290k; list at $465k implies a 60% gain — meaningful room to come down on a strong offer.
Questions for the listing agent
- Can we see the unit-by-unit rent roll, current vacancy, and any below-market leases? What's the average tenancy length?
- What capital expenditures (roof, boiler, parking lot, exteriors) have been made in the last 5 years, and what's planned in the next 2?
- Built in 1975 — when were the roof, HVAC, electrical panel, plumbing, and water heater last replaced?
- Is there a deadline driving the sale (1031 exchange, divorce, estate, relocation)? That informs how much negotiation room exists.
- Schools are D-rated, which usually means shorter tenancies and higher turnover. Who's the typical renter profile here, and what's been the actual vacancy rate?
- Crime grade is F in this area — have there been break-ins, vandalism, or insurance claims at this property in the last 3 years? What carrier currently insures it and at what premium?
- What's the average days-on-market for RENTAL listings here right now (not sales)? A rising rental-DOM trend means longer vacancies and softer asking-rent achievability than the comps imply.
- What's the recent tenant-quality profile in this submarket — average credit score on applications, eviction rate, late-payment / NSF rate, and stable-employment percentage? A property-management company in the area should have these aggregated.
- How much new apartment / multifamily construction is in the pipeline within 1–3 miles? Heavy new supply (>2% of stock underway) typically softens rents 12–24 months out; light construction supports rent growth.
Investment metrics
- 1% rule
- 1.30% ✓
- Cap rate
- 11.08%
- Cash-on-cash
- 17.11%
- DSCR
- 1.76
- GRM
- 6.4
CMA / ARV
No comps found within radius.
Projected returns pro-forma
10.0% appreciation · 3.0% rent growth · sell at horizon
- IRR
- 37.0%
- Equity multiple
- 3.85×
- Total profit
- $371,389
- Equity at exit
- $418,909
- IRR
- 31.8%
- Equity multiple
- 8.68×
- Total profit
- $1,000,550
- Equity at exit
- $903,393
Cash invested: $130,200 (down + closing). Projections, not guarantees.
Landlord ↔ Tenant lean methodology
- Overall (STATE)
- 83 Strongly Landlord-Friendly
- State South Dakota
- 83 Strongly Landlord-Friendly · R+16
- County
- — inherits STATE
- City
- — inherits STATE
ZIP-level market 57073
- Home prices YoY
- 6.2%
- Active inventory
- 5
- Price-to-rent
- 32.0×
Monthly cashflow live
- Estimated rent
- $6,060 medium interval (Pro) →
- Mortgage (P&I)
- −$2,439
- Tax from tax record
- −$299 /mo · $3,588/yr
- Insurance
- −$194
- HOA
- −$0
- Vacancy / Maint / Mgmt
- −$1,273
- Net cashflow
- $1,856
Break-even live
5-unit breakdown (identical units grouped — click to expand)
| Units | Beds | Baths | Est. rent |
|---|---|---|---|
| 5× units | 3 | — | $6,060 |
| #1 | 3 | — | $1,212 |
| #2 | 3 | — | $1,212 |
| #3 | 3 | — | $1,212 |
| #4 | 3 | — | $1,212 |
| #5 | 3 | — | $1,212 |
| Total (5 units) | $6,060 | ||
UW: 25.0% down · 7.5% · 30yr · 1.5% tax · 5.0% vac · 8.0% maint · 8.0% mgmt
Financing live
Cash to close
- Down payment
- $116,250
- Closing costs
- $13,950
- Reserves months
- —
- Total cash needed
- —
Loan-product check · same deal, 3 products live
Conventional
25% down · 7.5% · 30yr
- Down + closing
- —
- Monthly P&I
- —
- Monthly cashflow
- —
- DSCR
- —
- Eligible?
- —
Personal DTI + credit; lowest rate.
DSCR
20% down · 8.5% · 30yr
- Down + closing
- —
- Monthly P&I
- —
- Monthly cashflow
- —
- DSCR
- —
- Eligible?
- —
No personal income docs; deal must DSCR.
Hard money
10% down · 12.0% · 12mo
- Down + closing
- —
- Monthly P&I
- —
- Monthly cashflow
- —
- DSCR
- —
- Eligible?
- —
Short-term bridge; refi at stabilization.
Listing history 13 events
-
2026-06-19days on market $465,000 Active 18 DOM
-
2026-06-18days on market $465,000 Active 17 DOM
-
2026-06-17days on market $465,000 Active 16 DOM
-
2026-06-16days on market $465,000 Active 15 DOM
-
2026-06-15days on market $465,000 Active 14 DOM
-
2026-06-14days on market $465,000 Active 12 DOM
-
2026-06-12days on market $465,000 Active 11 DOM
-
2026-06-09days on market $465,000 Active 8 DOM
-
2026-06-08days on market $465,000 Active 7 DOM
-
2026-06-07days on market $465,000 Active 6 DOM
-
2026-06-05days on market $465,000 Active 4 DOM
-
2026-06-04days on market $465,000 Active 2 DOM
-
2026-06-02$465,000 Active 1 DOM
ⓘ Source: listings_history table (triggers on properties + properties_extension) + one-shot
backfill from property_details.listing_events for pre-trigger history.
Tax reassessment forecast SD · Resets to sale price
- Current annual tax
- $3,588 · $299/mo
- Projected year-2 tax
- $6,092 · $508/mo
- Expected delta
- +$2,504/yr (+$209/mo · 69.8%)
ⓘ Screening estimate from a state-policy table — verify with the county assessor before closing.
Climate risk First Street
- Flood 1/10 Low FEMA zone X · 0% chance over 30 yrs
- Wildfire 2/10 Low
- Heat 2/10 Low
- Air quality 2/10 Low 1 unhealthy d/yr today · 1 by 30 yrs out
Nearby sold comps map
Loading sold comps map…
Walkable amenities ~0.75 mi
Loading nearby amenities…
Taxation est. · year 1
- Rental income
- $72,720
- − Mortgage interest
- −$26,047
- − Property taxes
- −$3,588
- − Insurance
- −$2,325
- − Repairs & maintenance
- −$5,818
- − Management
- −$5,818
- − Depreciation
- −$13,527
- Taxable income
- $15,598
- Est. tax owed @ 24.0%
- −$3,743
- After-tax cash flow
- $18,531/yr
For passive investors: Depreciation is non-cash, so a rental often shows a tax loss while cash-flowing — sheltering income. Rental losses are passive: they offset passive income freely, and up to $25,000/yr can offset ordinary (W-2) income if you actively participate and your MAGI is under $100k (phasing out to $0 by $150k); unused losses carry forward. On sale, claimed depreciation is recaptured at up to 25%, and gains may owe capital-gains tax (a 1031 exchange can defer both). Figures are a year-1 estimate at your 24.0% rate — not tax advice; consult a CPA.
Schools (NCES district)
- District
- Irene-Wakonda School District 13-3
- NCES district ID
- 4680439
- Math proficiency
- 40% ▼ -15.00%
- Reading proficiency
- 50% ▼ -10.00%
- Median HH income
- $48,762
- Composite
- 40.72/100
- National rank
- #7599
- State rank
- #100 of 148 in SD
Livability — Wakonda
- Score
- 61/100
- State rank
- #228
- US rank
- #17332
Category grades
Schools grade is shown separately in the Schools card above.
Census & demographics
- Census place
- Wakonda, SD
- Population (ZIP)
- 516
Population outlook (Clay County) Hauer SSP2
- Today (2025)
- 15,009 people
- By 2030
- 15,554 · +3.6%
- By 2040
- 15,862 · +5.7%
- By 2050
- 16,801 · +11.9%
- By 2075
- 20,880 · +39.1%
- By 2100
- 27,360 · +82.3%
Race, ethnicity, and origin ACS 2023
- Neighborhood character
- Predominantly White (94%)
- Race & ethnicity
- White 94% Two or more races 5%
- Common ancestry
- Portuguese 9% Lithuanian 3% Serbian 3%
- Foreign-born
- 1%
- Languages at home
- 99% English-only · German/W. Germanic 1%
Political lean MEDSL · Clay
- 2024 margin
- Lean D (+6.5) · D 52.0% · R 45.5% · Other 2.5%
- 2008→2024 swing
- -17.7pp toward R · 2008: 24.2pp · 2024: 6.5pp
- All cycles
- 2024: D+6.5 2020: D+11.0 2016: D+9.8 2012: D+15.5 2008: D+24.2
Not yet ingested
- Civics
- —
Market trends
- HPI YoY
- ▲ 14.03%
- Current HPI
- 240.3788
- Rent YoY
- —
- Metro
- —
- State GDP YoY
- ▲ 0.70%
- F500 in state
- 2
Industry mix (Fortune 500 HQ in SD)
| Industry | F500 HQs | Revenue |
|---|---|---|
| Utilities | 1 | $1B |
|
||
Price history
+45.3% since first listed6 events — show timeline
- 2026-06-01 Listed $465,000 MARMLS
- 2025-02-23 Relisted — MARMLS
- 2025-01-08 Listed $399,900 MARMLS
- 2022-01-12 Sold (Public Records) $140,000 Public Records
- 2022-01-12 Sold (MLS) $290,000 NWIA
- 2021-09-29 Listed $320,000 NWIA
Property tax history
-4.6%/yrLatest (2025): $3,588 · -0.7% YoY. Source: county tax records.
Cash-flow waterfall
monthlySold comps — $/sqft
last 12 mo · ≤1 miLoading sold comps…