337 Cottonwood Br · Richland, MO
Flood risk 1/10 · Minimal
- FEMA flood zone
- X (unshaded)
- Chance of flooding over 30 yrs
- 0.0%
- Est. flood insurance / yr
- $507 – $1,088
Fire risk 4/10 · Minor
- Est. fire insurance / yr
- $1,054 – $1,958
Heat risk 4/10 · Minor
- Hot days now (above 106°F)
- 7 days/yr
- Hot days in 30 yrs
- 19 days/yr
Wind risk 2/10 · Minimal
- Chance of severe wind over 30 yrs
- 0.0%
Air-quality risk 1/10 · Minimal
- Unhealthy air days now
- 0 days/yr
- Unhealthy air days in 30 yrs
- 0 days/yr
Risk factors via First Street. Map © Google.
Why this score? — see what drove the A- grade
The composite is a weighted blend of 9 inputs, each scored 0–100. Each bar is that input's sub-score; the figure is the points it added to the 100-point composite (weight × sub-score).
- Cash flow +29.2/30.0
- ARV discount +15.0/15.0
- DSCR +10.0/10.0
- Appreciation +8.3/10.0
- 1% rule +7.0/10.0
- Schools +3.3/10.0
- Livability +3.0/5.0
- Rent growth +2.5/5.0
- Condition / age +2.5/5.0
$79,900
🖨 Deal sheet 📄 Offer letter ✓ Due diligence
Listing remarks
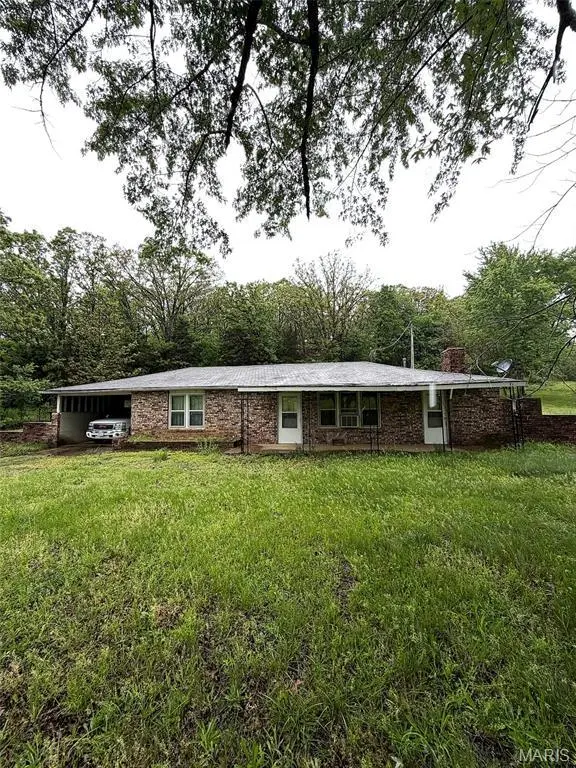
Tucked away on nearly half an acre, 337 Cottonwood Branch Rd offers a peaceful setting with room to make it your own. This 2 bed, 1 bath home features over 1,300 sq ft of living space along with an attached carport for convenient covered parking. The property is serviced by a private well and septic, with propane providing fuel for the stove and heating. Home is being sold as-is and will require cash or conventional financing. Whether you’re looking for an affordable primary residence, rental opportunity, or a project with potential, this property is worth a look. Located in the Richland School District with easy access to town amenities.
Key facts
- Attached carport
- Private well
- Septic
Tags
Property features AI
Finance
- Other: No additional financial amenities provided
- Financial info: No investor or income/expense details provided
- HOA & community: No HOA details provided
Exterior
- Parking: Carport with 1 space
- Security: No security details provided
- Utilities: Well water; Septic tank; Electricity (single phase); Electricity connected; Propane connected; Water connected; Sewer connected
- Home design: Single-family residence; One story
- Construction: Brick construction
- Exterior features: Some trees on the lot
Interior
- Kitchen: No specific kitchen appliance details provided
- Bedrooms: Two bedrooms on the main level
- Flooring: No flooring details provided
- Bathrooms: One full bathroom on the main level
- Heating & cooling: Propane heating; Attic fan; Window AC units
- Interior features: Living room fireplace
- Laundry & utility: No laundry appliance details provided
Neighborhood map
What this means for you Summary
Snapshot
- This is a 2-bed/1.0-bath other listed at $80k.
Deal economics
- At list price, monthly cash flow is $277 ($3k/yr) — positive.
- The deal already cash-flows at list — no discount required.
- Meets the 1% rule at list price ($961 rent vs $80k).
Location & tenants
- Location reads 59/100 on livability (#569 in MO) — a working-class tenant base; expect higher turnover. Strengths: cost of living A+, housing A+; Watch: crime D+, amenities F, commute F.
- Richland R-IV (rural): math 30% / reading 48% proficiency, ranked #171 of 324 in MO (top 53%) — families likely to look elsewhere, expect single-tenant / working-renter base with shorter leases.
- Zoned schools: Richland Elem. (math 32% / reading 52%, grade F, #481 of 1,115 statewide, top 46%, 257 students, 100% FRL); Richland High (math 27% / reading 47%, grade F, #291 of 521 statewide, top 60%, 204 students, 50% FRL) — zoned schools average 75% FRL vs 53% district-wide (22 pts higher); higher-poverty schools than district average — tighter screening recommended.
- Market conditions: 54 active listings in the ZIP; 272 units permitted in Camden County in 2024 (0 in 5+ unit buildings).
Forward outlook
- In year one you build about $6k of equity ($552 loan paydown + $5k appreciation (6.6% local appreciation)).
- Camden County population projected to shrink 6% by 2050 — rents likely to lag national; underwrite the cash flow, not the appreciation.
- At projected returns (6.6% appreciation + 3.0% rent growth), your $22k cash investment doubles in ~3 years — after that, you're playing with house money.
- By year 6, paydown + projected appreciation supports a ~$32k cash-out refi (75% LTV) — recoverable capital for the next deal without selling this one.
Negotiation context
- Only 7 days on market — expect competitive offers; lowballing is unlikely to land.
Questions for the listing agent
- Built in 1979 — when were the roof, HVAC, electrical panel, plumbing, and water heater last replaced?
- Is there a deadline driving the sale (1031 exchange, divorce, estate, relocation)? That informs how much negotiation room exists.
- Schools are F-rated, which usually means shorter tenancies and higher turnover. Who's the typical renter profile here, and what's been the actual vacancy rate?
- Crime grade is D in this area — have there been break-ins, vandalism, or insurance claims at this property in the last 3 years? What carrier currently insures it and at what premium?
- What's the average days-on-market for RENTAL listings here right now (not sales)? A rising rental-DOM trend means longer vacancies and softer asking-rent achievability than the comps imply.
- What's the recent tenant-quality profile in this submarket — average credit score on applications, eviction rate, late-payment / NSF rate, and stable-employment percentage? A property-management company in the area should have these aggregated.
- How much new for-sale + rental construction is in the pipeline within 1–3 miles? Heavy new supply typically softens prices + rents 12–24 months out; constrained supply supports both.
Investment metrics
- 1% rule
- 1.20% ✓
- Cap rate
- 10.46%
- Cash-on-cash
- 14.87%
- DSCR
- 1.66
- GRM
- 6.9
CMA / ARV
- ARV (median comp)
- $140,099
- List price
- $79,900
- Delta
- -42.97%
- Verdict
- UNDERPRICED
- Comps
- 2 within 1.0 mi
Projected returns pro-forma
6.6% appreciation · 3.0% rent growth · sell at horizon
- IRR
- 28.9%
- Equity multiple
- 2.95×
- Total profit
- $43,583
- Equity at exit
- $53,294
- IRR
- 26.6%
- Equity multiple
- 6.08×
- Total profit
- $113,656
- Equity at exit
- $99,408
Cash invested: $22,372 (down + closing). Projections, not guarantees.
Landlord ↔ Tenant lean methodology
- Overall (STATE)
- 81 Strongly Landlord-Friendly
- State Missouri
- 81 Strongly Landlord-Friendly · R+10
- County
- — inherits STATE
- City
- — inherits STATE
ZIP-level market 65556
- Home prices YoY
- 3.5%
- Active inventory
- 54
- Price-to-rent
- 6.9×
Monthly cashflow live
- Estimated rent
- $961 medium interval (Pro) →
- Mortgage (P&I)
- −$419
- Tax from tax record
- −$30 /mo · $357/yr
- Insurance
- −$33
- HOA
- −$0
- Vacancy / Maint / Mgmt
- −$202
- Net cashflow
- $277
Break-even live
UW: 25.0% down · 7.5% · 30yr · 1.5% tax · 5.0% vac · 8.0% maint · 8.0% mgmt
Financing live
Cash to close
- Down payment
- $19,975
- Closing costs
- $2,397
- Reserves months
- —
- Total cash needed
- —
Loan-product check · same deal, 3 products live
Conventional
25% down · 7.5% · 30yr
- Down + closing
- —
- Monthly P&I
- —
- Monthly cashflow
- —
- DSCR
- —
- Eligible?
- —
Personal DTI + credit; lowest rate.
DSCR
20% down · 8.5% · 30yr
- Down + closing
- —
- Monthly P&I
- —
- Monthly cashflow
- —
- DSCR
- —
- Eligible?
- —
No personal income docs; deal must DSCR.
Hard money
10% down · 12.0% · 12mo
- Down + closing
- —
- Monthly P&I
- —
- Monthly cashflow
- —
- DSCR
- —
- Eligible?
- —
Short-term bridge; refi at stabilization.
Listing history 3 events
-
2026-05-06status Pending 652-char remark
-
2026-04-29$79,900 Active 652-char remark
-
1979-12-01soldstatus
ⓘ Source: listings_history table (triggers on properties + properties_extension) + one-shot
backfill from property_details.listing_events for pre-trigger history.
Tax reassessment forecast MO · Resets to sale price
- Current annual tax
- $357 · $30/mo
- Projected year-2 tax
- $775 · $65/mo
- Expected delta
- +$418/yr (+$35/mo · 117.2%)
ⓘ Screening estimate from a state-policy table — verify with the county assessor before closing.
Climate risk First Street
- Flood 1/10 Low FEMA zone X (unshaded) · 0% chance over 30 yrs
- Wildfire 4/10 Moderate
- Heat 4/10 Moderate 7 d/yr ≥106°F today · 19 d/yr by 30 yrs out
- Wind 2/10 Low 0% chance of damaging wind over 30 yrs
- Air quality 1/10 Low 0 unhealthy d/yr today · 0 by 30 yrs out
Nearby sold comps map
Loading sold comps map…
Walkable amenities ~0.75 mi
Loading nearby amenities…
Taxation est. · year 1
- Rental income
- $11,534
- − Mortgage interest
- −$4,476
- − Property taxes
- −$357
- − Insurance
- −$400
- − Repairs & maintenance
- −$923
- − Management
- −$923
- − Depreciation
- −$2,324
- Taxable income
- $2,132
- Est. tax owed @ 24.0%
- −$512
- After-tax cash flow
- $2,816/yr
For passive investors: Depreciation is non-cash, so a rental often shows a tax loss while cash-flowing — sheltering income. Rental losses are passive: they offset passive income freely, and up to $25,000/yr can offset ordinary (W-2) income if you actively participate and your MAGI is under $100k (phasing out to $0 by $150k); unused losses carry forward. On sale, claimed depreciation is recaptured at up to 25%, and gains may owe capital-gains tax (a 1031 exchange can defer both). Figures are a year-1 estimate at your 24.0% rate — not tax advice; consult a CPA.
Schools (NCES district)
- District
- Richland R-IV
- NCES district ID
- 2926430
- Math proficiency
- 30% ▼ -4.00%
- Reading proficiency
- 48% ▲ 6.00%
- Median HH income
- $39,740
- Composite
- 32.61/100
- National rank
- #5671
- State rank
- #171 of 324 in MO
Livability — Richland
- Score
- 59/100
- State rank
- #569
- US rank
- #20563
Category grades
Schools grade is shown separately in the Schools card above.
Census & demographics
- Population (ZIP)
- 5,019
Population outlook (Camden County) Hauer SSP2
- Today (2025)
- 44,585 people
- By 2030
- 44,476 · -0.2%
- By 2040
- 43,513 · -2.4%
- By 2050
- 41,705 · -6.5%
- By 2075
- 36,903 · -17.2%
- By 2100
- 30,164 · -32.3%
Race, ethnicity, and origin ACS 2023
- Neighborhood character
- Predominantly White (89%)
- Race & ethnicity
- White 89% Two or more races 6% Hispanic / Latino 5%
- Hispanic origin (detail)
- Mexican 3%
- Common ancestry
- Romanian 4% Iranian 2% Slovak 2%
- Foreign-born
- 1%
- Languages at home
- 98% English-only · Spanish 1%
Political lean MEDSL · Camden
- 2024 margin
- Solid R (+54.3) · D 22.4% · R 76.7%
- 2008→2024 swing
- -25.8pp toward R · 2008: -28.5pp · 2024: -54.3pp
- All cycles
- 2024: R+54.3 2020: R+53.2 2016: R+54.2 2012: R+39.3 2008: R+28.5
Not yet ingested
- Civics
- —
Market trends
- HPI YoY
- ▲ 6.60%
- Current HPI
- 197.128
- Rent YoY
- —
- Metro
- —
- State GDP YoY
- ▲ 1.84%
- F500 in state
- 20
Industry mix (Fortune 500 HQ in MO)
| Industry | F500 HQs | Revenue |
|---|---|---|
| Healthcare | 1 | $163B |
|
||
| Insurance | 1 | $21B |
|
||
| Industrial Technology | 1 | $17B |
|
||
| Retail | 1 | $16B |
|
||
| Industrial Distribution | 1 | $10B |
|
||
| Utilities | 1 | $9B |
|
||
Price history
4 events — show timeline
- 2026-06-01 Sold (Public Records) — Public Records
- 2026-05-06 Pending — MARIS as Distributed by MLS Grid
- 2026-04-29 Listed $79,900 MARIS as Distributed by MLS Grid
- 1979-12-01 Sold (Public Records) — Public Records
Property tax history
-0.4%/yrLatest (2025): $357 · -2.5% YoY. Source: county tax records.
Cash-flow waterfall
monthlySold comps — $/sqft
last 12 mo · ≤1 miLoading sold comps…