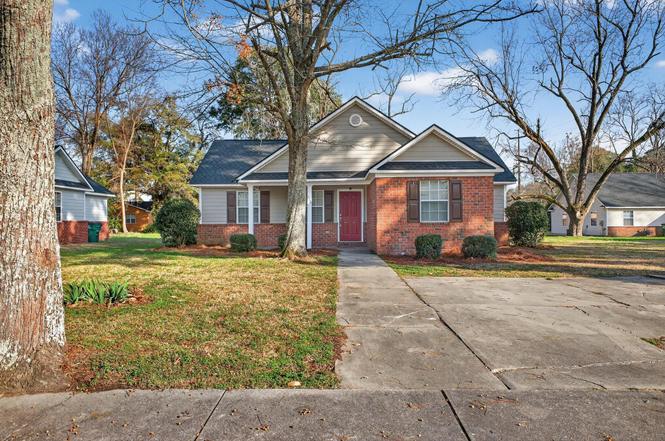
216 Williamsburg St NE · Aiken, SC
Flood risk No data
- FEMA flood zone
- —
- Chance of flooding over 30 yrs
- —
- Est. flood insurance / yr
- —
Fire risk No data
- Est. fire insurance / yr
- —
Heat risk No data
- Hot days now (above threshold)
- —
- Hot days in 30 yrs
- —
Wind risk No data
- Chance of severe wind over 30 yrs
- —
Air-quality risk No data
- Unhealthy air days now
- —
- Unhealthy air days in 30 yrs
- —
Risk factors via First Street. Map © Google.
Why this score? — see what drove the D grade
The composite is a weighted blend of 9 inputs, each scored 0–100. Each bar is that input's sub-score; the figure is the points it added to the 100-point composite (weight × sub-score).
- Cash flow +12.2/30.0
- ARV discount +11.0/15.0
- Rent growth +3.8/5.0
- DSCR +3.6/10.0
- 1% rule +3.5/10.0
- Livability +3.4/5.0
- Schools +3.2/10.0
- Condition / age +2.5/5.0
- Appreciation +0.0/10.0
$196,000
🖨 Deal sheet 📄 Offer letter ✓ Due diligence
Listing remarks
Heritage Pointe is a newly developed affordable housing community, offered in accordance with the 2025 HUD Income Limits. Enjoy a nice open floor plan with split Spacious living, high ceilings, open kitchen and breakfast area, this home has been renovated to include a new roof, new HVAC, new interior paint, new LVP flooring throughout, brand new appliances to include a side-by-side refrigerator, and new hardware and fixtures. This property is conveniently located to downtown eateries and shopping, as well as a short commute to I-20.
Key facts
- Open floor plan
- Brand new appliances
- New hvac
Tags
Property features AI
Finance
- HOA & community: No community amenities listed
Exterior
- Parking: Driveway
- Security: Smoke detectors
- Utilities: Public water; Public sewer; Electricity available
- Home design: Single-family residence; One level
- Construction: Brick and vinyl siding exterior; Shingle roof; Slab foundation; Built area approximately 1,200
- Exterior features: Porch; Patio; Landscaped lot; Paved road access
Interior
- Kitchen: Dishwasher; Range; Microwave; Refrigerator
- Flooring: Laminate flooring
- Bathrooms: 2 full bathrooms
- Heating & cooling: Electric heating; Central air conditioning; Ceiling fans
- Interior features: Ceiling fans; Pantry
Neighborhood map
What this means for you Summary
Snapshot
- This is a 3-bed/2.0-bath single-family listed at $196k.
Deal economics
- At list price, monthly cash flow is $-41 ($-492/yr) — negative.
- To cash-flow at today's rent, offer at most $190k (3.0% below list).
- To meet the 1% rule (rent ≥ 1% of price), the offer needs to be $166k (15.2% below list).
- Recommended offer: $166k (15.2% below list) — sets the bar for 1% rule.
- Cap rate 6.0% vs local median 4.1% in Aiken — top-decile yield for the area; either an underpriced asset or a hidden risk that comps aren't pricing in. Stress-test before assuming the spread holds.
Location & tenants
- Location reads 67/100 on livability (#93 in SC) — a middle-class / working-renter tenant base. Strengths: housing A+, health & safety A+, cost of living A; Watch: crime F, commute F.
- Aiken 01 (suburban): math 31% / reading 44% proficiency, ranked #36 of 80 in SC (top 45%) — families likely to look elsewhere, expect single-tenant / working-renter base with shorter leases.
- Zoned schools: Chukker Creek Elementary (math 51% / reading 55%, grade C, #138 of 597 statewide, top 24%, 664 students, 30% FRL); Schofield Middle (math 18% / reading 30%, grade F, #167 of 229 statewide, top 74%, 401 students, 100% FRL); Aiken High (math 19% / reading 84%, grade D+, #146 of 196 statewide, top 75%, 1,195 students, 100% FRL) — zoned schools average 77% FRL vs 54% district-wide (23 pts higher); higher-poverty schools than district average — tighter screening recommended.
- Market conditions: Rents rising fast (+5.1%/yr); 521 active listings in the ZIP; 13 comparable units currently listed for rent nearby; rentals at typical pace (median 21d on market — plan ~3-4 weeks tenant-placement turnaround); 2,500 units permitted in Aiken County in 2024 (1,023 in 5+ unit buildings).
- This rent runs 33% of the median local income ($60k/yr) — at the standard rent-burdened threshold; future hikes will face affordability resistance.
Forward outlook
- Local home prices are declining (-3.0%/yr); year-one equity from $1k of loan paydown is wiped out by about $6k of value loss. Plan a longer hold.
- Aiken County population projected at +9% by 2050 — modest demand growth; plan on rents tracking national, not racing it.
Negotiation context
- It's been on market 111 days — a 9% lower offer ($178k) is reasonable based on typical stale-listing flexibility.
Questions for the listing agent
- What do current leases actually rent for vs. the listed asking? Can we see a recent rent roll and the last 12 months of T-12 income?
- It's been on market 111 days. Have you received any prior offers? Is the seller open to a 15% concession, seller financing, or rate buy-down credit?
- Why hasn't it sold? Are there any deal-killer items the seller is aware of (foundation, flood, title, zoning, code violations)?
- Is there a deadline driving the sale (1031 exchange, divorce, estate, relocation)? That informs how much negotiation room exists.
- Schools are B-rated — typically a magnet for longer-tenancy family renters. What's the average tenant stay here, and is there a school-zone premium baked into asking?
- Crime grade is F in this area — have there been break-ins, vandalism, or insurance claims at this property in the last 3 years? What carrier currently insures it and at what premium?
- The area grade is low — what's the realistic commute time and amenity access for the typical tenant pool here? Any planned neighborhood developments (good or bad) we should know about?
- What's the average days-on-market for RENTAL listings here right now (not sales)? A rising rental-DOM trend means longer vacancies and softer asking-rent achievability than the comps imply.
- What's the recent tenant-quality profile in this submarket — average credit score on applications, eviction rate, late-payment / NSF rate, and stable-employment percentage? A property-management company in the area should have these aggregated.
- How much new for-sale + rental construction is in the pipeline within 1–3 miles? Heavy new supply typically softens prices + rents 12–24 months out; constrained supply supports both.
Investment metrics
- 1% rule
- 0.85% ✗
- Cap rate
- 6.04%
- Cash-on-cash
- -0.90%
- DSCR
- 0.96
- GRM
- 9.8
CMA / ARV
- ARV (on-the-fly)
- $212,400
- Comps found
- 12
Show comp detail 12 sales within ~0.75 mi
| Address | Dist | Beds/Ba | Sqft | Sold | Price | $/sf | Match |
|---|---|---|---|---|---|---|---|
| 256 NE Williamsburg St | 0.07mi | 2/1.0 (-1) | 1,139 (-5%) | 5mo | $129,000 | $113 | 75 |
| 112 Backwoods Ln NE | 0.07mi | 3/2.0 | 1,366 (+14%) | 10mo | $395,000 | $289 | 66 |
| 458 Williamsburg St NE | 0.37mi | 2/2.0 (-1) | 1,200 (0%) | 17mo | $189,500 | $158 | 64 |
| 547 Gwinnett St NE | 0.51mi | 3/1.0 | 1,250 (+4%) | 2mo | $100,000 | $80 | 63 |
| 1021 Colleton Ave SE | 0.51mi | 2/1.5 (-1) | 1,240 (+3%) | 6mo | $385,000 | $310 | 59 |
| 122 SE Union St | 0.47mi | 2/2.0 (-1) | 1,204 (+0%) | 19mo | $285,000 | $237 | 56 |
| 1405 Thorpe Ln Ln SE | 0.61mi | 3/2.0 | 1,284 (+7%) | 6mo | $184,900 | $144 | 55 |
| 512 NE Hampton Ave | 0.51mi | 3/1.0 | 1,068 (-11%) | 8mo | $55,000 | $51 | 47 |
| 811 Colleton Ave SE | 0.50mi | 2/1.0 (-1) | 1,064 (-11%) | 8mo | $450,000 | $423 | 42 |
| 413 Union St NE | 0.54mi | 2/2.0 (-1) | 1,302 (+8%) | 16mo | $230,000 | $177 | 42 |
| 449 Union St NE | 0.57mi | 4/1.0 (+1) | 1,306 (+9%) | 19mo | $120,000 | $92 | 34 |
| 341 Beaufort St SE | 0.61mi | 2/1.0 (-1) | 1,040 (-13%) | 22mo | $330,000 | $317 | 22 |
Match score weights: distance 35% · size 25% · config 20% · recency 20%. Top-matched comps best support the ARV.
Projected returns pro-forma
-3.0% appreciation · 5.06% rent growth · sell at horizon
- IRR
- -15.5%
- Equity multiple
- 0.44×
- Total profit
- $-30,832
- Equity at exit
- $29,224
- IRR
- -3.8%
- Equity multiple
- 0.73×
- Total profit
- $-15,058
- Equity at exit
- $16,946
Cash invested: $54,880 (down + closing). Projections, not guarantees.
Landlord ↔ Tenant lean methodology
- Overall (STATE)
- 90 Strongly Landlord-Friendly
- State South Carolina
- 90 Strongly Landlord-Friendly · R+6
- County
- — inherits STATE
- City
- — inherits STATE
ZIP-level market 29801
- Rents YoY
- 5.1%
- Active inventory
- 521
- Price-to-rent
- 9.8×
Monthly cashflow live
- Estimated rent
- $1,663 high interval (Pro) →
- Mortgage (P&I)
- −$1,028
- Tax est. 1.5%
- −$245 /mo · $2,940/yr
- Insurance
- −$82
- HOA
- −$0
- Vacancy / Maint / Mgmt
- −$349
- Net cashflow
- $-41
Break-even live
UW: 25.0% down · 7.5% · 30yr · 1.5% tax · 5.0% vac · 8.0% maint · 8.0% mgmt
Financing live
Cash to close
- Down payment
- $49,000
- Closing costs
- $5,880
- Reserves months
- —
- Total cash needed
- —
Loan-product check · same deal, 3 products live
Conventional
25% down · 7.5% · 30yr
- Down + closing
- —
- Monthly P&I
- —
- Monthly cashflow
- —
- DSCR
- —
- Eligible?
- —
Personal DTI + credit; lowest rate.
DSCR
20% down · 8.5% · 30yr
- Down + closing
- —
- Monthly P&I
- —
- Monthly cashflow
- —
- DSCR
- —
- Eligible?
- —
No personal income docs; deal must DSCR.
Hard money
10% down · 12.0% · 12mo
- Down + closing
- —
- Monthly P&I
- —
- Monthly cashflow
- —
- DSCR
- —
- Eligible?
- —
Short-term bridge; refi at stabilization.
Rent comps 13 comps
| Address | Beds | Baths | Sqft | Rent | $/sqft | DOM | Units | Dist |
|---|---|---|---|---|---|---|---|---|
| 328 Williamsburg St Aiken, SC | 2.0 | 1.0 | 1043 | $1,050 | $1.01 | 13d | 1 | 0.20mi |
| 206 Sumter St SE Aiken, SC | 2.0 | 2.0 | 1118 | $2,200 | $1.97 | 23d | 1 | 0.42mi |
| 524 Colleton Ave SE Aiken, SC | 2.0 | 2.0 | 1411 | $1,695 | $1.20 | 13d | 1 | 0.53mi |
| 126 Park Ave SE Unit C Aiken, SC | 2.0 | 2.0 | 1224 | $1,900 | $1.55 | 13d | 1 | 0.71mi |
| 337 E Boundary Ave SE Aiken, SC | 2.0 | 1.0 | 1185 | $1,750 | $1.48 | 21d | 1 | 0.71mi |
| 816 York St Aiken, SC | 2.0 | 1.0 | 1308 | $1,450 | $1.11 | 21d | 1 | 0.89mi |
| 461 E Boundary Ave SE Aiken, SC | 2.0 | 2.0 | 1500 | $2,100 | $1.40 | 23d | 1 | 0.90mi |
| 1445 Lyon Dr SE Apt 3 Aiken, SC | 2.0 | 1.0 | 1330 | $895 | $0.67 | 23d | 1 | 1.08mi |
| 566 Newberry St Aiken, SC | 2.0 | 1.0 | 1236 | $3,000 | $2.43 | 13d | 1 | 1.25mi |
| 301 Jehossee Dr SE Aiken, SC | 3.0 | 2.0 | 1437 | $1,590 | $1.11 | 21d | 1 | 1.42mi |
| 811 Laurens St NW Aiken, SC | 3.0 | 1.5 | 986 | $1,379 | $1.40 | 23d | 1 | 1.44mi |
| 630 Morgan St NW Unit A Aiken, SC | 3.0 | 1.0 | 950 | $1,100 | $1.16 | 23d | 1 | 1.47mi |
| 1223 York St NE Aiken, SC | 2.0 | 1.0 | 794 | $1,000 | $1.26 | 23d | 1 | 1.49mi |
Listing history 16 events
-
2026-06-18days on market $196,000 Active 111 DOM
-
2026-06-17days on market $196,000 Active 110 DOM
-
2026-06-16days on market $196,000 Active 109 DOM
-
2026-06-15days on market $196,000 Active 108 DOM
-
2026-06-14days on market $196,000 Active 106 DOM
-
2026-06-13days on market $196,000 Active 105 DOM
-
2026-06-10days on market $196,000 Active 103 DOM
-
2026-06-09days on market $196,000 Active 102 DOM
-
2026-06-08days on market $196,000 Active 101 DOM
-
2026-06-07days on market $196,000 Active 100 DOM
-
2026-06-03days on market $196,000 Active 96 DOM
-
2026-06-02days on market $196,000 Active 95 DOM
-
2026-06-01days on market $196,000 Active 94 DOM
-
2026-05-31days on market $196,000 Active 93 DOM
-
2026-05-30days on market $196,000 Active 92 DOM
-
2026-02-27$196,000 Active
ⓘ Source: listings_history table (triggers on properties + properties_extension) + one-shot
backfill from property_details.listing_events for pre-trigger history.
Nearby sold comps map
Loading sold comps map…
Walkable amenities ~0.75 mi
Loading nearby amenities…
Taxation est. · year 1
- Rental income
- $19,952
- − Mortgage interest
- −$10,979
- − Property taxes
- −$2,940
- − Insurance
- −$980
- − Repairs & maintenance
- −$1,596
- − Management
- −$1,596
- − Depreciation
- −$5,702
- Taxable loss
- −$3,841
- Est. tax savings @ 24.0%
- +$922
- After-tax cash flow
- $430/yr
For passive investors: Depreciation is non-cash, so a rental often shows a tax loss while cash-flowing — sheltering income. Rental losses are passive: they offset passive income freely, and up to $25,000/yr can offset ordinary (W-2) income if you actively participate and your MAGI is under $100k (phasing out to $0 by $150k); unused losses carry forward. On sale, claimed depreciation is recaptured at up to 25%, and gains may owe capital-gains tax (a 1031 exchange can defer both). Figures are a year-1 estimate at your 24.0% rate — not tax advice; consult a CPA.
Schools (NCES district)
- District
- Aiken 01
- NCES district ID
- 4500720
- Math proficiency
- 31% ▼ -11.00%
- Reading proficiency
- 44% ▼ -1.00%
- Median HH income
- $45,081
- Composite
- 31.91/100
- National rank
- #5857
- State rank
- #36 of 80 in SC
Livability — Aiken
- Score
- 67/100
- State rank
- #93
- US rank
- #10443
Category grades
Schools grade is shown separately in the Schools card above.
Census & demographics
- Census place
- Aiken, SC
- County
- Aiken County · 116,534 people
- City population
- 71,807
- Metro
- Augusta-Richmond County, GA-SC
- Population (ZIP)
- 31,108
- Household income
- $59,573
- Rent vs Own
- Severe rent burden
- 1260.0
Population outlook (Aiken County) Hauer SSP2
- Today (2025)
- 178,003 people
- By 2030
- 182,876 · +2.7%
- By 2040
- 189,970 · +6.7%
- By 2050
- 193,840 · +8.9%
- By 2075
- 199,453 · +12.1%
- By 2100
- 192,403 · +8.1%
Race, ethnicity, and origin ACS 2023
- Neighborhood character
- Diverse neighborhood (Simpson 0.57)
- Race & ethnicity
- White 50% Black 42% Hispanic / Latino 5% Two or more races 4% Asian 1%
- Hispanic origin (detail)
- Mexican 1% Puerto Rican 2%
- Common ancestry
- Slovak 2% Italian 1% Serbian 1%
- Foreign-born
- 3% · Canada, Jamaica
- Languages at home
- 95% English-only · Spanish 3% Other Indo-European 1%
Political lean MEDSL · Aiken
- 2024 margin
- Strong R (+25.9) · D 36.4% · R 62.2% · Other 1.4%
- 2008→2024 swing
- -1.9pp toward R · 2008: -24.0pp · 2024: -25.9pp
- All cycles
- 2024: R+25.9 2020: R+22.7 2016: R+27.5 2012: R+26.0 2008: R+24.0
Not yet ingested
- Civics
- —
Market trends
- HPI YoY
- ▼ -278.52%
- Current HPI
- 173.7944
- Rent YoY
- ▲ 5.06%
- Metro
- Augusta-Richmond County, GA-SC
- State GDP YoY
- ▲ 4.51%
- F500 in state
- 2
Industry mix (Fortune 500 HQ in SC)
| Industry | F500 HQs | Revenue |
|---|---|---|
| Packaging | 1 | $7B |
|
||
Price history
1 event — show timeline
- 2026-02-27 Listed $196,000 AMLS
Cash-flow waterfall
monthlySold comps — $/sqft
last 12 mo · ≤1 miLoading sold comps…