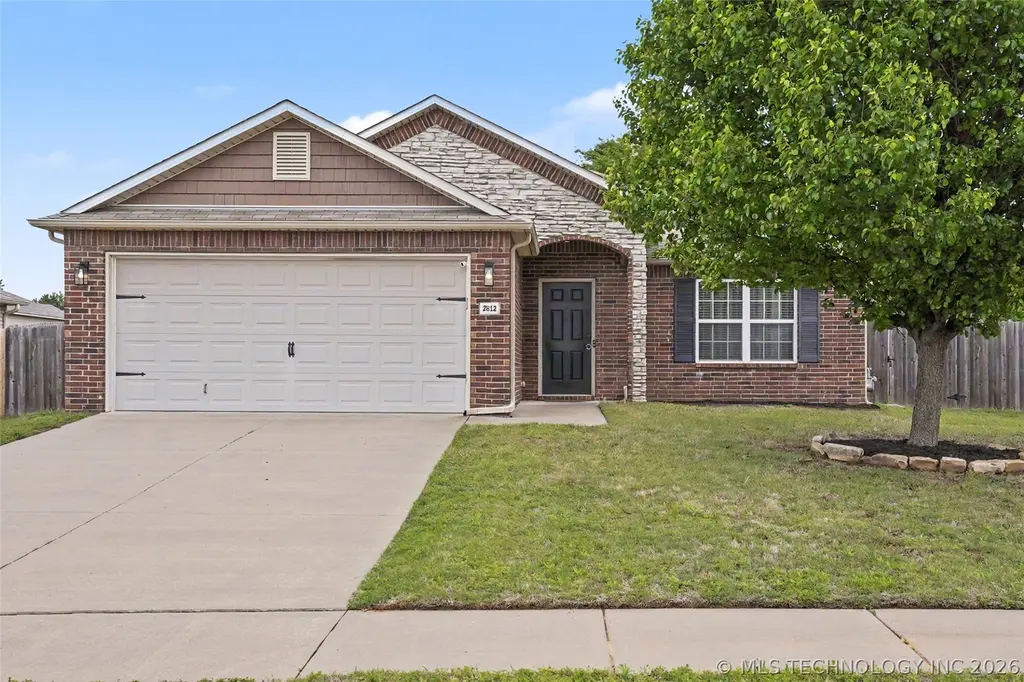
2612 W El Dorado St · Broken Arrow, OK
Flood risk 1/10 · Minimal
- FEMA flood zone
- X (unshaded)
- Chance of flooding over 30 yrs
- 0.0%
- Est. flood insurance / yr
- $473 – $860
Fire risk 4/10 · Minor
- Est. fire insurance / yr
- $2,463 – $4,575
Heat risk 7/10 · Major
- Hot days now (above 111°F)
- 7 days/yr
- Hot days in 30 yrs
- 18 days/yr
Wind risk 2/10 · Minimal
- Chance of severe wind over 30 yrs
- 3.0%
Air-quality risk 2/10 · Minimal
- Unhealthy air days now
- 1 days/yr
- Unhealthy air days in 30 yrs
- 1 days/yr
Risk factors via First Street. Map © Google.
Why this score? — see what drove the D grade
The composite is a weighted blend of 9 inputs, each scored 0–100. Each bar is that input's sub-score; the figure is the points it added to the 100-point composite (weight × sub-score).
- Cash flow +15.0/30.0
- ARV discount +7.5/15.0
- 1% rule +5.0/10.0
- DSCR +5.0/10.0
- Livability +3.9/5.0
- Rent growth +3.5/5.0
- Condition / age +2.5/5.0
- Schools +2.4/10.0
- Appreciation +0.0/10.0
$15,000
🖨 Deal sheet 📄 Offer letter ✓ Due diligence
Listing remarks MLS
Come fall in love with this charming home in desirable Iron Horse Ranch! This popular neighborhood has great amenities for everyone; pool, park, walking trails, and a clubhouse. This 3 bed, 2 full bath cute home features an open floor plan with fresh interior paint, a spacious primary suite, and a covered back patio overlooking the large yard with full privacy fence.
Key facts
- Open floor plan
- Full privacy fence
- Neighborhood w ponds
Tags
Property features AI
Finance
- Other: Lot has mature trees
- HOA & community: Homeowners association with annual fee; Annual association fee: $405; Community amenities include clubhouse, park, and trails; Community features include gutters and sidewalks
Exterior
- Parking: Attached 2-car garage
- Security: Owned security system; Smoke detectors; No safety shelter
- Utilities: Cable available; Electricity available; Natural gas available; Public water; Public sewer
- Home design: Single-story home; Faces south; Slab foundation; Property type: single-family
- Construction: Brick, Masonite and wood frame construction; Asphalt/fiberglass roof; Built per public records
- Exterior features: Concrete driveway; Exterior lighting; Rain gutters; Covered patio and porch; Porch
Interior
- Kitchen: Pantry; Dishwasher; Disposal; Microwave; Oven; Range; Plumbed for ice maker
- Bedrooms: Master bedroom with private bath and walk-in closet (first floor); Additional bedrooms (first floor)
- Flooring: Vinyl flooring
- Bathrooms: Master bathroom with bathtub, double sink, full bath (first floor); Hall bath with bathtub, full bath (first floor); Total of 2 full bathrooms
- Heating & cooling: Central heating (gas); Central air conditioning
- Interior features: High-speed internet; Cable TV; Wired for data; Ceiling fans; Laminate counters; Electric oven and range connections; Vinyl windows
- Laundry & utility: Washer hookup; Electric dryer hookup; Inside utility room
Neighborhood map
What this means for you Summary
Snapshot
- This is a 3-bed/2.0-bath single-family listed at $15k.
Deal economics
- At list price, monthly cash flow is $2k ($20k/yr) — positive.
- The deal already cash-flows at list — no discount required.
- Meets the 1% rule at list price ($2k rent vs $15k).
- Recommended offer: $15k (1.5% below list) — sets the bar for market timing.
- Cap rate 139.4% vs local median 4.0% in Broken Arrow — top-decile yield for the area; either an underpriced asset or a hidden risk that comps aren't pricing in. Stress-test before assuming the spread holds.
Location & tenants
- Location reads 78/100 on livability (#7 in OK, #2,691 nationally) — a middle-class / working-renter tenant base. Strengths: commute A+, cost of living A+, housing A+; Watch: schools D+, amenities F.
- Broken Arrow (suburban): math 23% / reading 28% proficiency, ranked #79 of 270 in OK (top 29%) — low school quality limits family demand, transient renter base, plan for 1-2y turnover.
- Market conditions: Rents rising fast (+4.1%/yr); 381 active listings in the ZIP; 8 comparable units currently listed for rent nearby; rentals leasing fast (median 2d on market — plan ~1-2 weeks tenant-placement turnaround); solid renter incomes; 2,818 units permitted in Tulsa County in 2024 (518 in 5+ unit buildings).
Forward outlook
- Local home prices are declining (-3.0%/yr); year-one equity from $104 of loan paydown is wiped out by about $450 of value loss. Plan a longer hold.
- Tulsa County population projected at +30% by 2050 — long-run rental-demand tailwind backs the buy-and-hold thesis.
- At projected returns (-3.0% appreciation + 4.1% rent growth), your $4k cash investment doubles in ~1 year — after that, you're playing with house money.
Negotiation context
- It's been on market 15 days — a 2% lower offer ($15k) is reasonable based on typical stale-listing flexibility.
- 5 sale attempts since 13y ago; this cycle's ask has dropped $235k (94%) from the opening price — seller is motivated, your offer sets the floor, not the list.
Risks & watch-outs
- Climate carrying-cost: extreme-heat days projected 7→18/yr by 2055 (HVAC capex compounding) — expect insurance premiums to compound above CPI over the hold.
Questions for the listing agent
- Is there a deadline driving the sale (1031 exchange, divorce, estate, relocation)? That informs how much negotiation room exists.
- Schools are D-rated, which usually means shorter tenancies and higher turnover. Who's the typical renter profile here, and what's been the actual vacancy rate?
- The area grade is low — what's the realistic commute time and amenity access for the typical tenant pool here? Any planned neighborhood developments (good or bad) we should know about?
- What's the average days-on-market for RENTAL listings here right now (not sales)? A rising rental-DOM trend means longer vacancies and softer asking-rent achievability than the comps imply.
- What's the recent tenant-quality profile in this submarket — average credit score on applications, eviction rate, late-payment / NSF rate, and stable-employment percentage? A property-management company in the area should have these aggregated.
- How much new for-sale + rental construction is in the pipeline within 1–3 miles? Heavy new supply typically softens prices + rents 12–24 months out; constrained supply supports both.
Investment metrics
- 1% rule
- 14.91% ✓
- Cap rate
- 139.38%
- Cash-on-cash
- 475.31%
- DSCR
- 22.15
- GRM
- 0.6
CMA / ARV
- ARV (on-the-fly)
- $244,125
- Comps found
- 12
Show comp detail 12 sales within ~0.75 mi
| Address | Dist | Beds/Ba | Sqft | Sold | Price | $/sf | Match |
|---|---|---|---|---|---|---|---|
| 2612 W El Dorado St | 0.00mi | 3/2.0 | 1,395 (0%) | 1mo | $250,000 | $179 | 99 |
| 2705 W Decatur St | 0.05mi | 3/2.0 | 1,385 (-1%) | 3mo | $229,000 | $165 | 94 |
| 7401 S Elder Ave | 0.08mi | 3/2.0 | 1,336 (-4%) | 1mo | $234,000 | $175 | 88 |
| 2705 W Charlotte St | 0.09mi | 3/2.0 | 1,464 (+5%) | 9mo | $244,000 | $167 | 80 |
| 7300 S Gardenia Ave | 0.15mi | 3/2.0 | 1,535 (+10%) | 5mo | $246,000 | $160 | 72 |
| 2805 W Fredericksburg St | 0.16mi | 3/2.0 | 1,511 (+8%) | 10mo | $263,000 | $174 | 71 |
| 7416 S Laurel Ave | 0.46mi | 3/2.0 | 1,544 (+11%) | 3mo | $287,500 | $186 | 58 |
| 3220 W Mobile St | 0.68mi | 3/2.0 | 1,503 (+8%) | 1mo | $265,000 | $176 | 55 |
| 3131 W Yuma Ct S | 0.49mi | 3/2.0 | 1,586 (+14%) | 3mo | $304,700 | $192 | 52 |
| 2901 W Mobile Pl | 0.63mi | 3/2.0 | 1,494 (+7%) | 10mo | $259,900 | $174 | 50 |
| 2410 W Little Rock Ct S | 0.49mi | 3/2.0 | 1,599 (+15%) | 7mo | $287,200 | $180 | 47 |
| 8324 S Gardenia Ave | 0.71mi | 3/2.0 | 1,584 (+14%) | 9mo | $276,000 | $174 | 37 |
Match score weights: distance 35% · size 25% · config 20% · recency 20%. Top-matched comps best support the ARV.
Projected returns pro-forma
-3.0% appreciation · 4.09% rent growth · sell at horizon
- IRR
- —
- Equity multiple
- 26.25×
- Total profit
- $106,039
- Equity at exit
- $2,237
- IRR
- —
- Equity multiple
- 57.98×
- Total profit
- $239,313
- Equity at exit
- $1,297
Cash invested: $4,200 (down + closing). Projections, not guarantees.
Landlord ↔ Tenant lean methodology
- Overall (STATE)
- 83 Strongly Landlord-Friendly
- State Oklahoma
- 83 Strongly Landlord-Friendly · R+20
- County
- — inherits STATE
- City
- — inherits STATE
ZIP-level market 74011
- Rents YoY
- 4.1%
- Active inventory
- 381
- Price-to-rent
- 0.6×
Monthly cashflow live
- Estimated rent
- $2,237 high interval (Pro) →
- Mortgage (P&I)
- −$79
- Tax est. 1.5%
- −$19 /mo · $225/yr
- Insurance
- −$6
- HOA
- −$0
- Vacancy / Maint / Mgmt
- −$470
- Net cashflow
- $1,664
Break-even live
UW: 25.0% down · 7.5% · 30yr · 1.5% tax · 5.0% vac · 8.0% maint · 8.0% mgmt
Financing live
Cash to close
- Down payment
- $3,750
- Closing costs
- $450
- Reserves months
- —
- Total cash needed
- —
Loan-product check · same deal, 3 products live
Conventional
25% down · 7.5% · 30yr
- Down + closing
- —
- Monthly P&I
- —
- Monthly cashflow
- —
- DSCR
- —
- Eligible?
- —
Personal DTI + credit; lowest rate.
DSCR
20% down · 8.5% · 30yr
- Down + closing
- —
- Monthly P&I
- —
- Monthly cashflow
- —
- DSCR
- —
- Eligible?
- —
No personal income docs; deal must DSCR.
Hard money
10% down · 12.0% · 12mo
- Down + closing
- —
- Monthly P&I
- —
- Monthly cashflow
- —
- DSCR
- —
- Eligible?
- —
Short-term bridge; refi at stabilization.
Rent comps 8 comps
| Address | Beds | Baths | Sqft | Rent | $/sqft | DOM | Units | Dist |
|---|---|---|---|---|---|---|---|---|
| 2430 W Imperial Ct Broken Arrow, OK | 3.0 | 2.0 | 1726 | $2,415 | $1.40 | 2d | 1 | 0.33mi |
| 2420 W Imperial Ct Broken Arrow, OK | 3.0 | 2.0 | 1726 | $2,415 | $1.40 | 2d | 1 | 0.34mi |
| 2421 W Imperial Ct Broken Arrow, OK | 3.0 | 2.0 | 1726 | $2,415 | $1.40 | 2d | 1 | 0.36mi |
| 7313 S Walnut Ave Broken Arrow, OK | 3.0 | 2.0 | 1600 | $1,990 | $1.24 | 10d | 1 | 0.41mi |
| 2008 W Huntsville Pl Broken Arrow, OK | 3.0 | 2.0 | 1568 | $2,100 | $1.34 | 3d | 1 | 0.46mi |
| 7211 S Laurel Pl Broken Arrow, OK | 4.0 | 2.0 | 1851 | $2,200 | $1.19 | 3d | 1 | 0.51mi |
| 2602 W Tucson St Broken Arrow, OK | 1.0–2.0 | 1.0–2.5 | 1028 | $1,884 | $1.83 | 2d | 19 | 0.86mi |
| 4500 W Winston St Broken Arrow, OK | 4.0 | 2.0 | 1812 | $2,445 | $1.35 | 2d | 1 | 1.20mi |
Listing history 27 events
-
2026-06-18days on market $15,000 Active 15 DOM
-
2026-06-17days on market $15,000 Active 14 DOM
-
2026-06-16days on market $15,000 Active 13 DOM
-
2026-06-15days on market $15,000 Active 12 DOM
-
2026-06-13days on market $15,000 Active 10 DOM
-
2026-06-10days on market $15,000 Active 7 DOM
-
2026-06-09days on market $15,000 Active 6 DOM
-
2026-06-08days on market $15,000 Active 5 DOM
-
2026-06-07days on market $15,000 Active 4 DOM
-
2026-06-05pricestatusdays on market $15,000 Active 1 DOM
-
2026-05-01status Pending
-
2026-04-17$250,000 Active
-
2024-04-18soldstatus $250,000
-
2024-04-12soldstatus $250,000 Closed 369-char remark
Show marketing remark (369 chars)
Come fall in love with this charming home in desirable Iron Horse Ranch! This popular neighborhood has great amenities for everyone; pool, park, walking trails, and a clubhouse. This 3 bed, 2 full bath cute home features an open floor plan with fresh interior paint, a spacious primary suite, and a covered back patio overlooking the large yard with full privacy fence.
-
2024-03-18status Pending 369-char remark
Show marketing remark (369 chars)
Come fall in love with this charming home in desirable Iron Horse Ranch! This popular neighborhood has great amenities for everyone; pool, park, walking trails, and a clubhouse. This 3 bed, 2 full bath cute home features an open floor plan with fresh interior paint, a spacious primary suite, and a covered back patio overlooking the large yard with full privacy fence.
-
2024-03-08$248,000 Active 369-char remark
Show marketing remark (369 chars)
Come fall in love with this charming home in desirable Iron Horse Ranch! This popular neighborhood has great amenities for everyone; pool, park, walking trails, and a clubhouse. This 3 bed, 2 full bath cute home features an open floor plan with fresh interior paint, a spacious primary suite, and a covered back patio overlooking the large yard with full privacy fence.
-
2021-12-06soldstatus $210,000
-
2021-11-30soldstatus $210,000 Closed 416-char remark
Show marketing remark (416 chars)
3 bedroom, 2 full bath brick home located in desirable Iron Horse Ranch neighborhood. Open floor plan. Master bedroom with ensuite bath and double sinks. Large walk in closet. Nice size kitchen with lots of cabinet space! This home has been so well maintained. Move in ready! 2 car garage. Full privacy fence with large backyard. Neighborhood amenities include clubhouse, splash pad, playground, park & pond.
-
2021-11-16status Pending 416-char remark
Show marketing remark (416 chars)
3 bedroom, 2 full bath brick home located in desirable Iron Horse Ranch neighborhood. Open floor plan. Master bedroom with ensuite bath and double sinks. Large walk in closet. Nice size kitchen with lots of cabinet space! This home has been so well maintained. Move in ready! 2 car garage. Full privacy fence with large backyard. Neighborhood amenities include clubhouse, splash pad, playground, park & pond.
-
2021-10-31$205,000 Active 416-char remark
Show marketing remark (416 chars)
3 bedroom, 2 full bath brick home located in desirable Iron Horse Ranch neighborhood. Open floor plan. Master bedroom with ensuite bath and double sinks. Large walk in closet. Nice size kitchen with lots of cabinet space! This home has been so well maintained. Move in ready! 2 car garage. Full privacy fence with large backyard. Neighborhood amenities include clubhouse, splash pad, playground, park & pond.
-
2016-09-01soldstatus $150,100
-
2016-08-30soldstatus $150,000 Closed
-
2016-07-25status Pending
-
2016-07-19$150,000 Active
-
2013-05-05historical
-
2013-05-03$145,328
-
2011-01-04soldstatus $3,617,500
ⓘ Source: listings_history table (triggers on properties + properties_extension) + one-shot
backfill from property_details.listing_events for pre-trigger history.
Climate risk First Street
- Flood 1/10 Low FEMA zone X (unshaded) · 0% chance over 30 yrs
- Wildfire 4/10 Moderate
- Heat 7/10 Severe 7 d/yr ≥111°F today · 18 d/yr by 30 yrs out
- Wind 2/10 Low 3% chance of damaging wind over 30 yrs
- Air quality 2/10 Low 1 unhealthy d/yr today · 1 by 30 yrs out
Nearby sold comps map
Loading sold comps map…
Walkable amenities ~0.75 mi
Loading nearby amenities…
Taxation est. · year 1
- Rental income
- $26,844
- − Mortgage interest
- −$840
- − Property taxes
- −$225
- − Insurance
- −$75
- − Repairs & maintenance
- −$2,148
- − Management
- −$2,148
- − Depreciation
- −$436
- Taxable income
- $20,973
- Est. tax owed @ 24.0%
- −$5,033
- After-tax cash flow
- $14,930/yr
For passive investors: Depreciation is non-cash, so a rental often shows a tax loss while cash-flowing — sheltering income. Rental losses are passive: they offset passive income freely, and up to $25,000/yr can offset ordinary (W-2) income if you actively participate and your MAGI is under $100k (phasing out to $0 by $150k); unused losses carry forward. On sale, claimed depreciation is recaptured at up to 25%, and gains may owe capital-gains tax (a 1031 exchange can defer both). Figures are a year-1 estimate at your 24.0% rate — not tax advice; consult a CPA.
Schools (NCES district)
- District
- Broken Arrow
- NCES district ID
- 4005490
- Math proficiency
- 23% ▼ -9.00%
- Reading proficiency
- 28% ▼ -9.00%
- Median HH income
- $64,646
- Composite
- 23.86/100
- National rank
- #7801
- State rank
- #79 of 270 in OK
Livability — Broken Arrow
- Score
- 78/100
- State rank
- #7
- US rank
- #2691
Category grades
Schools grade is shown separately in the Schools card above.
Census & demographics
- Census place
- Broken Arrow, OK
- County
- Tulsa County · 640,811 people
- City population
- 144,172
- Metro
- Tulsa, OK
- Population (ZIP)
- 33,900
- Household income
- $99,157
- Rent vs Own
- Severe rent burden
- 389.0
Population outlook (Tulsa County) Hauer SSP2
- Today (2025)
- 723,846 people
- By 2030
- 766,033 · +5.8%
- By 2040
- 851,386 · +17.6%
- By 2050
- 938,389 · +29.6%
- By 2075
- 1,166,011 · +61.1%
- By 2100
- 1,350,277 · +86.5%
Race, ethnicity, and origin ACS 2023
- Neighborhood character
- Predominantly White (68%)
- Race & ethnicity
- White 68% Two or more races 15% Hispanic / Latino 10% Native American 4% Black 4% Asian 3%
- Hispanic origin (detail)
- Mexican 7%
- Common ancestry
- Lithuanian 3% Serbian 2% Slovak 2%
- Foreign-born
- 5% · Canada
- Languages at home
- 93% English-only · Spanish 5% Other Asian/Pacific 1%
Political lean MEDSL · Tulsa
- 2024 margin
- R (+15.2) · D 41.3% · R 56.5% · Other 2.2%
- 2008→2024 swing
- +9.2pp toward D · 2008: -24.5pp · 2024: -15.2pp
- All cycles
- 2024: R+15.2 2020: R+15.6 2016: R+22.9 2012: R+27.4 2008: R+24.5
Not yet ingested
- Civics
- —
Market trends
- HPI YoY
- ▼ -180.15%
- Current HPI
- 210.8302
- Rent YoY
- ▲ 4.09%
- Metro
- Tulsa, OK
- State GDP YoY
- ▲ 1.55%
- F500 in state
- 6
Industry mix (Fortune 500 HQ in OK)
| Industry | F500 HQs | Revenue |
|---|---|---|
| Energy | 3 | $48B |
|
||
Price history
-93.1% since first listed17 events — show timeline
- 2026-05-01 Pending — MLS Technology, Inc.
- 2026-04-17 Listed $250,000 MLS Technology, Inc.
- 2024-04-18 Sold (Public Records) $250,000 Public Records
- 2024-04-12 Sold (MLS) $250,000 MLS Technology, Inc.
- 2024-03-18 Pending — MLS Technology, Inc.
- 2024-03-08 Listed $248,000 MLS Technology, Inc.
- 2021-12-06 Sold (Public Records) $210,000 Public Records
- 2021-11-30 Sold (MLS) $210,000 MLS Technology, Inc.
- 2021-11-16 Pending — MLS Technology, Inc.
- 2021-10-31 Listed $205,000 MLS Technology, Inc.
- 2016-09-01 Sold (Public Records) $150,100 Public Records
- 2016-08-30 Sold (MLS) $150,000 MLS Technology, Inc.
- 2016-07-25 Pending — MLS Technology, Inc.
- 2016-07-19 Listed $150,000 MLS Technology, Inc.
- 2013-05-05 Listing Removed — MLS Technology, Inc.
- 2013-05-03 Listed $145,328 MLS Technology, Inc.
- 2011-01-04 Sold (Public Records) $3,617,500 Public Records
Property tax history
+6.0%/yrLatest (2025): $3,531 · +16.9% YoY. Source: county tax records.
Cash-flow waterfall
monthlySold comps — $/sqft
last 12 mo · ≤1 miLoading sold comps…